1、Build a histogram
In [1]: help(plt.hist)
Help on function hist in module matplotlib.pyplot:

hist(x, bins=10, range=None, normed=False, weights=None, cumulative=False, bottom=None, histtype='bar', align='mid', orientation='vertical', rwidth=None, log=False, color=None, label=None, stacked=False, hold=None, data=None, **kwargs)
    Plot a histogram.
# Create histogram of life_exp data
plt.hist(life_exp);

# Display histogram
plt.show()
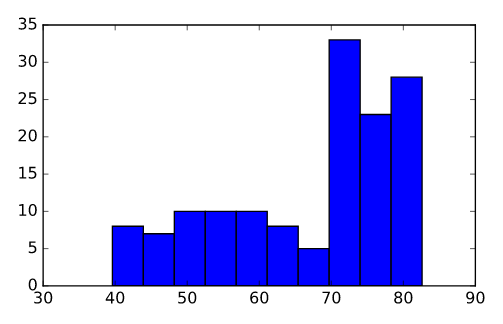
2、Bins
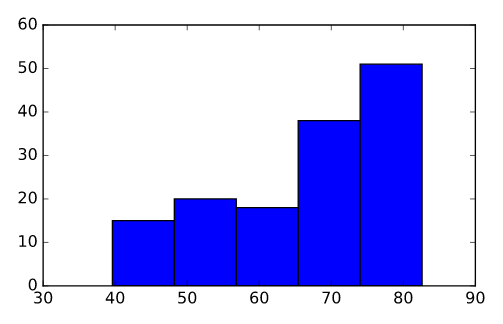
# Build histogram with 5 bins
plt.hist(life_exp, bins = 5)

# Show and clean up plot
plt.show()
plt.clf()

# Build histogram with 20 bins
plt.hist(life_exp, bins = 20)

# Show and clean up again
plt.show()
plt.clf()
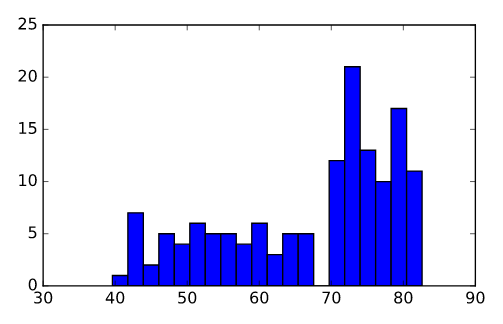
3、Compare
# Histogram of life_exp, 15 bins
plt.hist(life_exp, bins = 15)

# Show and clear plot
plt.show()
plt.clf()

# Histogram of life_exp1950, 15 bins
plt.hist(life_exp1950, bins = 15)

# Show and clear plot again
plt.show()
plt.clf()