并自己对生疏不解之处做了补充和注释。
当然,况客的R SDK的强大之处在于,你注册账号,进入网站的控制台后,会直接在浏览器模拟出一个RStudio的页面,可以直接运行操作,还可以设置。
而对于的qutke包,托管于github,所谓的API,应当就是指这个包的用法。
每个人会分配一个私钥。
个人感觉,现在他仅仅是提供了一个浏览器平台,以及数据获取方式的qutke。
恩,大家都吐槽quantmod的不的数据不准确(尤其雅虎财经现在不上心)
恩,那么我们尝试下wind吧,wind的话,他的R插件其实也蛮奇怪的,首先,是不能在CRAN上找到的。
其次,一般的方法是登录windPC端(需要账号)。文件——修复插件——修复R插件——确定,然后就是命令行界面一阵滚屏,按任意键推出即可。
(这样的安装方式,应该是更利于其控制接入吧,他就可以收费啦)
输入以下代码:
library(WindR)w.start()
即得到下图。

按钮和excel插件的按钮作用相似,而且,点击之后出来的选择参数、时间等各种的界面和excel插件的作用完全一致。
点击确定后,将出现一行文本

恩,我们只需要复制这行文本,作为代码运行他,即可将满足我们要求的数据提取到对应的w_wsi_data对象中了,恩,使用class/mode函数,我们可以指导其是一个list。
我们当然可以不借助GUI的帮助,如果我们熟悉其函数的话,我们也可以根据自己的喜欢,改变各种参数和变量名。
况客
第一步安装包
library(quantmod)library(plyr)library(TTR)library(scales)library(ggplot2)library(DT)library(qutke)
第二步,设置key
key<-'faca4c8ff4dc1502d87944ea9cfd74f19918f0aef37fde6746b61d4d339bfcf3'init(key)# [1] "authorize success!"
authorize 授权。即初始化key之后,会返回一个“授权成功”
这个key应该是官方公用的?每个人自己也有一个私钥的
第三步,设置日期
sDate<- as.Date("2016-01-03") #开始日期eDate<- Sys.Date() # 截止今日日期tradingDay<-getDate(data="tradingDay",startdate=sDate,enddate=eDate,key=key)tradingDay
getDate中,我们指定了data的值为tradingDay,同时给定了起止日期,并告示key
此时的tradingDay中,全是交易日日期数据(非交易日不会被包含在里面哦)
第四步:获取行情数据
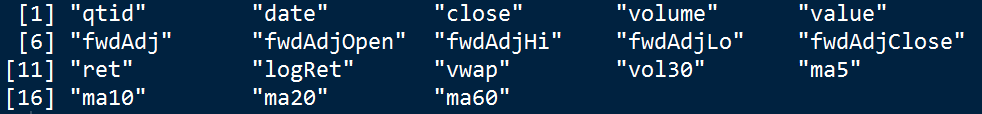
qtid<-c('000001.sz') #设置股票池dailyQuote<-getDailyQuote(data="mktFwdDaily",qtid=qtid,startdate=sDate,enddate=eDate,key=key)# 000001.sz# 查看列名colnames(dailyQuote)colnames(dailyQuote)
第五步ggplot2简单作图
DT::datatable(dailyQuote)
只见RStudio右下方的地方出现如下
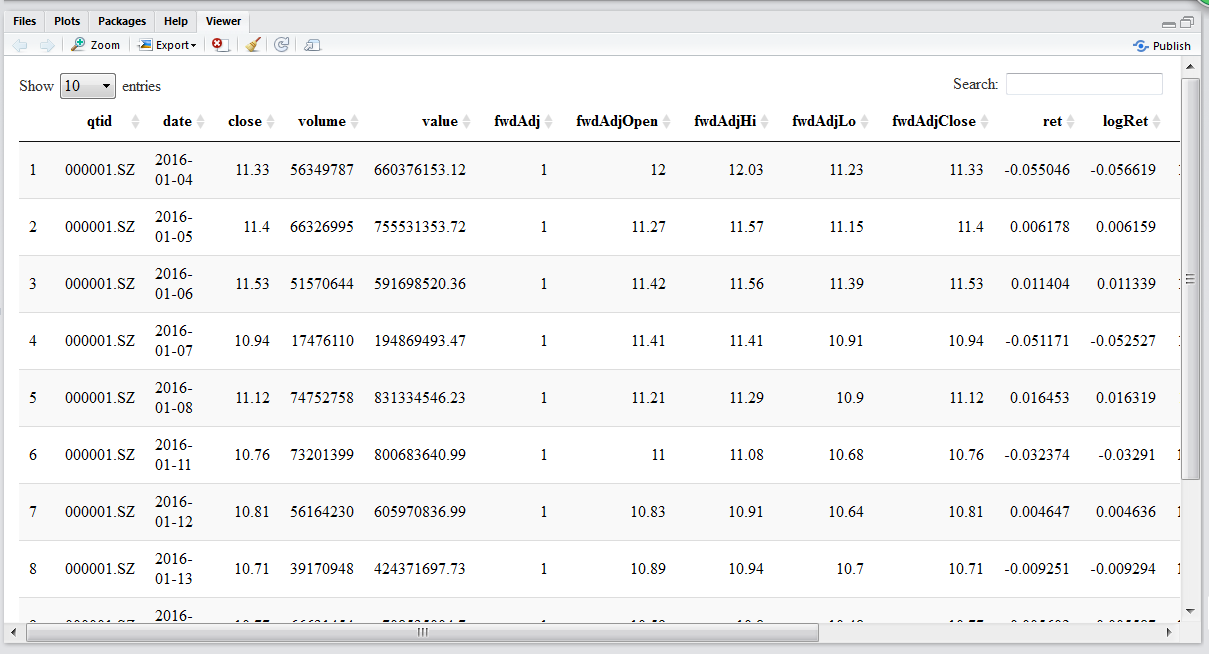
(恩,看来是可视化的数据展示啊,而且还有好多页哦,上面的10还有其他选项25/50,即每页显示多少行数据)
关于双冒号,什么鬼?
于是使用
- ??"::"
Description
Accessing exported and internal variables, i.e. R objects (including lazy loaded data sets) in a namespace.
即在名称空间中方法R的对象/变量/数据集的
Usage
pkg::name
pkg:::name
Arguments
pkg
package name: symbol or literal character string.(包名:字符串字面值?)
name
variable name: symbol or literal character string.(变量名)
Details
For a package pkg, pkg::name returns the value of the exported variable name in namespace pkg, whereas pkg:::name returns the value of the internal variable name. The package namespace will be loaded if it was not loaded before the call, but the package will not be attached to the search path.
Specifying a variable or package that does not exist is an error.
Note that pkg::name does not access the objects in the environment package:pkg (which does not exist until the package's namespace is attached): the latter may contain objects not exported from the namespace. It can access datasets made available by lazy-loading.
Note
It is typically a design mistake to use ::: in your code since the corresponding object has probably been kept internal for a good reason. Consider contacting the package maintainer if you feel the need to access the object for anything but mere inspection.
其实在我看来,怎么更像是在调用一个包中的函数或变量(哈哈静态变量么?)或数据集呢?
那么和正常的调用的区别在哪里呢?
请看我在知乎这篇问答中的评论
里面提到了这本书http://r-pkgs.had.co.nz/
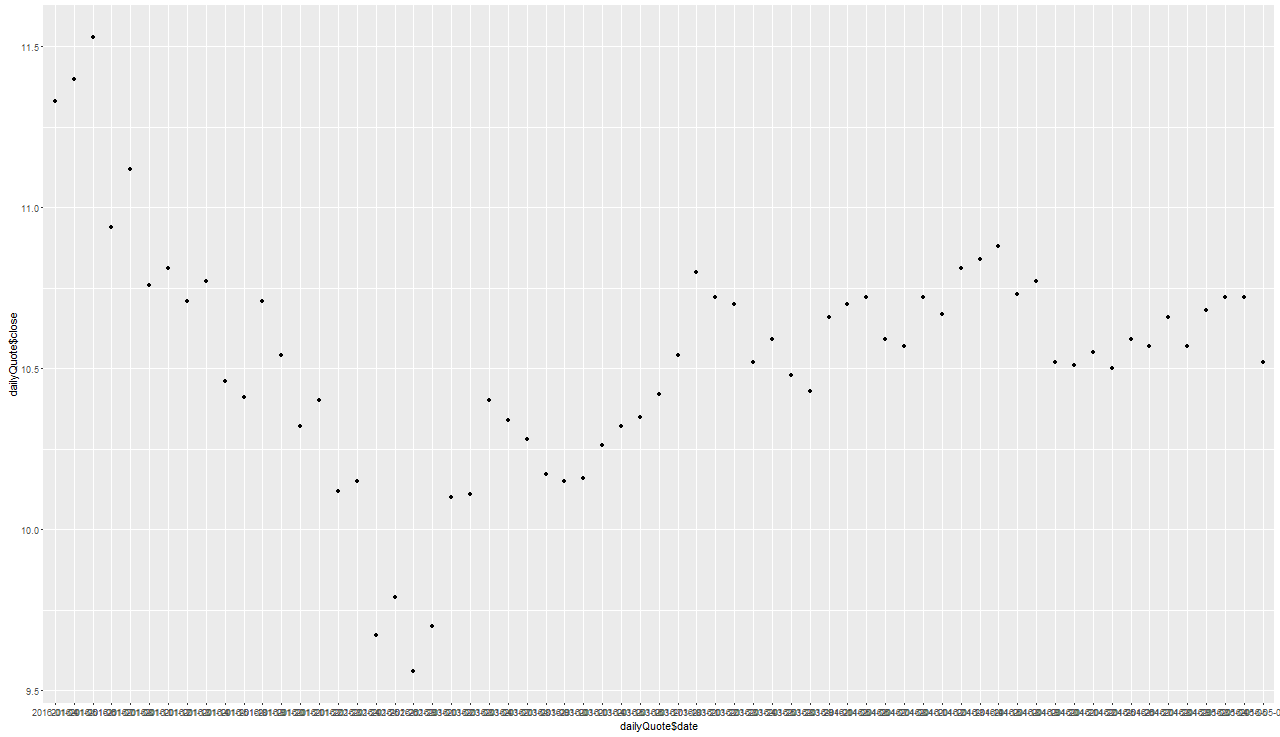
qplot(dailyQuote$date,dailyQuote$close)
第六步格式转换
dailyQuote$date<-as.POSIXct(as.character(dailyQuote$date),tz="",format="%Y-%m-%d")
POSIXct应是一种日期格式
Functions to manipulate objects of classes "POSIXlt" and "POSIXct" representing calendar dates and times.
tz=""表示the current time zone
format是character string giving a date-time format as used by strptime.
此时dailyQuote$date中的每个元素的形式从"2016-01-04"变为"2016-01-04 CST"
其中CST可视为美国,澳大利亚或中国的标准时间(中国标准时间:China Standard Time UT+8:00)。
temp = read.zoo(dailyQuote[,-1][,1:2])
dailyQuote的第一列是qtid(证券代码)
去除第一列后取此时的第一列和第二列,即为date和close
恩,不如优化为temp = read.zoo(dailyQuote[,2:3])

神奇吧?read.zoo的第一个参数是file,除了可以是文件名外,file can be a connection or a data.frame (e.g., resulting from a previous read.table call) that is subsequently processed to a "zoo" series.
自己写个例子测试下就知道了:
> testD<-data.frame(x=1:5,y=2:6)> read.zoo(testD)1 2 3 4 52 3 4 5 6
转化为xts格式
> payh =as.xts(temp[,1])> head(payh)[,1]2016-01-04 11.332016-01-05 11.402016-01-06 11.532016-01-07 10.942016-01-08 11.122016-01-11 10.76> colnames(payh)="Close"> head(payh)Close2016-01-04 11.332016-01-05 11.402016-01-06 11.532016-01-07 10.942016-01-08 11.122016-01-11 10.76
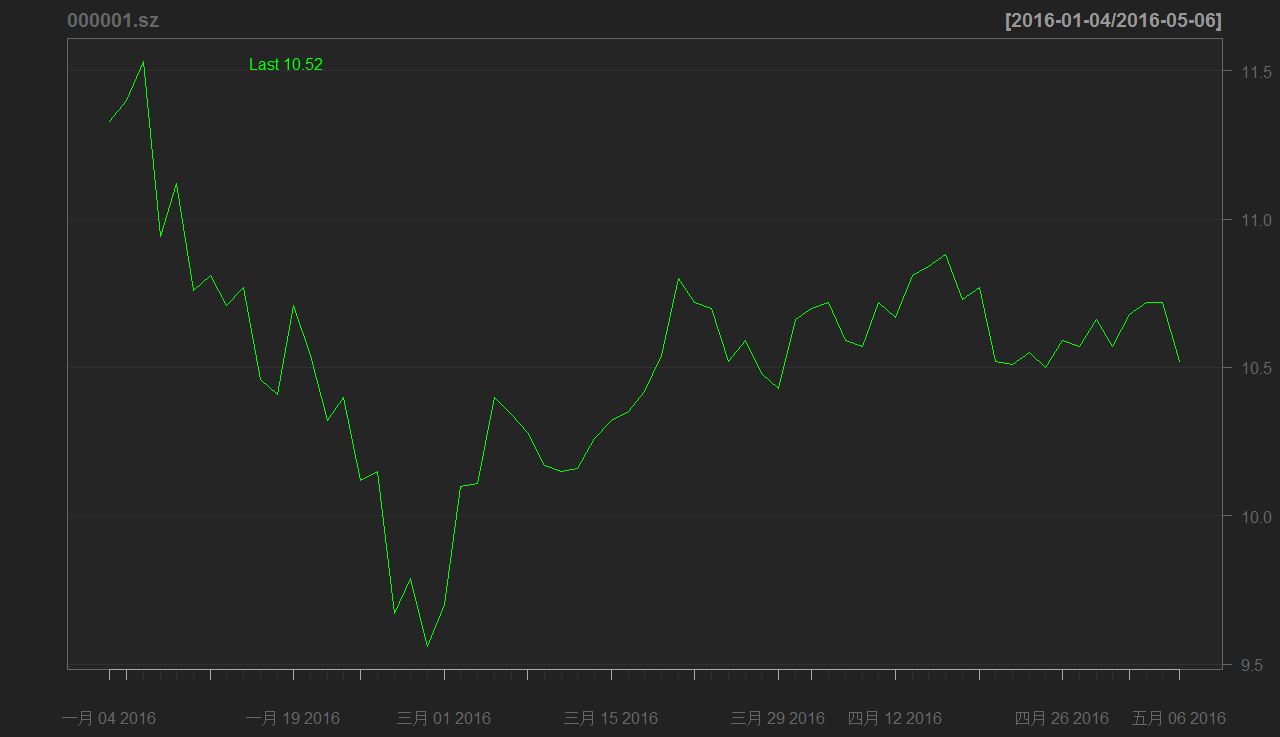
第七步quantmod制图
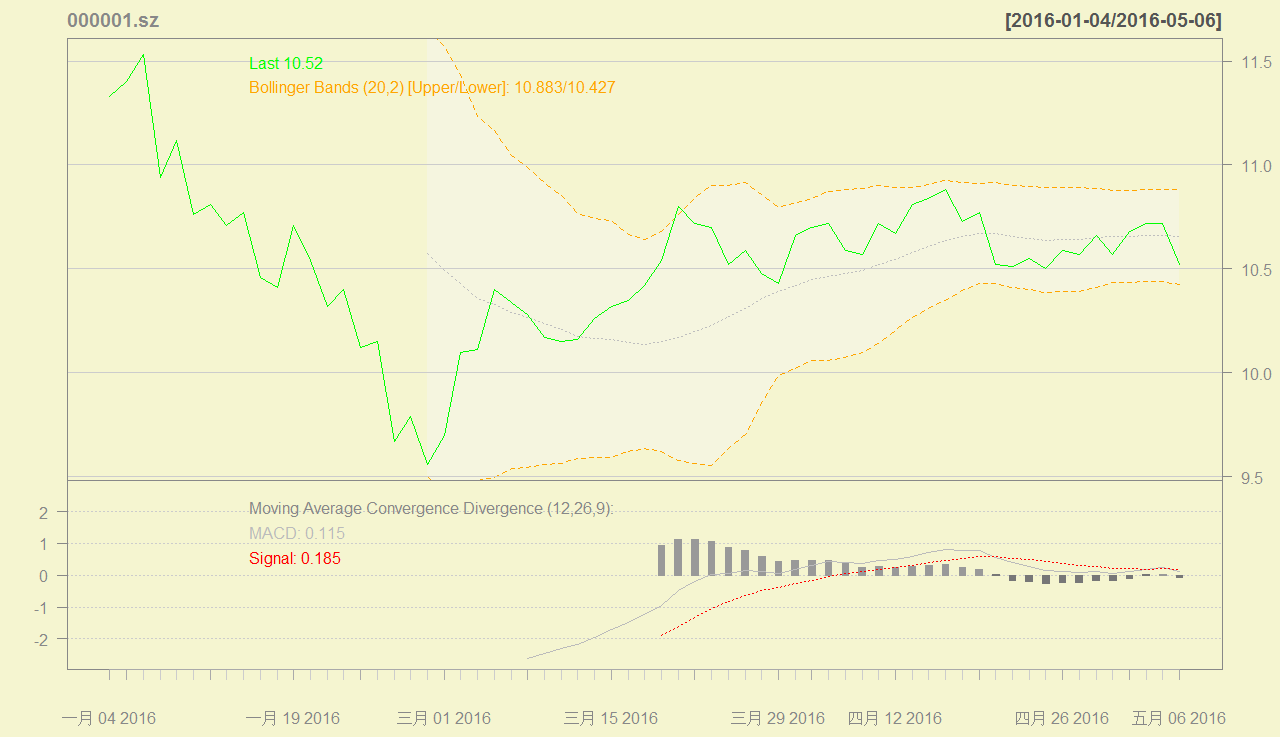
chartSeries(payh,name="000001.SZ HarryZhu CopyRight") #走势图
addMACD() #MACD曲线,不用自己计算
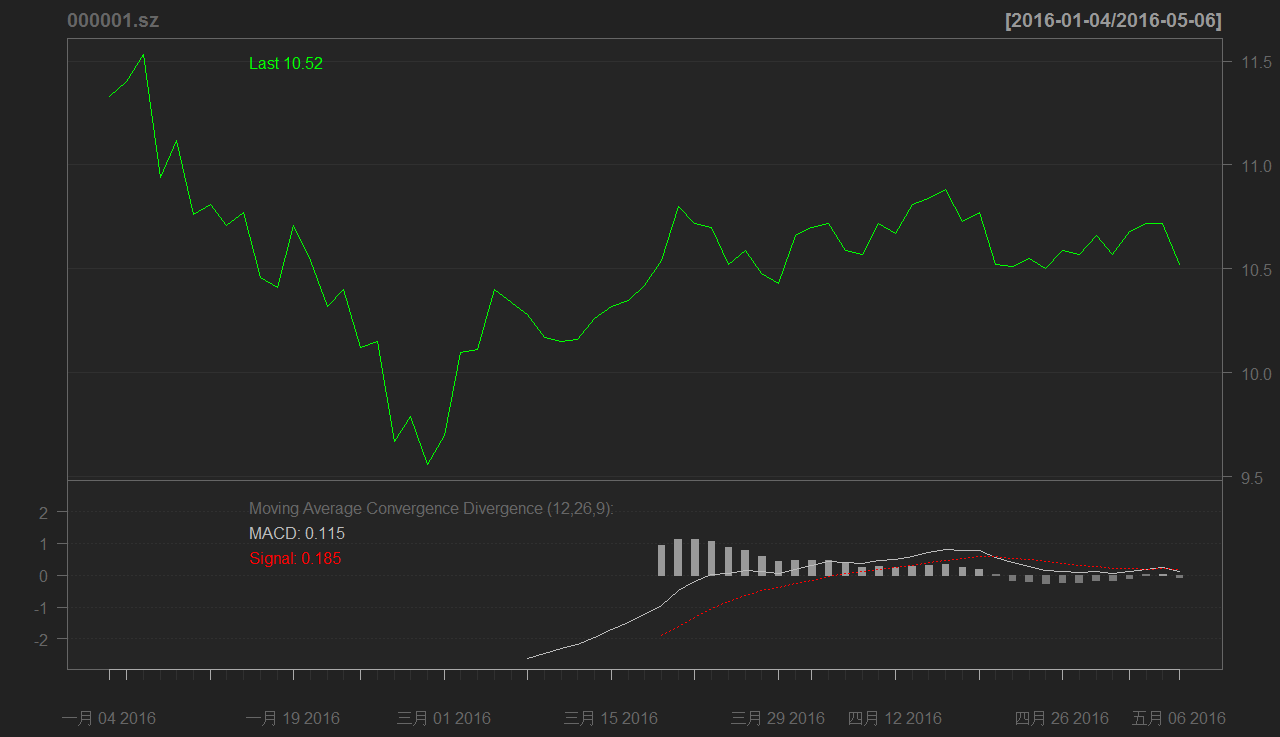
addBBands() #布林带

quantmod包的主题
换种风格咯?
chartSeries(payh,name=qtid,theme="white")addMACD() #MACD曲线,不用自己计算addBBands() #布林带
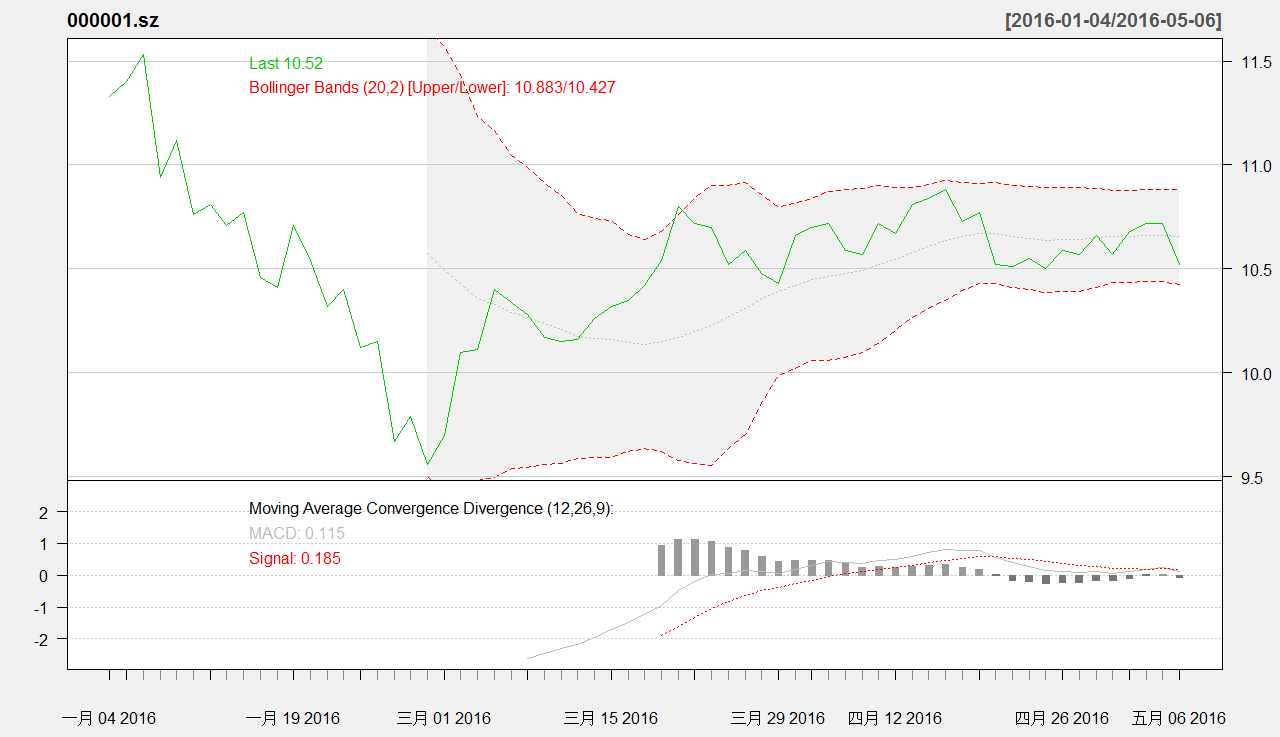
theme="white.mono"
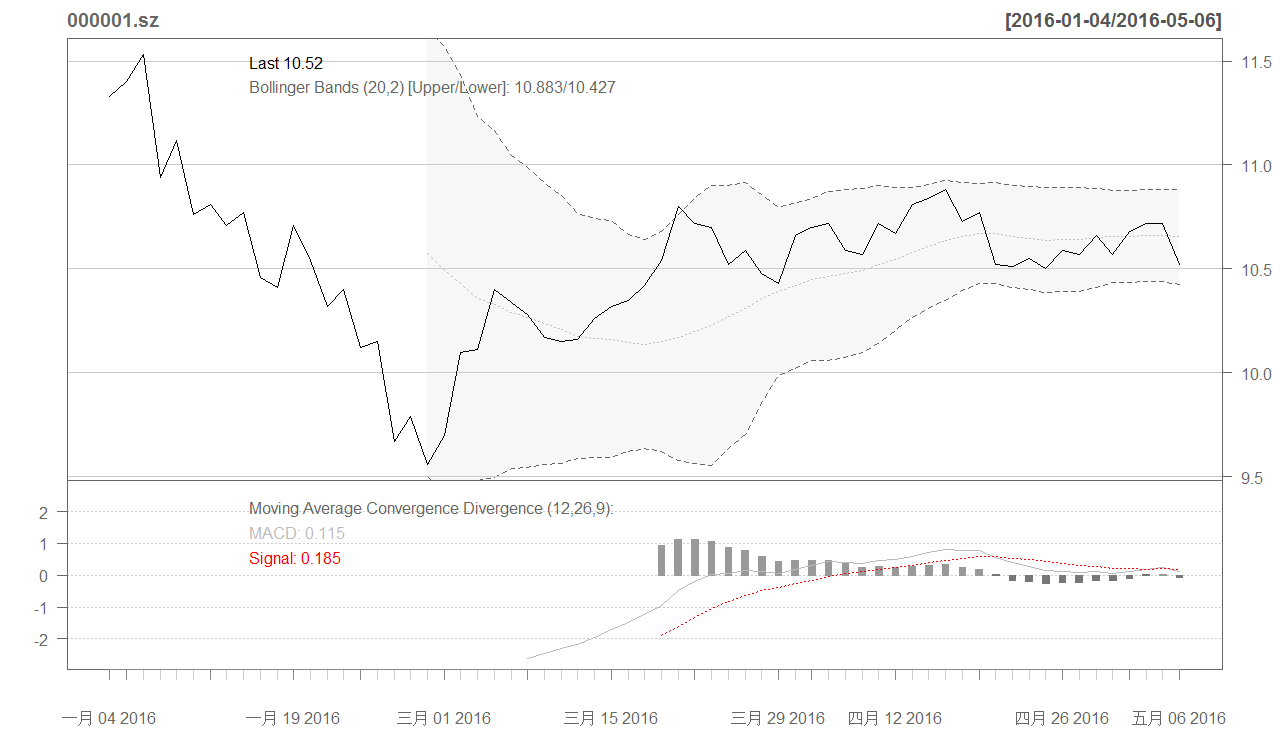
theme="black.mono"
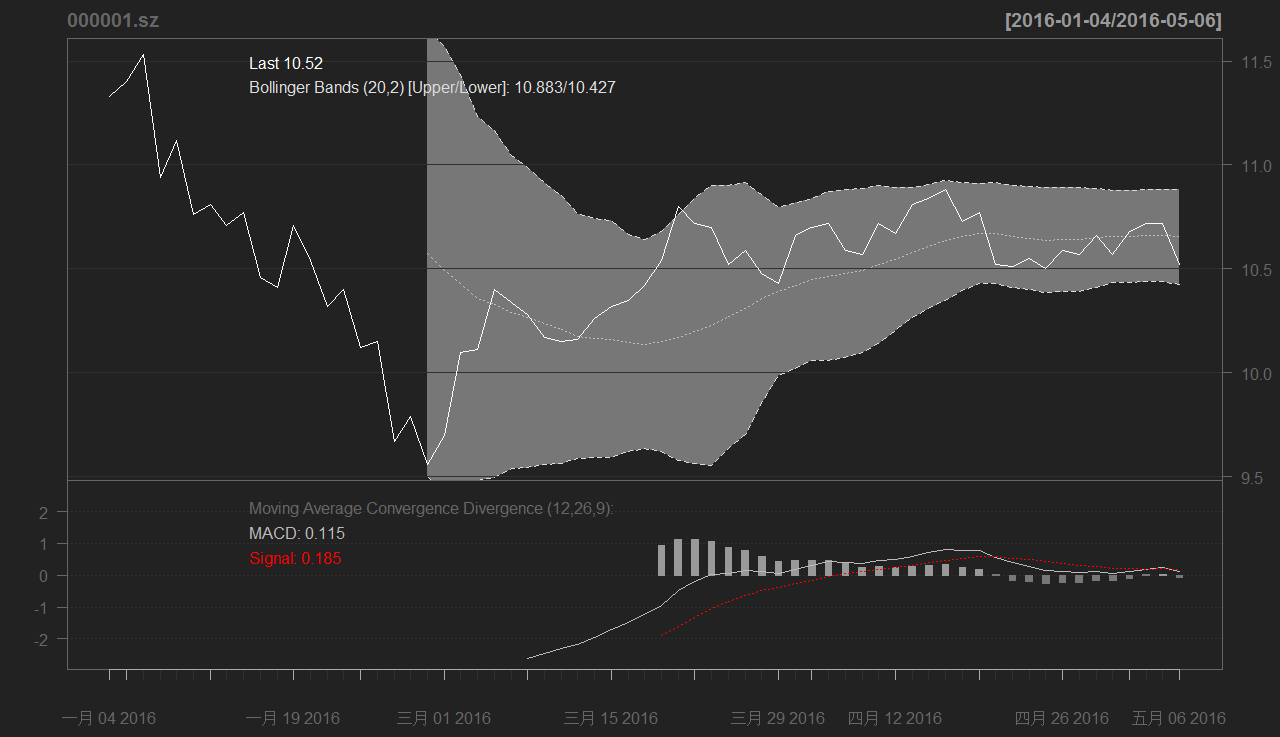
theme="beige"
theme="wsj"

恩 quantmod到底有多少个主题呢?
请看以下链接:
On Thu, Apr 28, 2011 at 2:22 AM, Costas Vorlow <costas.vorlow at gmail.com> wrote:
I am having trouble with selecting themes in quantmod
How many themes (predefined) exist?
Use the source! ;-)
> chartThemefunction (theme = "black", ...){ctheme <- get(".chart.theme", as.environment("package:quantmod"))attr(ctheme, ".Environment") <- NULLcurrent.theme <- ctheme[[theme]]ll <- list(...)for (i in names(ll)) {current.theme[[i]] <- ll[[i]]}return(structure(current.theme, class = "chart.theme"))}<environment: namespace:quantmod>> names(quantmod:::.chart.theme)[1] "white" "white.mono" "black" "black.mono" "beige"[6] "wsj"
三冒号我倒是见识了,三冒号后面还加个点,恩,好吧.
当然,我们可以自动以theme的,使用chartTheme函数即可,不过既然不是专业的设计人员,我们觉得配图配色上,自己搞起来肯定四不像,就没动手。
附上源码