circos可以用来绘制圈图,能够对染色体上的数据进行可视化,首先需要一个染色体的文件
染色体的文件如下,每列之间空格分隔
chr - chr1 1 0 227556264 chr1
chr - chr2 2 0 192460366 chr2
chr - chr3 3 0 192294377 chr3
chr - chr4 4 0 170955103 chr4
chr - chr5 5 0 189454096 chr5
chr - chr6 6 0 181584905 chr6
chr - chr7 7 0 171882078 chr7
chr - chr8 8 0 146850525 chr8
chr - chr9 9 0 133195287 chr9
第一列 : 表名这行数据是染色体的数据
第二列: -
第三列: 染色体的名称,会显示在图上
第四列: 染色体编号
第五列:染色体的起始位置
第六列: 染色体的终止位置
第七列:染色体的颜色
在circos中有一些默认的颜色设置,用rgb设置一些默认的颜色名, 可以在circos的安装目录的etc/colors.conf 文件中查看,比如chr1 的颜色设置保存在colors.ucsc.conf 中,内容如下
chr1  = 153,102,0
chr2  = 102,102,0
chr3  = 153,153,30
chr4  = 204,0,0
chr5  = 255,0,0
chr6  = 255,0,204
chr7  = 255,204,204
chr8  = 255,153,0
chr9  = 255,204,0
chr10 = 255,255,0
chr11 = 204,255,0
chr12 = 0,255,0
chr13 = 53,128,0
chr14 = 0,0,204
chr15 = 102,153,255
chr16 = 153,204,255
chr17 = 0,255,255
chr18 = 204,255,255
chr19 = 153,0,204
chr20 = 204,51,255
chr21 = 204,153,255
chr22 = 102,102,102
chr23 = 153,153,153
chrX  = 153,153,153
chr24 = 204,204,204
chrY  = 204,204,204
chrM  = 204,204,153
chr0  = 204,204,153
chrUn = 121,204,61
chrNA = 255,255,255
我们也可以自定义一些颜色的名称,将其添加到colors.conf 文件中保存即可,比如自定义颜色
sample1 = 255,99,71
然后就可以使用sample1 作为颜色名了,在circos中还有很多颜色的名字,都是有规律的,比如
vvlred : very very light red
vlred : very light red
lred : light red
red : red
dred : dark red
vdred : very dark red
vvdred : very very dark red
常用的颜色red, green, blue, yellow 都支持上面的颜色定义, 除此之外,还有其他很多的内置颜色, 详细信息可以查看circos安装目录下的/etc/colors.conf 文件查看, 里面的注释部分详细说明了颜色的定义方式。
接下来定义想要展示的数据,这里展示基因在染色体上的区间信息,通过 tile 的方式进行展示
chr1 8825 17551
chr1 31200 36882
chr1 44089 61948
chr1 91317 91388
chr1 91669 91774
chr1 105969 115431
chr1 115880 126341
chr1 137263 152263
chr1 185470 192339
chr1 200946 216412
chr1 246699 257364
chr1 302816 308640
chr1 326354 327127
chr1 346836 363346
chr1 351339 352292
chr1 373325 374824
chr1 469751 470980
第一列: 染色体名称
第二列:基因的起始位置
第三列:基因的终止位置
在下来准备突变位点的信息,用scatter 的方式进行展示
chr1 13400340 13400340 glyph_size=20,fill_color=red
第一列: 染色体名称
第二列: 突变的起始位置
第三列: 突变的终止位置
前三列的数据是必须的,第四列用来设置每个店的大小和颜色
最后是cir<<include colors_fonts_patt<ideogram>
<spacing>
default = 10u
break   = 2u
</spacing>

radius           = 0.9r
thickness        = 40p
fill             = yes
fill_color       = black
stroke_thickness = 2
stroke_color     = black
show_label       = yes
label_font       = default
label_radius     = dims(ideogram,radius) + 0.05r
label_with_tag   = yes
label_size       = 50
label_parallel   = yes
label_case       = lower
label_format     = eval(sprintf("%s",var(label)))
</ideogram>


<image>
<<include etc/image.conf>>
</image>

karyotype   = monkey_karyotype.txt
chromosomes_units = 1000000<plots>
<plot>
type            = tilefile        = genes.txt
r1          = 1.0r
r0          = 0.88r
orientation = out
layers      = 4
margin      = 0.02u
thickness   = 30
padding     = 5
layers_overflow       = hide
stroke_thickness = 1
stroke_color     = blue
color            = blue
</plot>

<plot>
type             = scatter
file             = scatter.txt
stroke_thickness = 0
glyph            = circle
max   = 47000
min   = 100
r1    = 0.8r
r0    = 0.3r<rules>
<rule>
condition = var(value) < 1000
glyph_size = 20
</rule>
<rule>
condition  = var(value) > 1000 && var(value) < 10000
glyph_size = 30
</rule>
<rule>
condition = var(value) > 10000
gplyph_size = 50
</rule>
</rules>
<backgrounds>
<background>
color     = vvlgrey
y0        = 100
</background>
</backgrounds>
</plot>
</plots>

<<include etc/housekeeping.conf>>
直接在circos.conf的目录运行circos,就会生成circos.png 和circos.svg;
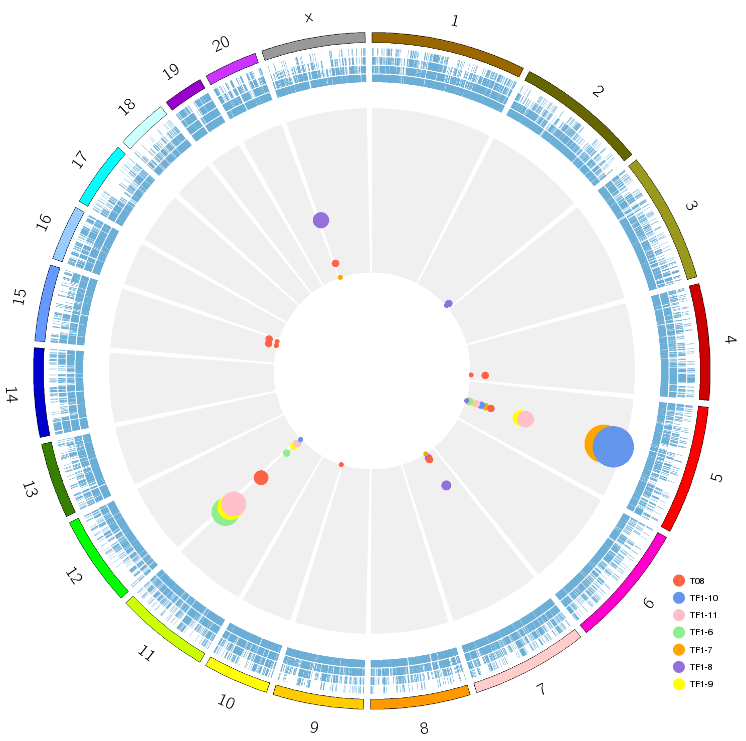
因为circos中没有添加图例的方法,只能手工添加,利用R绘制图列,再用windows自带的画图工具对图片进行剪裁,
最终效果如下: