1.MPAndroid 的github的地址:
https://github.com/PhilJay/MPAndroidChart#documentation
2.使用步骤:
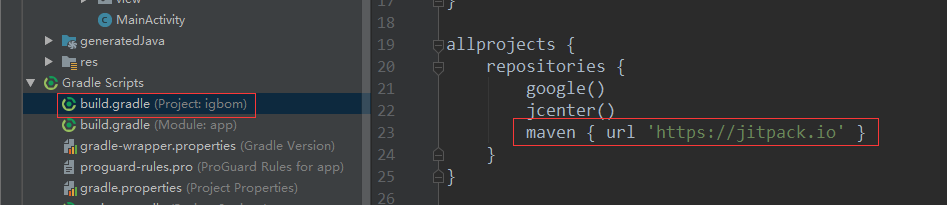
- 在build.gradle中引入
allprojects {
    repositories {
        google()
        jcenter()
        maven { url 'https://jitpack.io' }
    }
}
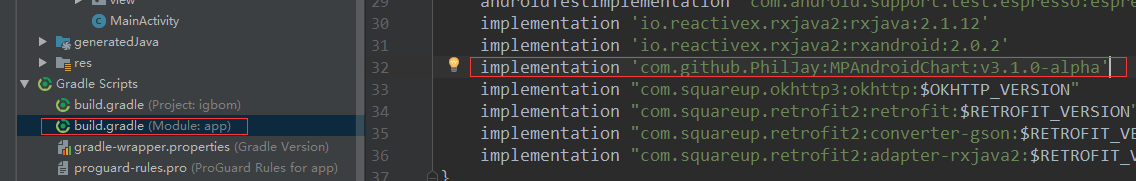
- 在build.gradle(app)上引入模块依赖
dependencies {
implementation 'com.github.PhilJay:MPAndroidChart:v3.1.0'
}
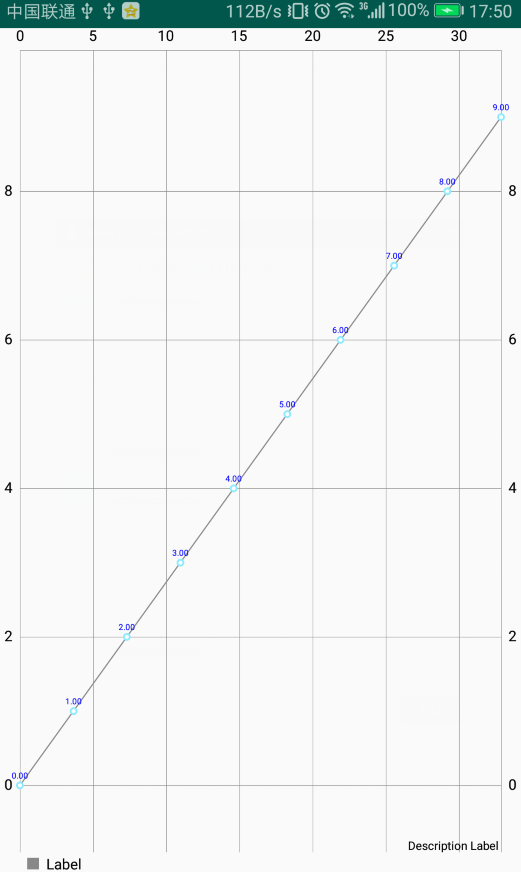
- 实现条形图线图
- 布局,在布局里面引入LineChart
   <com.github.mikephil.charting.charts.LineChart
        android:id="@+id/linechart"
        android:layout_width="match_parent"
        android:layout_height="match_parent"
        />
-
- 在activity中的实现
public class LineActivity extends AppCompatActivity {
    private LineChart mLineChart;
    @Override
    protected void onCreate(Bundle savedInstanceState) {
        super.onCreate(savedInstanceState);
        setContentView(R.layout.activity_line);
        mLineChart = findViewById(R.id.linechart);
        initSetChartAction();
        initLineChartStyle();
    }
  //设置
    private void initSetChartAction() {
        mLineChart.setTouchEnabled(false);//设置是否可以触碰
        mLineChart.setDragEnabled(false);//设置不可拖拽
        mLineChart.setScaleEnabled(false);
        //mLineChart.setScaleXEnabled(false);
       // mLineChart.setScaleYEnabled(false);
        mLineChart.setPinchZoom(false); ////设置是否能扩大扩小

    }
  //数据
    private void initLineChartStyle() {
        List<ChartData> chartData = new ArrayList<ChartData>();
        List<Entry> entries = new ArrayList<Entry>();
        for (Integer i = 0; i < 10; i++) {
            float valueY = i;
            float valueX = i *5* new Random(10).nextFloat();
            entries.add(new Entry(valueX, valueY));

        }
     //线的数据集
        LineDataSet dataSet = new LineDataSet(entries, "Label"); // add entries to dataset
        dataSet.setColor(Color.GRAY);
        dataSet.setValueTextColor(Color.BLUE);
        LineData lineData = new LineData(dataSet);
        mLineChart.setData(lineData);
        mLineChart.invalidate();//更新图表
    }
}
数据的格式
public class ChartData {
    private int ValueX;
    private float ValueY;
    public ChartData(int ValueX,float ValueY){
        this.ValueX=ValueX;
        this.ValueY = ValueY;
    }
    public int getValueX() {
        return ValueX;
    }

    public void setValueX(int valueX) {
        ValueX = valueX;
    }

    public float getValueY() {
        return ValueY;
    }

    public void setValueY(float valueY) {
        ValueY = valueY;
    }
}
-
- 更多的配置
 /**
     * 初始化图表
     */
    private void initChart(LineChart lineChart) {

        /***图表设置***/
        //是否展示网格线
        lineChart.setDrawGridBackground(false);

        //是否显示边界
        lineChart.setDrawBorders(true);
        //是否可以拖动
        lineChart.setDragEnabled(false);
        //是否有触摸事件
        lineChart.setTouchEnabled(true);
        lineChart.setGridBackgroundColor(R.color.lightgray);//设置网格背景应与绘制的颜色
        //设置XY轴动画效果
        lineChart.animateY(2500);
        lineChart.animateX(1500);


        /***XY轴的设置***/
        YAxis leftYAxis = mLineChart.getAxisLeft();
       // YAxis rightYaxis = mLineChart.getAxisRight();
        XAxis  xAxis = mLineChart.getXAxis();
        xAxis.setDrawGridLines(false);
       // rightYaxis.setDrawGridLines(false);
        leftYAxis.setDrawGridLines(true);
        //X轴设置显示位置在底部
        xAxis.setPosition(XAxis.XAxisPosition.BOTTOM);
        xAxis.setAxisMinimum(0f);
        xAxis.setGranularity(1f);
        xAxis.setTextColor(Color.WHITE);
        //保证Y轴从0开始,不然会上移一点
        leftYAxis.setAxisMinimum(0f);
        //rightYaxis.setAxisMinimum(0f);
        leftYAxis.setTextColor(Color.WHITE);
        //rightYaxis.setDrawGridLines(false);

        /***折线图例 标签 设置***/
        Legend legend = lineChart.getLegend();
        //设置显示类型,LINE CIRCLE SQUARE EMPTY 等等 多种方式,查看LegendForm 即可
        legend.setForm(Legend.LegendForm.CIRCLE);
        legend.setTextColor(Color.WHITE);
        legend.setTextSize(12f);
        //显示位置 左下方
        legend.setVerticalAlignment(Legend.LegendVerticalAlignment.BOTTOM);
        legend.setHorizontalAlignment(Legend.LegendHorizontalAlignment.LEFT);
        legend.setOrientation(Legend.LegendOrientation.HORIZONTAL);
        //是否绘制在图表里面
        legend.setDrawInside(false);

    }
//在创建好了LineDataSet之后进行数据的设置,文字,边框等样式
// 每一个LineDataSet代表一条线
 public void initLineDataSet(LineDataSet lineDataSet, int color, LineDataSet.Mode mode) {
        lineDataSet.setColor(color);
        lineDataSet.setCircleColor(color);
        lineDataSet.setLineWidth(1f);
        lineDataSet.setCircleRadius(3f);
        lineDataSet.setDrawValues(false); // 是否在点上绘制Value
        //设置曲线值的圆点是实心还是空心
        lineDataSet.setDrawCircleHole(false);
        lineDataSet.setValueTextSize(10f);
        //设置折线图填充
        lineDataSet.setDrawFilled(true);
        lineDataSet.setFormLineWidth(1f);
        lineDataSet.setFormSize(15.f);
        if (mode == null) {
            //设置曲线展示为圆滑曲线(如果不设置则默认折线)
            lineDataSet.setMode(LineDataSet.Mode.CUBIC_BEZIER);
        } else {
            lineDataSet.setMode(mode);
        }
    }
//添加一个line
 /**
     * 添加曲线
     */
    public void addLine(List<EnergyData> dataList, String name, int color) {
        List<Entry> entries = new ArrayList<>();
        for (int i = 0; i < dataList.size(); i++) {
            Entry entry = new Entry(i,  Float.parseFloat(dataList.get(i).getValue()));
            entries.add(entry);
        }
        // 每一个LineDataSet代表一条线
        LineDataSet lineDataSet = new LineDataSet(entries, name);
        initLineDataSet(lineDataSet, color, LineDataSet.Mode.CUBIC_BEZIER);
        mLineChart.getLineData().addDataSet(lineDataSet); // 添加曲线
        mLineChart.invalidate();
    }
- 柱状图
- 布局
 <com.github.mikephil.charting.charts.BarChart
        android:id="@+id/barchart"
        android:layout_width="match_parent"
        android:layout_height="match_parent"/>
-
- activity的实例
public class BarActivity extends AppCompatActivity {
    private BarChart mBarChart;
    @Override
    protected void onCreate(Bundle savedInstanceState) {
        super.onCreate(savedInstanceState);
        setContentView(R.layout.activity_bar);
        mBarChart = findViewById(R.id.barchart);
        List<ChartData> chartData = new ArrayList<ChartData>();
        List<BarEntry> entries = new ArrayList<BarEntry>();
        for (Integer i = 0; i < 10; i++) {
            float valueY = i;
            float valueX = i *5* new Random(10).nextFloat();
            entries.add(new BarEntry(valueX, valueY));

        }
        BarDataSet dataSet = new BarDataSet(entries, "Label"); // add entries to dataset
        dataSet.setColor(Color.GRAY);
        dataSet.setValueTextColor(Color.BLUE);
        BarData barData = new BarData(dataSet);
        mBarChart.setData(barData);
        mBarChart.invalidate();

    }
}

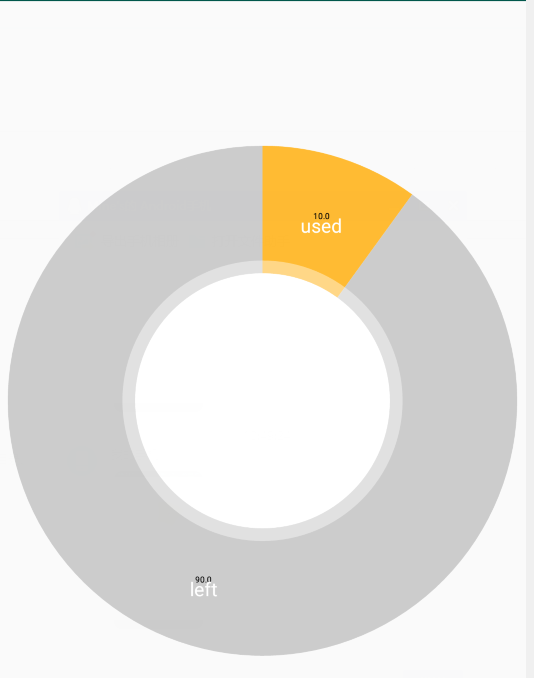
- 饼图
- 布局
  <com.github.mikephil.charting.charts.PieChart
        android:id="@+id/piechart"
        android:layout_width="match_parent"
        android:layout_height="match_parent"/>
-
- activity的写法
public class PieActivity extends AppCompatActivity {

    private PieChart mPieChart;
    @Override
    protected void onCreate(Bundle savedInstanceState) {
        super.onCreate(savedInstanceState);
        setContentView(R.layout.activity_pie);
        mPieChart = findViewById(R.id.piechart);

        //大小
        ArrayList<PieEntry> sizes=new ArrayList<PieEntry>();
        sizes.add(new PieEntry(10,"used"));
        sizes.add(new PieEntry(90,"left"));
        //颜色
        ArrayList<Integer> colors=new ArrayList<Integer>();
        colors.add(Color.parseColor("#FFBB33"));
        colors.add(Color.parseColor("#CCCCCC"));

        PieDataSet pieDataSet=new PieDataSet(sizes,"");//参数:颜色栏显示颜色目录、
        pieDataSet.setColors(colors);

        PieData pieData=new PieData(pieDataSet);
        mPieChart.setData(pieData);
        mPieChart.invalidate();
    }
}
-
- 效果图
其他的设置功能:
/**
     * 初始化图表
     */
    private void initPieChart(PieChart pieChart){
        pieChart.setHoleRadius(60f);//半径
        pieChart.setTransparentCircleRadius(40f);// 半透明圈
        pieChart.setDrawCenterText(true);//饼状图中间可以添加文字
        pieChart.setDrawHoleEnabled(true);
        pieChart.setRotationAngle(90);// 初始旋转角度
        pieChart.setRotationEnabled(true);// 可以手动旋转
        pieChart.setUsePercentValues(true);//显示成百分比
        Legend legend_pie = pieChart.getLegend();
        legend_pie.setVerticalAlignment(Legend.LegendVerticalAlignment.TOP);
        legend_pie.setHorizontalAlignment(Legend.LegendHorizontalAlignment.RIGHT);
        legend_pie.setOrientation(Legend.LegendOrientation.VERTICAL);
        legend_pie.setTextColor(Color.WHITE);
        legend_pie.setDrawInside(false);
        legend_pie.setXEntrySpace(7f);
        legend_pie.setYEntrySpace(0f);
        legend_pie.setYOffset(0f);
        pieChart.animateXY(1000, 1000);//设置动画
    }
//数据的设置
 /**
     * 设置饼状图
     *
     * @param name   饼状图分类的名字
     * @param data   数值
     * @param colors 颜色集合
     */
    public void setPieChart(List<String> name, List<Float> data, List<Integer> colors) {
        List<PieEntry> yValue = new ArrayList<>();
        for (int i = 0; i < data.size(); i++) {
            PieEntry entry = new PieEntry(data.get(i), name.get(i));
            yValue.add(entry);
        }
        PieDataSet set = new PieDataSet(yValue, "");
        set.setDrawValues(true);
        set.setValueTextSize(12);
        set.setColors(colors);
        set.setValueTextColor(Color.WHITE);

        PieData datapie= new PieData(set);
        mPieChart.setData(datapie);
        mPieChart.invalidate(); // refresh
    }
