zoukankan      html  css  js  c++  java
  • echart

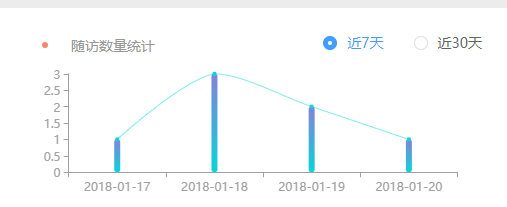
     _echarts1() {
          this.echarts1 = echart.init(document.getElementById('homeEchart1'))
          this.echarts1.setOption({
            backgroundColor: '#fff',
            tooltip: {
              trigger: 'item',
              axisPointer: {
                type: 'shadow',
                label: {
                  show: true,
                  backgroundColor: '#333'
                }
              }
            },
            grid: {
              top: '10%',
              left: '1%',
              right: '10%',
              bottom: '10%',
              containLabel: true
            },
            xAxis: {
              data: this.switchX,
              axisLine: {
                lineStyle: {
                  color: '#a1a1a1'
                }
              },
              // axisLabel: {
              //   interval: 0,
              //   rotate: 10
              // },
            },
            yAxis: {
              splitLine: {show: false},
              axisLine: {
                lineStyle: {
                  color: '#a1a1a1'
                }
              }
            },
            series: [
              {
                name: '随访人数',
                type: 'line',
                smooth: true,
                showAllSymbol: true,
                symbol: 'circle',
                symbolSize: 4,
               // color: '#0f0',
                itemStyle:{
                    normal:{
                        color: "#07d5d8" //图标颜色
                    }
                },
                data: this.switchY,
                lineStyle: {
                  normal: {
                     1,
                    color: 'rgba(8,213,216,.5)'
                  }
                  
                },
              }, 
              {
                name: '随访人数',
                type: 'bar',
                barWidth: 6,
                itemStyle: {
                  normal: {
                    barBorderRadius: 5,
                    color: new echart.graphic.LinearGradient(
                      0, 0, 0.5, 1,
                      [
                        {offset: 0, color: '#8283da'},
                        {offset: 0.5, color: '#47aad9'},
                        {offset: 1, color: '#07d5d8'}
                      ]
                    )
                  }
                },
                data: this.switchY
              }
              
            ]
    
    
         })
            
        },
  • 相关阅读:
    类和对象的一些BIF
    mac入门--通过hhomebrew下载过慢问题
    Vue的组件及传参
    Vue的指令和成员
    Vue基础(1)
    Python中好用的模块们
    Django-Auth认证模块
    Django杂篇(2)
    Django杂篇(1)
    Django的日常-AJAX
  • 原文地址:https://www.cnblogs.com/xuyan1/p/8320954.html
Copyright © 2011-2022 走看看