若对caltech数据集进行测评的话,需要使用code3.2.1中的dbeva.m 代码进行测评,之前不知道,很长时间里,都是自己画log average miss rate曲线,导致得到的分数就很高,结果很差,还不能解释...知道在github上看到了这位大牛的解释:
https://github.com/zhaoweicai/mscnn/issues/63
I finally managed to work this out... the devkit is so user-unfriendly
steps (the working dir of all the following steps is the folder of the devkit):
- I used the python script to generate detection results in #4 . The provided run_mscnn_detection.m was unreasonably slow for me
- create a folder "data-USA", and put the "annotations" folder of caltech in it (copy/soft-link/whatever)
- create a folder "data-USA/res, and place the unzipped results from other algorithms here (http://www.vision.caltech.edu/Image_Datasets/CaltechPedestrians/datasets/USA/res/)
- put your own results under res following the format of the official results from other algorithms
- run dbEval, and a folder named "results" will be created to store the generated graphs
FYI: the devkit evaluates 1 based 30,60,90... frames, so in python they are 29, 59, 89... and it is already well handled
行人检测FPPI miss rate
FPPI/FPPW
Miss Rate:丢失率=测试集正例判别为负例的数目/测试集检索到想要的正例数加上未检测到不想要的 即是 全部groud truth的数量
Pedestrian detection: A benchmark
两者都侧重考察FP(False Positive)出现的频率。
这周的大量时间都用在了去研究log Average Miss Rate - FPPI曲线了,昨天出来了结果。现在总结一下自己查到过的有用的知识点,使以后再用的时候不至于很费劲。
(一)绘制log Average Miss Rate - FPPI曲线所使用的函数及其参数
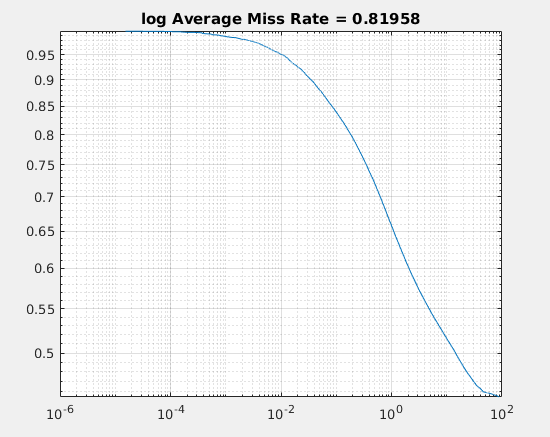
图(0) log Average Miss Rate - FPPI曲线
关于log Average Miss Rate - FPPI 曲线,是用来衡量行人检测的检测器效果的衡量指标,曲线越低,效果越好。
画log Average Miss Rate - FPPI曲线,matlab2017版本提供了专门的函数,函数的详细用法,在matlab的官方文档中已经给出。
%detectionResults 是你检测器生成的关于每幅图像的 boundinb boxes 和对应与每个bbox 得到的分数 见图(1)
%trainingData 是你数据关于每幅图像标定的 ground truth 见图(2)

[am,fppi,missRate] = evaluateDetectionMissRate(detectionResults,trainingData)
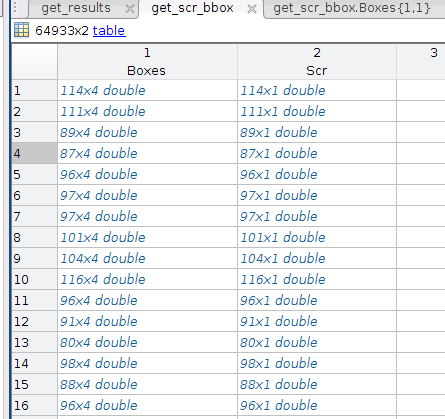
图(1-1) detectionResults的具体结果展示
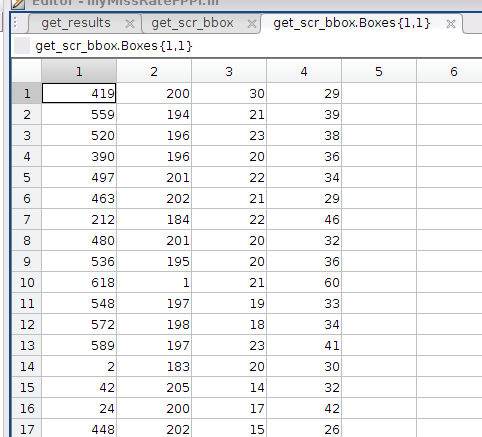
图(1-2) Boxes 中可以是一个double 类型的矩阵

图(1-3) Scr中是与Boxes一一对应的分数,Scr也是double类型的
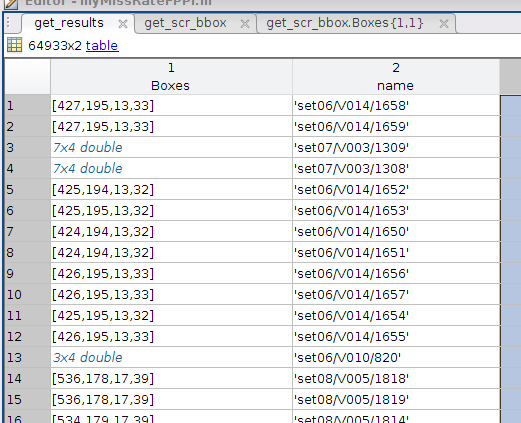
图(2) trainingData的具体结果展示(这里的3*4 double 类型同上边的图中一样)
有了这些数据后,传给函数 evaluateDetectionMissRate() 就能得到最终的结果,然后用miss rate 和FPPI绘制最终的曲线
figure
loglog(fppi, missRate);
grid on
title(sprintf('log Average Miss Rate = %.5f',am))
我的整体代码是


[am,fppi,missRate] = evaluateDetectionMissRate(get_scr_bbox,get_results(:,1),0.5);

%%
% Plot log average miss rate - FPPI.
figure
loglog(fppi, missRate);
grid on
title(sprintf('log Average Miss Rate = %.5f',am))
(二)将的到的检测结果文件和ground truth整理成matlab容易读取的格式
从检测器得到的结果中,取得具体对应每张图片的分数和它的bboxes。因为检测得到的结果比较大,有200M+,所以,对于这么大的文本,处理方法还是很关键的
因为每张图片 与(分数score和bbox)是一对多的关系,也就是说,一张图片会有多个(分数score和bbox),所以存储的时候就要考虑好。
这里我用的python 中的字典(dict)对图片和(分数score和bbox)进行存储,key是图片名,value是一个存放多个(分数score和bbox)的 list。这样在具体查找当前的图片名是否已经保存在字典中,因为字典的性质,就可以相当快了。
(i)检测器的到的数据的格式
图(3) 检测器的到结果的具体展示
(ii)用matlab 处理前,要整理成的格式
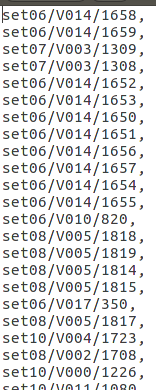
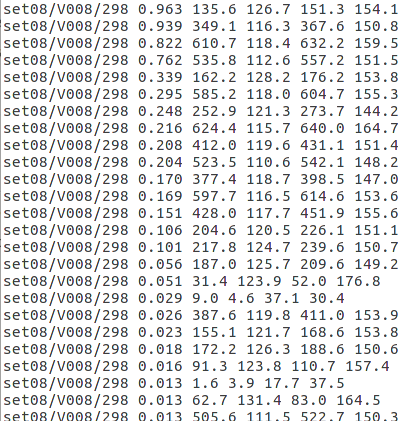
图(4-1)生成的out.txt文件,用来保存图片的名字,之后用ground truth 来与这个文件里的名字对应起来
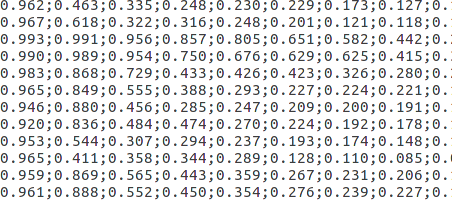
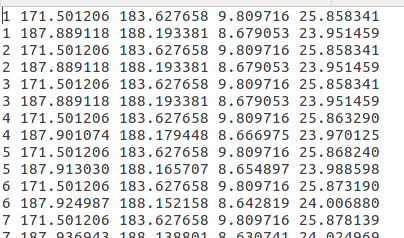
图(4-2)生成的out1.txt文件,用来保存每张图片对应的bboxes 的具体分数,会有很多维
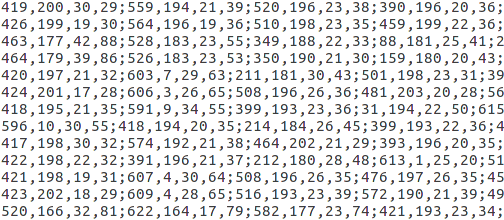
图(4-3)生成的out2.txt文件,用来保存每张图片对应的bboxes,这里的坐标的含义是:前两个是bbox 的的左上坐标点,然后后两个是它的宽和高。
(iii)具体代码:
def generate_result(resource_path, des_path):
    """
    :param path:
    :return:
    """
    des_path1 = "/home/user/PycharmProjects/MissRate_FPPI_plot/out1.txt"
    des_path2 = "/home/user/PycharmProjects/MissRate_FPPI_plot/out2.txt"

    rf = open(resource_path)

    content = rf.readline()
    cnt = 0
    tmp_dict = {}

    while content:
        #print content

        res = content.replace("
", "").split(" ")

        cls  = str(res[0:1][0])
        bbox = res[1:6]

        if cls in tmp_dict:
            tmp_dict[cls].append(bbox)
        else:
            tmp_dict[cls] = [bbox]
            cnt += 1

        content = rf.readline()
    rf.close()

    wpath = resource_path.split("/")[-1]
    respath = wpath[-9:-4] + "/" + wpath[-4:]
    print wpath, respath
    wfname = open(des_path, "a+")
    wfscr  = open(des_path1, "a+")
    wfbbox = open(des_path2, "a+")

    for key_ in tmp_dict:
        wfname.write(str(key_)+',')
        for detail in tmp_dict[key_]:
            for index in detail:
                if index == detail[0]:
                    wfscr.write(str(index))
                else:
                    if index is detail[1]:
                        tmpp1 = index
                        wfbbox.write(str(int(float(index))))
                    if index is detail[2]:
                        tmpp2 = index
                        wfbbox.write(str(int(float(index))))

                    if index is detail[3]:
                        wfbbox.write(str(int(float(index) - float(tmpp1))))
                    if index is detail[4]:
                        wfbbox.write(str(int(float(index) - float(tmpp2))))

                    if index is not detail[-1]:
                        wfbbox.write(",")
            if len(tmp_dict[key_]) > 1:
                if detail is not tmp_dict[key_][-1]:
                    wfscr.write(";")
                    wfbbox.write(";")
        wfname.write("
")
        wfscr.write("
")
        wfbbox.write("
")

    wfname.close()
    wfscr.close()
    wfbbox.close()

generate_result("/home/user/PycharmProjects/MissRate_FPPI_plot/comp4_det_test_person.txt", "/home/user/PycharmProjects/MissRate_FPPI_plot/out.txt")

def generate_all_result(path):
    import os
    dirList = []
    fileList = []

    files = os.listdir(path)

    for f in files:
        if(os.path.isdir(path + "/" + f)):
            if f[0] != '.':
                dirList.append(f)
        if(os.path.isfile(path + '/'+ f)):
                fileList.append(f)

    for fl in fileList:
        generate_result(path + fl, "/home/user/PycharmProjects/MissRate_FPPI_plot/out.txt")

#generate_all_result("/home/user/Downloads/caltech_data_set/test/")
还需要得到ground truth的具体信息
图(5) ground truth 标注
一张图片也可能有多个标注信息,同要也需要处理 ,想法同上边是一样的,将图片名当做key,然后用list 作为value,保存ground truth bboxes
def generate_result(resource_path, des_path):
    """
    :param path:
    :return:
    """
    supname = resource_path[-9:-4] + "/" + resource_path[-4:] + "/"
    print supname
    rf = open(resource_path)

    content = rf.readline()
    cnt = 0
    tmp_dict = {}

    while content:
        #print content
        res = content.replace("
", "").split(" ")

        cls  = supname + str(res[0:1][0])
        bbox = res[1:5]

        if cls in tmp_dict:
            tmp_dict[cls].append(bbox)
        else:
            tmp_dict[cls] = [bbox]
            cnt += 1
        content = rf.readline()
    rf.close()

    wpath = resource_path.split("/")[-1]
    respath = wpath[-9:-4] + "/" + wpath[-4:]
    print wpath, respath
    wfname = open(des_path, "a+")


    for key_ in tmp_dict:
        wfname.write(str(key_)+',')
        for detail in tmp_dict[key_]:
            for index in detail:

                    if index is detail[0]:
                        tmpp1 = index
                        wfname.write(str(int(float(index))))
                    if index is detail[1]:
                        tmpp2 = index
                        wfname.write(str(int(float(index))))
                    if index is detail[2]:
                        wfname.write(str(int(float(index))))
                    if index is detail[3]:
                        wfname.write(str(int(float(index))))
                    if index is not detail[-1]:
                        wfname.write(" ")
            if len(tmp_dict[key_]) > 1:
                if detail is not tmp_dict[key_][-1]:
                    wfname.write(",")
        wfname.write("
")
    wfname.close()


def generate_all_result(path):
    import os
    dirList = []
    fileList = []

    files = os.listdir(path)

    for f in files:
        if(os.path.isdir(path + "/" + f)):
            if f[0] != '.':
                dirList.append(f)
        if(os.path.isfile(path + '/'+ f)):
                fileList.append(f)

    for fl in fileList:
        generate_result(path + fl, "/home/user/PycharmProjects/MissRate_FPPI_plot/new_ground_truth.txt")

generate_all_result("/home/user/Downloads/caltech_data_set/data_reasonable_test/")
最后的效果是:

图(6)生成的finally_ground_truth.txt文件,最后的ground truth 结果
最后,用finally_ground_truth.txt文件和out.txt文件生成 ground truth bbox 同检测图片一一对应的结果。

图(7) 生成的与out.txt 对应的ground truth bboxes 结果(为result_pair1.txt文件)(可以同图(4-1)对比,这两个文件的名字顺序是相同的)
有了每张图片对应的bboxes的分数(out1.txt)、每张图片对应的bboxes(out2.txt)、和每张图片的对应的ground truth bboxes (result_pair1.txt)这些文件,
然后接下来用matlab读取这些文件,然后生成 [am,fppi,missRate] = evaluateDetectionMissRate(detectionResults,trainingData)中对应的detectionResults 和 trainingData
(i)生成的detectionResults保存在get_scr_bbox中
fid=fopen("/home/user/PycharmProjects/MissRate_FPPI_plot/result_pair1.txt", "rt");

data = textscan(fid, '%s', 'delimiter', '
');

data = data{1,1};

%debug
% A = data{3}
% %
% A = regexp(A, '-', 'split')
% B = A(2)
% % B = transpose(str2num(cell2mat(B)))
%
% B = str2num(cell2mat(B))

% S = regexp(B, ';', 'split')
% res = []
% [m,n] = size(S)
% for i = 1:n
%     res = [res;S(i)]
% end


get_results(64933) = struct('Boxes',[],'name',[]);
for i=1:64933
    A = data{i}
    A = regexp(A, '-', 'split')
    get_results(i).name = A(1)
    B = A(2)
    B = str2num(cell2mat(B))
    get_results(i).Boxes = B
end
%
get_results = struct2table(get_results);
while feof(fid) ~= 1
    file =  fgetl(fpn);
end

fclose(fid);
(ii)生成的trainingData保存在get_results中
fid1=fopen("/home/user/PycharmProjects/MissRate_FPPI_plot/out2.txt", "rt");
fid2=fopen("/home/user/PycharmProjects/MissRate_FPPI_plot/out1.txt", "rt");

data1 = textscan(fid1, '%s', 'delimiter', '
');
data2 = textscan(fid2, '%s', 'delimiter', '
');

data1 = data1{1,1};
data2 = data2{1,1};

%debug
%A = data1{1}
%A = cellstr(A)
%
%A = regexp(A, ';', 'split')
%A = str2num(cell2mat(A))


%B = data2{1}
%B = cellstr(B)
%B = str2num(cell2mat(B))
% B = A(2)
% % B = transpose(str2num(cell2mat(B)))
%
% B = str2num(cell2mat(B))

% S = regexp(B, ';', 'split')
% res = []
% [m,n] = size(S)
% for i = 1:n
%     res = [res;S(i)]
% end


%

get_scr_bbox(64933) = struct('Boxes',[],'Scr',[]);
for i=1:64933
    A = data1{i}
    A = cellstr(A)
    A = str2num(cell2mat(A))

    B = data2{i}
    B = cellstr(B)
    B = str2num(cell2mat(B))


    get_scr_bbox(i).Boxes = A
    get_scr_bbox(i).Scr = B
end
%
get_scr_bbox = struct2table(get_scr_bbox);
% while feof(fid) ~= 1
%     file =  fgetl(fpn);
% end

fclose(fid1);
fclose(fid2);
(iii) 最后,使用 [am,fppi,missRate] = evaluateDetectionMissRate(detectionResults,trainingData) 就可以得到最终的结果(代码在最开始)
(三)相关知识点整理
(1)Python debug —— invalid literal for int() with base 10
int(float("1.5"))
(2)matlab中的cell array, cellstr()和char()的用法
(3)MATLAB元胞数组
(4)用Matlab实现字符串分割(split)
(5)Matlab---------字符串分割(split)
S = regexp(str, 's+', 'split')
(6)matlab怎样将输入的数字字符矩阵转化为数值矩阵?
(7)matlab中cell数组的全面介绍
cell2mat
(9)matlab将cell型变成double型
>> A=transpose(str2num(cell2mat(test')))
1 1 1 1 2 2 2 2 3 3 3 3 4 4 4 4
(10)matlab如何取矩阵的某一行,或某一列
x=A(i,j);就是提取矩阵A的第i行,第j列的元素注:提取元素是MATLAB中最常用的操作x(1,:)代表提取第1行,从第1列到最后一列;x(:,1)代表提取第1列,从第1行到最后一行;其他的还有提取最大值最小值等操作,可以多看下help.或者提取矩阵A的第一行,第二列,赋给aa=A(1,2);如果光要取第一行a=A(1,:);如果光要取第二列a=A(:,2);
(11)Matlab 文件操作 [转]
(12)Matlab文件操作及读txt文件
(13)matlab 中的textscan
fid = fopen('mydata1.txt');

C = textscan(fid, ''%s%s%f32%d8%u%f%f%s%f');

fclose(fid);
(14)Python 实现图片加框和加字
from matplotlib import pyplot as plt
import cv2

im = cv2.imread("/home/user/PycharmProjects/MissRate_FPPI_plot/image001.jpg")
cv2.rectangle(im,(int(856),int(318)),(int(856+39),int(318+41)),(0,225,0),2)

plt.imshow(im)
plt.show()
(15)【搬砖】【PYTHON数据分析】PYCHARM中PLOT绘图不能显示出来
(16) python 中dict 的value 是list
tmp_dict = {}

    while content:
        #print content

        res = content.replace("
", "").split(" ")

        cls  = str(res[0:1][0])
        bbox = res[1:6]

        if cls in tmp_dict:
            tmp_dict[cls].append(bbox)
        else:
            tmp_dict[cls] = [bbox]
            cnt += 1

        content = rf.readline()
若对caltech数据集进行测评的话,需要使用code3.2.1中的dbeval 代码进行测评,之前不知道,很长时间里,都是自己画log average miss rate曲线,导致得到的分数就很高,结果很差,还不能解释...知道在github上看到了这位大牛的解释:
https://github.com/zhaoweicai/mscnn/issues/63
I finally managed to work this out... the devkit is so user-unfriendly
steps (the working dir of all the following steps is the folder of the devkit):
- I used the python script to generate detection results in #4 . The provided run_mscnn_detection.m was unreasonably slow for me
- create a folder "data-USA", and put the "annotations" folder of caltech in it (copy/soft-link/whatever)
- create a folder "data-USA/res, and place the unzipped results from other algorithms here (http://www.vision.caltech.edu/Image_Datasets/CaltechPedestrians/datasets/USA/res/)
- put your own results under res following the format of the official results from other algorithms
- run dbEval, and a folder named "results" will be created to store the generated graphs
FYI: the devkit evaluates 1 based 30,60,90... frames, so in python they are 29, 59, 89... and it is already well handled
感觉有点走上正规的感觉,哈哈哈哈