0.仓库地址
1.基础介绍
| 这个作业属于哪个课程 | 2020春|S班 |
|---|---|
| 作业要求 | 结对第二次作业——某次疫情统计可视化的实现 |
| 作业目标 | 结合寒假第一次作业的原型,采用web技术来实现其中的功能 |
| 结对学号 | 221701215(杨明伟),221701222(陈志达) |
| 作业正文 | 点击 |
| 其他参考文献 | 《构建之法》 |
2.成果展示
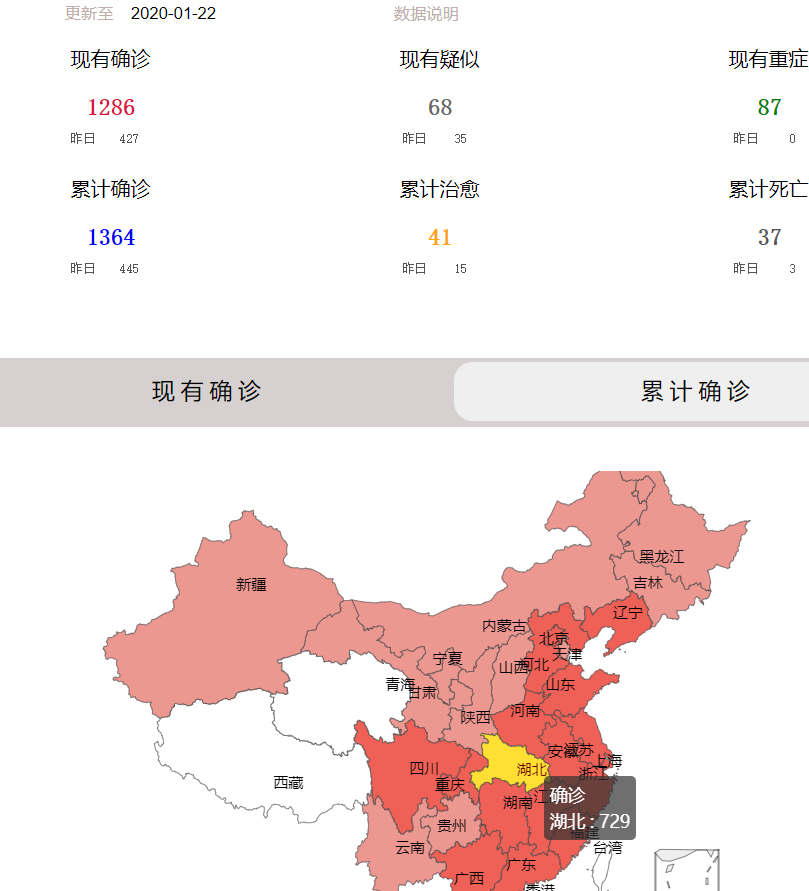
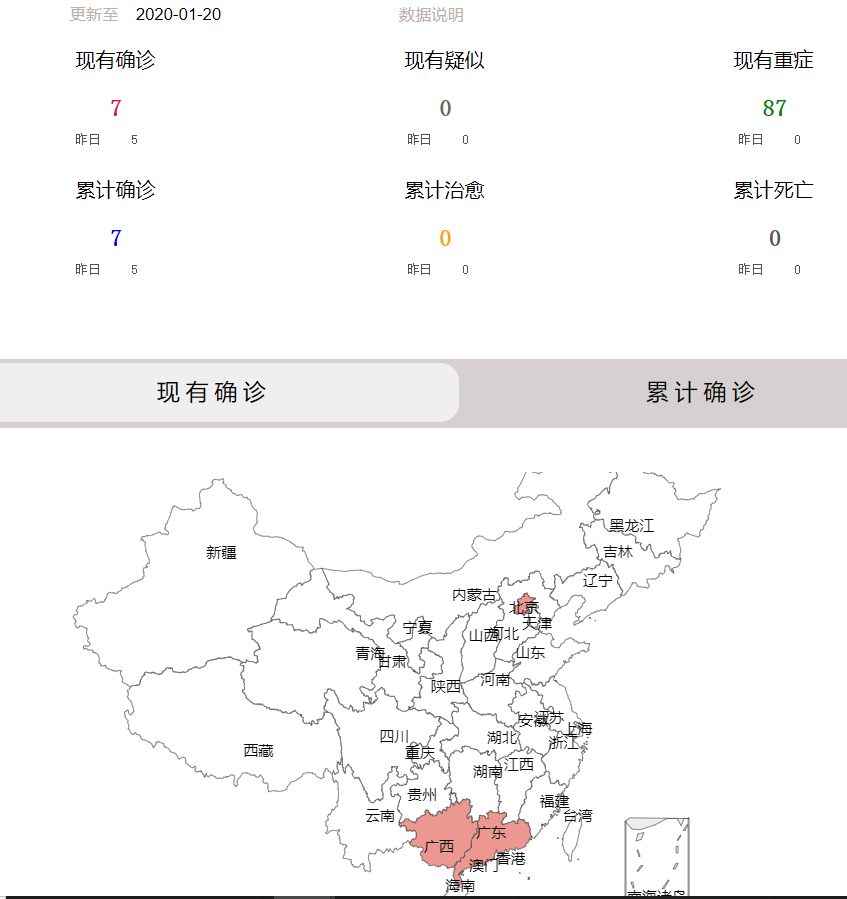
初始进入界面 出生数据显示日期统计截止2020-01-25:

省份高亮显示,并有相应的提示信息:

点击累计信息按钮,切换到累计信息,湖北累计人数变多:
输入日期信息,更新疫情地图:
过程演示
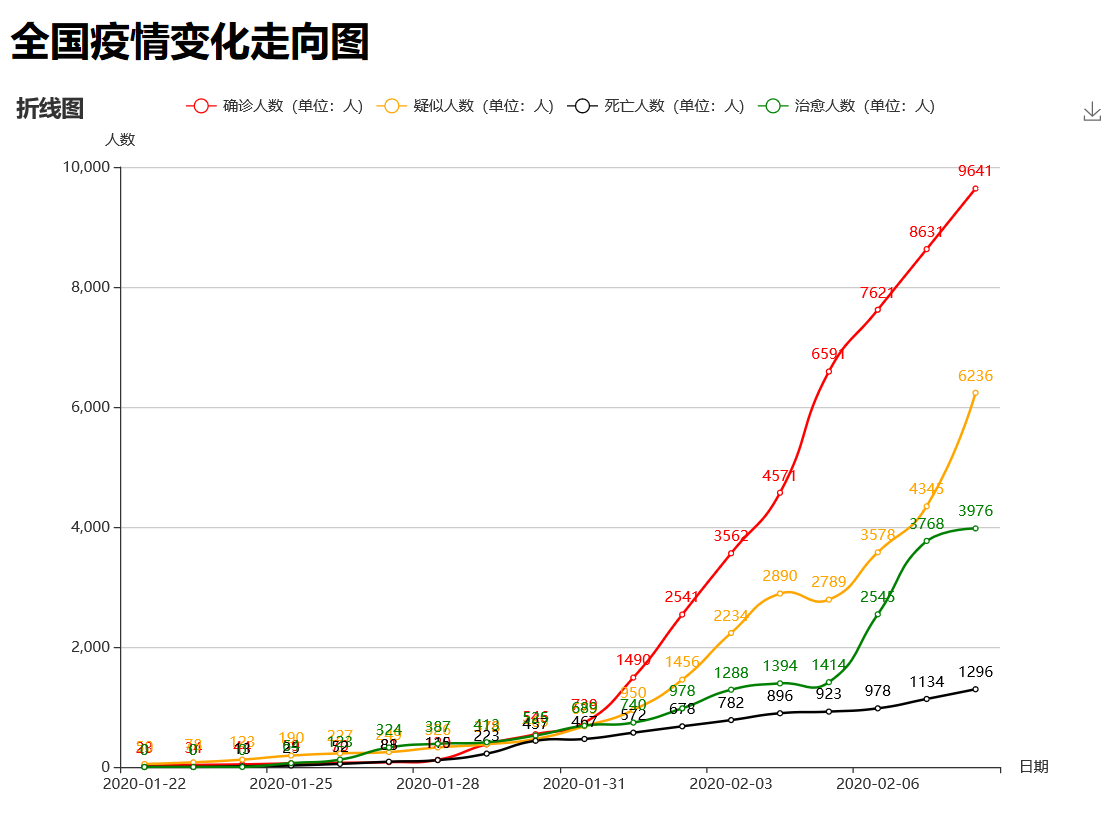
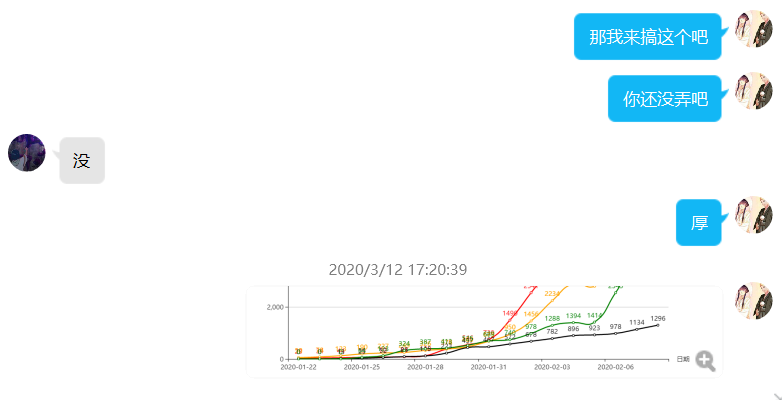
全国疫情变化趋势图:
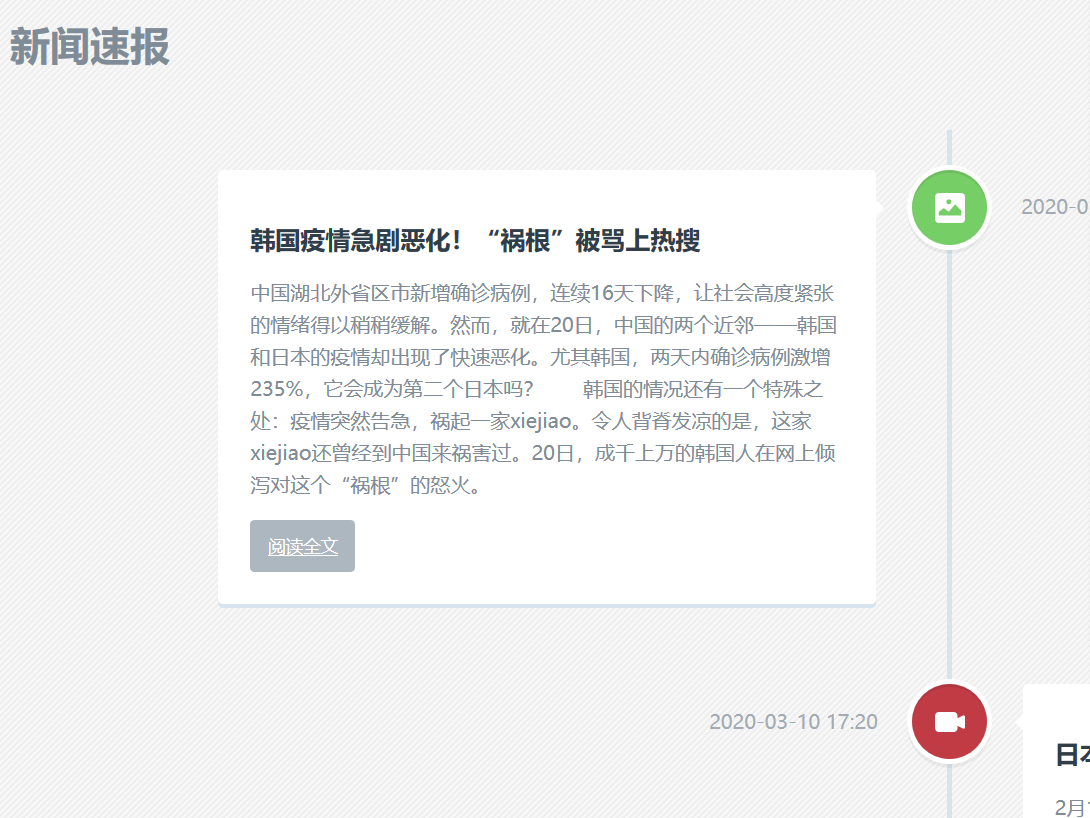
新闻速递:
3.结对讨论过程描述:


4.设计实现过程:
1.echart实现中国地图和高亮
2.实现页首统计信息
3.创建Data类从文件读取数据
4.使用Data类数据加载地图
5.活用网上例子实现额外的新闻样式
5代码说明
1.Data.getTotal()返回全国信息。
public Vector<Integer> getTotal() {
	Vector<Integer> total = new Vector<>();
	Status status = map.get("全国");
	int a[] = status.getNum();
	for (int i = 0; i < 4; i++) {
		total.add(a[i]);
	}
	Random random=new Random(1000);
	total.insertElementAt(random.nextInt(100),2);
	total.insertElementAt(a[0] + a[2] + a[3],3);

	return total;
}
2.Data.getUpdate()计算前一期日期,与当前getTotal结果先减。
public Vector<Integer> getUpdate() {
	Vector<Integer> total = new Vector<>();
	String string = command[6];
	String cmd[] = command;
	Calendar c = Calendar.getInstance();
	java.util.Date date = null;
	try {
		date = new SimpleDateFormat("yy-MM-dd").parse(string);
	} catch (Exception e) {
		e.printStackTrace();
	}
	c.setTime(date);
	int day = c.get(Calendar.DATE);
	c.set(Calendar.DATE, day - 1);
	String dayBefore = new SimpleDateFormat("yyyy-MM-dd").format(c.getTime());
	cmd[6] = dayBefore;
	DocFormatter docFormatter = new DocFormatter(cmd);
	Excute ex = new Excute(docFormatter);
	ex.run();
	Map<String, Status> map1 = ex.getMap();
	Status s1 = map1.get("全国");
	int a[] = s1.getNum();
	Vector<Integer> temp = new Vector<>();
	for (int i = 0; i < 4; i++) {
		temp.add(a[i]);
	}
	Random random = new Random(1000);
	temp.insertElementAt(random.nextInt(100), 2);
	temp.insertElementAt(a[0] + a[2] + a[3], 3);
	for (int i = 0; i < 6; i++) {
		total.add(vec.get(i) - temp.get(i));
	}

	return total;
}
3.echarts加载中国地图
var myChart = echarts.init(document.getElementById('main'));
   var optionMap = {
            backgroundColor: '#FFFFFF',
            title: {
               text: '',
                subtext: '',
                x:'center'
            },
            tooltip : {
                trigger: 'item'
            },

            //左侧小导航图标
            visualMap: {
                show : true,
                x: 'left',
                y: 'center',
                splitList: [
                    {start: 10000},{start: 1000, end: 9999},
                    {start: 100, end: 999},{start: 10, end: 99},
                    {start: 1, end: 9},{start: 0, end: 0},
                ],
                color: ['#690902', '#b61004', '#eb2517','#ef6056', '#ed9791', '#ffffff']
            },

            //配置属性
            series: [{
                name: '确诊',
                type: 'map',
                mapType: 'china',
                roam: true,
                label: {
                    normal: {
                        show: true  //省份名称
                    },
                    emphasis: {
                        show: false
                    }
                },
                data:mydata  //数据
            }
               ]
        };
myChart.clear();
    //使用制定的配置项和数据显示图表
myChart.setOption(optionMap);
4.调用data方法填入数据
<%
			String dates=(String)request.getAttribute("date");

			String[] command = { "list", "-log", "E:\echarts\log\", "-out", "F:\holiday\output1.txt", "-date",
			"2020-01-25" };
			if(dates!=null){
				command[6]=dates;
			}
			Data data = new Data(command);

		%>
		var mydate=<%=data.getTotal()%>;
		var mydata=<%=data.getUpdate()%>;
6.心路历程与收获
心路历程:做完这个作业可真不容易,后台数据传输到网页对我来说有点困难,这次虽然实现了功能,但过程和方法很粗糙,并不能让自己满意,还是要好好学技术。
对伙伴评价:是很好的伙伴,有他在不会孤军奋战,给我提供了很多的帮助,感谢他在作业完成过程的努力。