<Hands-on ML with Sklearn & TF> Chapter 1
- what is ml
- from experience E with respect to some task T and some performance measure P, if its performance on T, as measured by P, improves with experience E.
- what problems to solve
- exist solution but a lot of hand-tuning/rules
- no good solutions using a traditional approach
- fluctuating environment
- get insight about conplex problem and large data
- type
- whether or not trained with human supervision(supervised, unsupervised, semisupervised, reinforcement)
- whether or not learn incrementally on the fly(online, batch)
- whether or not work by simply comparing new data point vs know data point,or instance detect pattern in training data and build a prediction model(instace-based, model-based)
- (un)supervision learning
- supervision : include the desired solution called labels
- classification,K-Nearest Neighbors, Linear Regression, Logistic Regression, SVM, Decision Trees, Random Forests, Neural network
- unsupervision : without labels
- Clustering : k-means, HCA, ecpectation maximization
- Viualization and dimensionality reducation : PCA, kernal PCA, LLE, t-SNE
- Association rule learning : Apriori, Eclat
- semisupervision
- unsupervision --> supervision
- reinforcement : an agent in context
- observe the environment
- select and perform action
- get rewards in return
- supervision : include the desired solution called labels
- batch/online learning
- batch : offline, to known new data need to train a new version from scratch one the full dataset
- online : incremental learning : challenge is bad data
- instance-based/model-based
- instance-based : the system learns the examples by heart, then the generalizes to the new cases using a similarity measure
- model-based : studied the data; select a model; train it on the training data; applied the model to make predictions on new cases
- Challenge
- insufficient quantity of training data
- nonrepresentative training data
- poor-quality data
- irrelevant features : feature selection; feature extraction; creating new feature by gathering new data
- overfitting : regularization -> hyperparameter
- underfitting : powerful model; better feature; reduce construct
- Testing and Validating
- 80% of data for training 20% for testing
- validating : best model and hyperparameter for training set unliking perform as well on new data
- train multiple models with various hyperparameters using training data
- to get generatlization error , select the model and hyperparamaters that perform best on the validation set
- cross-validating : the training set is split into complementary subsets, ans each model is trained against a different conbination of thse subsets and validated against the remain parts.
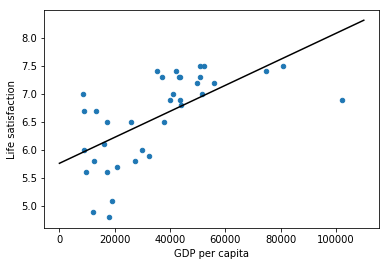
Example 1-1:
import matplotlib
import matplotlib.pyplot as plt
import numpy as np
import pandas as pd
import sklearn.linear_model

#load the data
oecd_bli = pd.read_csv("datasets/lifesat/oecd_bli_2015.csv",thousands=',')
gdp_per_capita = pd.read_csv("datasets/lifesat/gdp_per_capita.csv",thousands=',',delimiter='\t',encoding='latin1',na_values='n/a')

#prepare the data
def prepare_country_stats(oecd_bli, gdp_per_capita):
    #get the pandas dataframe of GDP per capita and Life satisfaction
    oecd_bli = oecd_bli[oecd_bli["INEQUALITY"]=="TOT"]
    oecd_bli = oecd_bli.pivot(index="Country", columns="Indicator", values="Value")
    gdp_per_capita.rename(columns={"2015": "GDP per capita"}, inplace=True)
    gdp_per_capita.set_index("Country", inplace=True)
    full_country_stats = pd.merge(left=oecd_bli, right=gdp_per_capita, left_index=True, right_index=True)
    return full_country_stats[["GDP per capita", 'Life satisfaction']]

country_stats = prepare_country_stats(oecd_bli, gdp_per_capita)
#regularization remove_indices = [0, 1, 6, 8, 33, 34, 35]
country_stats.to_csv('country_stats.csv',encoding='utf-8')
X = np.c_[country_stats["GDP per capita"]]
Y = np.c_[country_stats["Life satisfaction"]]

#Visualize the data
country_stats.plot(kind='scatter',x='GDP per capita',y='Life satisfaction')

#Select a linear model
lin_reg_model = sklearn.linear_model.LinearRegression()

#Train the model
lin_reg_model.fit(X, Y)

#plot Regression model
t0, t1 = lin_reg_model.intercept_[0], lin_reg_model.coef_[0][0]
X = np.linspace(0, 110000, 1000)
plt.plot(X, t0 + t1 * X, "k")
plt.show()

#Make a prediction for Cyprus
X_new=[[22587]]
print(lin_reg_model.predict(X_new))
课后练习挺好的