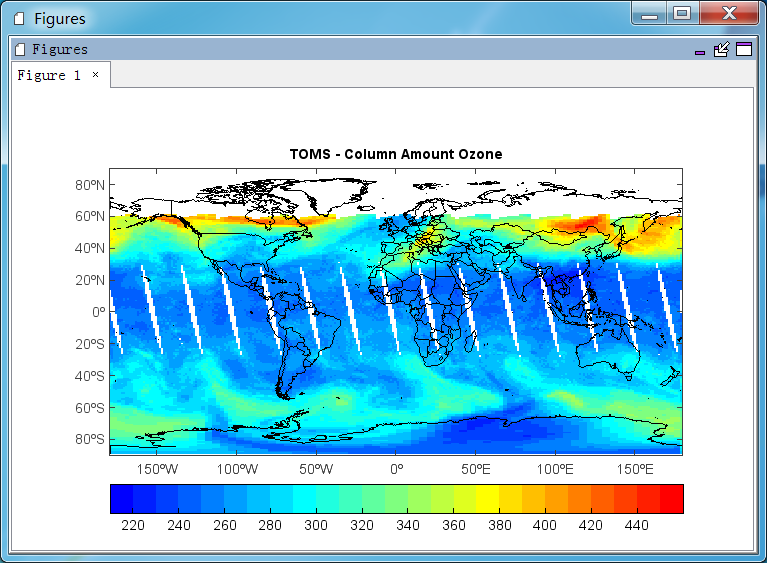
TOMS (Total Ozone Mapping Spectrometer)数据是全球臭氧观测。
脚本程序:
#Add data file
folder = 'D:/Temp/hdf/'
fns = 'TOMS-EP_L3-TOMSEPL3_2000m0101_v8.HDF'
fn = folder + fns
f = addfile(fn)
vname = 'Ozone'
v = f[vname]
ozone = v[::-1,:]
#Plot
axesm()
mlayer = shaperead('D:/Temp/map/country1.shp')
geoshow(mlayer)
layer = imshowm(ozone, 20)
colorbar(layer, orientation='horizontal')
title('TOMS - Column Amount Ozone')
axism([-180,180,-90,90])