QValueAxis
Detailed Description
The QValueAxis class is used for manipulating chart’s axis.
ValueAxis can be setup to show axis line with tick marks, grid lines and shades. Values of axis are drawn to position of ticks.
详细说明
这个QValueAxis类,用于操纵chart的图轴。
ValueAxis可以设置显示刻度轴线、网格线和阴影。以及轴的值被绘制到轴上面的位置。
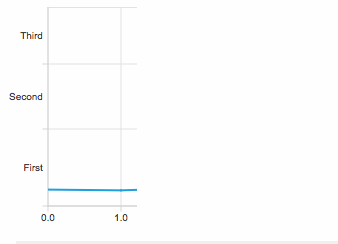
QCategoryAxis
Detailed Description
The QCategoryAxis class allows putting a named ranges on the axis.
This class can be used when the underlying data needs to be given extra meaning. Unlike with the QBarCategoryAxis the QCategoryAxis allows the categories ranges widths to be specified freely.
Example code on how to use QCategoryAxis:
详细说明
这个QCategoryAxis类允许自定义,所指定的轴范围。
这个类可以使用时,底层的数据需要给予额外的意义。与QBarCategoryAxis类的QCategoryAxis允许类范围可任意指定宽度。
这与QBarCategoryAxis的QCategoryAxis允许类范围可任意指定宽度不同。
 1   QChartView *chartView = new QChartView;
 2   QLineSeries *series = new QLineSeries;
 3   // ...
 4   chartView->chart()->addSeries(series);
 5
 6   QCategoryAxis *axisY = new QCategoryAxis;
 7   axisY->setMin(0);
 8   axisY->setMax(52);
 9   axisY->setStartValue(15);
10   axisY->append("First", 20);
11   axisY->append("Second", 37);
12   axisY->append("Third", 52);
13   chartView->chart()->setAxisY(axisY, series);
个人理解:
简单的说QValueAxis是一个懒人版,轴的范围什么的不需要自己指定,轴上显示的label(也就是0,1,2,3这些内容)是默认的。qt会根据你轴上的点自动设置。
若你需要自定义一些内容,QCategoryAxis是比较好的,但是需要自己自定义好才可以调用。