zoukankan      html  css  js  c++  java
  • echarts常见的几种图表配置如下

    pie

    配置项如下

    computed: {
        options() {
          return {
            color: ['#3388FF', '#41C6FB', '#00B587'],
            tooltip: {
              trigger: 'item'
            },
            legend: {
              show: false
            },
            series: [
              {
                name: '',
                type: 'pie',
                radius: '100%',
                animation: false,
                hoverAnimation: false,
                // legendHoverLink: false,
                data: [
                  { name: '废水企业', value: 300 },
                  { name: '废气企业', value: 300 },
                  { name: '污水厂', value: 300 }
                ],
                labelLine: { show: false },
                label: { show: false },
                emphasis: {
                  itemStyle: {
                    // shadowBlur: 10,
                    // shadowOffsetX: 0,
                    // shadowColor: 'rgba(0, 0, 0, 0.5)'
                  }
                }
              }
            ]
          }
        }
      }

     Bar

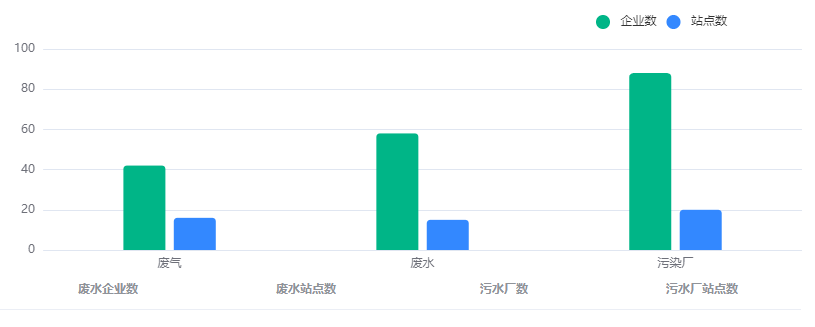
    computed: {
        options() {
            return {
                color: ['#3388FF','#41C6FB'],
                tooltip: {
                    trigger: 'axis',
                    axisPointer: {
                        type: 'cross',
                        crossStyle: {
                            color: '#999999'
                        }
                    },
                    formatter: function(params) {
                        let axisValue = ''
                        const values = []
                        for (const p in params) {
                            const item = params[p]
                            axisValue = item.axisValue
                            if (item.seriesName == '达标率') {
                                values.push(`${item.seriesName}:(${item.value})%`)
                                continue
                            }
                            values.push(`${item.seriesName}:${item.value}家`)
                        }
                        return `<b>${axisValue}</b><br>${values.join('<br>')}`
                    }
                },
                grid: {
                    left: '0%',
                    right: '0%',
                    top: '12%',
                    bottom: '3%',
                    containLabel: true
                },
                legend: {
                    show: false,
                    data: [{
                            name: '企业数',
                            icon: 'circle'
                        },
                        {
                            name: '站点数',
                            icon: 'circle'
                        },
                        {
                            name: '达标率',
                            icon: ''
                        }
                    ]
                },
                xAxis: [{
                    type: 'category',
                    data: ['火电', '锅炉', '电解铝', '钢铁', '石油化工', '水泥', '垃圾焚烧', '焦化', '平板玻璃', '其他'],
                    axisPointer: {
                        type: 'shadow'
                    },
                    axisLine: {
                        show: false
                    },
                    axisTick: {
                        show: false
                    }
                }],
                yAxis: [{
                    type: 'value',
                    name: '',
                    // min: 0,
                    // max: 250,
                    // interval: 50,
                    axisLabel: {
                        fontSize: 13,
                        color: '#606266'
                        // interval: 0,
                        // margin: 40,
                        // textStyle: {
                        //   align: 'left',
                        //   baseline: 'middle'
                        // }
                        // formatter: '{value} ml'
                    },
                    splitLine: {
                        show: true
                    }
                }],
                series: [{
                    name: '站点数',
                    type: 'bar',
                    barWidth: 42,
                    itemStyle: {
                        borderRadius: [4, 4, 0, 0]
                    },
                    data: [71, 98, 44, 12, 84, 24, 55, 97, 33, 96]
                }]
            }
        }
    },

    待后续...

    如果这篇文章对您有帮助,您可以打赏我

    技术交流QQ群:15129679

  • 相关阅读:
    131. Palindrome Partitioning
    130. Surrounded Regions
    129. Sum Root to Leaf Numbers
    128. Longest Consecutive Sequence
    125. Valid Palindrome
    124. Binary Tree Maximum Path Sum
    122. Best Time to Buy and Sell Stock II
    121. Best Time to Buy and Sell Stock
    120. Triangle
    119. Pascal's Triangle II
  • 原文地址:https://www.cnblogs.com/yeminglong/p/14549766.html
Copyright © 2011-2022 走看看