1 mysq自带的mysqladmin命令
mysqladmin -usystem -p*** -h127.0.0.1 -P3306 -r -i 1 extended-status
 |grep "Questions|Queries|Innodb_rows|Com_select |Com_insert |Com_update |Com_delete "
| Com_delete                                    | 44          |
| Com_insert                                    | 39796       |
| Com_select                                    | 497645      |
| Com_update                                    | 34154       |
| Innodb_rows_deleted                           | 22          |
| Innodb_rows_inserted                          | 138254      |
| Innodb_rows_read                              | 7600681     |
| Innodb_rows_updated                           | 39184       |
| Queries                                       | 867858      |
| Questions                                     | 859168      |
 mysqladmin -usystem -p***  -h127.0.0.1 -P3306 -r -i 1 ext |
 awk -F"|" '{
   if($2 ~ /Variable_name/){
     print " <-------------    "  strftime("%H:%M:%S") "    ------------->";
   }
   if($2 ~ /Questions|Queries|Innodb_rows|Com_select |Com_insert |Com_update |Com_delete |Innodb_buffer_pool_read_requests/)
     print $2 $3;
 }'
#!/bin/bash
u=system
p=***
h=127.0.0.1
P=3306
s=/data/mysqldata/${P}/mysql.sock

/usr/local/mysql/bin/mysqladmin -P$P -u$u -p$p -h$h -S $s -r -i 1 ext |
awk -F"|"
"BEGIN{ count=0; }"
'{ if($2 ~ /Variable_name/ && ((++count)%20 == 1)){
    print "----------|---------|--- MySQL Command Status --|----- Innodb row operation ----|-- Buffer Pool Read --";
    print "---Time---|---QPS---|select insert update delete|  read inserted updated deleted|   logical    physical";
}
else if ($2 ~ /Queries/){queries=$3;}
else if ($2 ~ /Com_select /){com_select=$3;}
else if ($2 ~ /Com_insert /){com_insert=$3;}
else if ($2 ~ /Com_update /){com_update=$3;}
else if ($2 ~ /Com_delete /){com_delete=$3;}
else if ($2 ~ /Innodb_rows_read/){innodb_rows_read=$3;}
else if ($2 ~ /Innodb_rows_deleted/){innodb_rows_deleted=$3;}
else if ($2 ~ /Innodb_rows_inserted/){innodb_rows_inserted=$3;}
else if ($2 ~ /Innodb_rows_updated/){innodb_rows_updated=$3;}
else if ($2 ~ /Innodb_buffer_pool_read_requests/){innodb_lor=$3;}
else if ($2 ~ /Innodb_buffer_pool_reads/){innodb_phr=$3;}
else if ($2 ~ /Uptime / && count >= 2){
  printf(" %s |%9d",strftime("%H:%M:%S"),queries);
  printf("|%6d %6d %6d %6d",com_select,com_insert,com_update,com_delete);
  printf("|%6d %8d %7d %7d",innodb_rows_read,innodb_rows_inserted,innodb_rows_updated,innodb_rows_deleted);
  printf("|%10d %11d
",innodb_lor,innodb_phr);
}}'
Mysql监控工具之-orzdba
http://my.oschina.net/anthonyyau/blog/304415
orzdba
yum install -y vnc svn
svn co http://code.taobao.org/svn/orzdba/trunk
chmod +x orzdba
先安装tcprstat
[root@mysql2 trunk]# yum -y install glibc-static*
[root@mysql2 trunk]# grep -n 'my $MYSQL' orzdba
160:my $MYSQL    = qq{/usr/local/mysql/bin/mysql -s --skip-column-names -usystem -p*** -h127.0.0.1 -P$port 2>/dev/null };
./orzdba --help

安装问题
Usage: Socket::inet_ntoa(ip_address_sv) at ./orz line 477
因主机名不能解析,将主机名和IP写到/etc/hosts文件
Can't close! at ./orzdba line 516.
修改160行
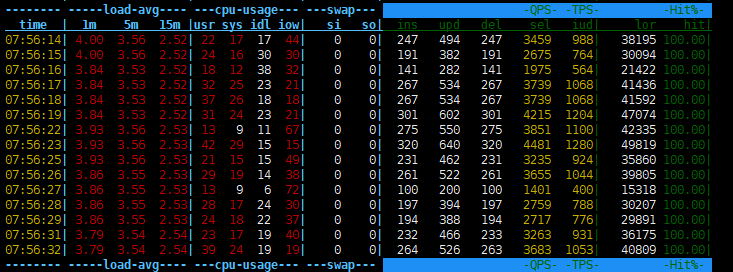
[root@mysql2 trunk]# ./orzdba -lazy  -S /data/mysqldata/3306/mysql.sock -i 1
HOST: mysql2   IP: 127.0.0.1
Warning: Using a password on the command line interface can be insecure.
DB  : chartest|performance_schema|sbtest|test2|tpcc
Var : Warning: Using a password on the command line interface can be insecure.
-------- -----load-avg---- ---cpu-usage--- ---swap---                     -QPS- -TPS-         -Hit%-
  time  |  1m    5m   15m |usr sys idl iow|   si   so|  ins   upd   del    sel   iud|     lor    hit|
04:42:19| 0.01  0.03  0.05|  0   0 100   0|    0    0|Warning: Using a password on the command line interface can be insecure.
    0     0     0      0     0|       0 100.00|
04:42:20| 0.01  0.03  0.05|  0   1  99   0|    0    0|Warning: Using a password on the command line interface can be insecure.
##由于脚本里面配置的是明文密码,Warning: Using a password on the command line interface can be insecur
##2>/dev/null
进行压力测试
./sysbench --mysql-host=127.0.0.1 --mysql-port=3306 --mysql-user=system
--test=tests/db/oltp.lua --oltp_tables_count=10 --oltp-table-size=10000 --rand-init=on prepare

 ./sysbench --mysql-host=127.0.0.1 --mysql-port=3306 --mysql-user=system
--test=tests/db/oltp.lua --oltp_tables_count=10
--oltp-table-size=10000 --num-threads=8 --oltp-read-only=off
--report-interval=10 --rand-type=uniform --max-time=3600
 --max-requests=0 --percentile=99 run >> /home/mysql/sysbench.log
然后查看oradba
[root@mysql2 trunk]# ./orzdba -lazy  -S /data/mysqldata/3306/mysql.sock -i 1
[root@mysql2 trunk]# ./orzdba -innodb  -S /data/mysqldata/3306/mysql.sock -i 1
[root@mysql2 trunk]# ./orzdba -innodb_rows  -S /data/mysqldata/3306/mysql.sock -i 1
[root@mysql2 trunk]# ./orzdba -sys  -S /data/mysqldata/3306/mysql.sock -i 1
[root@mysql2 trunk]# ./orzdba -mysql  -S /data/mysqldata/3306/mysql.sock -i 1
[root@mysql2 trunk]# ./orzdba -n eth0  -S /data/mysqldata/3306/mysql.sock -i 1
[root@mysql2 trunk]# ./orzdba -lazy -d sda -C 5 -i 2 -S /data/mysqldata/3306/mysql.sock
--dodba 工具
https://github.com/dblucyne/dodba_tools
chmod +x doDBA
./doDBA -help
[root@hqmysql1 soft]# cat doDBA.conf
{
"Host":"127.0.0.1",
"Huser": "root",
"Hport": "22",
"Hpwd":  "",
"Muser": "system",
"Mpwd":  "****",
"Mport":"3306"
}
. 收集Linux性能数据
[root@hqmysql1 soft]# ./doDBA -h=127.0.0.1 -sys
root@127.0.0.1's password:
DoDBA tools on host 127.0.0.1
---------+----load--avg----+-----cpu-usage-----+--swap--+----net----+-----------IO-----------
time     |   1m    5m   10m| usr  sys  iow  ide|  si  so| recv  send|   r/s   w/s  rb/s  wb/s
---------+-----------------+-------------------+--------+-----------+------------------------
08:13:59 | 0.11  0.12  0.09|10.0 10.0  2.2 77.8|   0   0|   0K    0K|     0    42    0K  252K
08:14:00 | 0.11  0.12  0.09| 7.1 10.1  0.0 81.8|   0   0|   0K    0K|     0    46    0K  260K
2. 收集MySQL性能数据
[root@hqmysql1 soft]# ./doDBA -h=127.0.0.1 -mysql
DoDBA tools on host 127.0.0.1
---------+-------mysql-status-------+-----threads-----+-----slow-----+---bytes---+---------locks----------
time     |   QPS  TPS  ins  upd  del| run  con cre cac| sql  tmp Dtmp| recv  send| lockI lockW openT openF
---------+--------------------------+-----------------+--------------+-----------+------------------------
10:19:46 |     0    0    0    0    0|   1    4   0   0|   0    1    0|   0K    6K|     0     0    10     9
10:19:47 |     0    0    0    0    0|   1    4   0   0|   0    1    0|   0K    6K|     0     0    10     9
10:19:48 |     0    0    0    0    0|   1    4   0   0|   0    1    0|   0K    6K|     0     0    10     9
3. 收集InnoDB性能数据
[root@hqmysql1 soft]# ./doDBA -h=127.0.0.1 -innodb
DoDBA tools on host 127.0.0.1
---------+------innodb--rows-----+---------innodb--pages--------+-------innodb--data-------+--innodb-log--
time     |    read  ins  upd  del|    data    free   dirty flush|reads writes  read written|fsyncs written
---------+-----------------------+------------------------------+--------------------------+--------------
10:20:49 |       0    0    0    0|     216   32551       0     0|    0      0    0K      0K|     0      0K
10:20:50 |       0    0    0    0|     216   32551       0     0|    0      0    0K      0K|     0      0K
10:20:51 |       0    0    0    0|     216   32551       0     0|    0      0    0K      0K|     0      0K
4. 收集MySQL及Linux性能数据
[root@hqmysql1 soft]# ./doDBA -h=127.0.0.1 -myall
root@127.0.0.1's password:
DoDBA tools on host 127.0.0.1
---------+----load--avg----+-----cpu-usage-----+--swap--+----net----+-------mysql-status-------+-slow---th---+---bytes---
time     |   1m    5m   10m| usr  sys  iow  ide|  si  so| recv  send|   QPS  TPS  ins  upd  del| sql run  con| recv  send
---------+-----------------+-------------------+--------+-----------+--------------------------+-------------+-----------
10:21:25 | 0.16  0.05  0.06| 6.2  9.4  3.1 81.2|   0   0|   0K    0K|     0    0    0    0    0|   0   1    4|   0K    6K
5. mytop --like linux top
[root@hqmysql1 soft]# ./doDBA -h=127.0.0.1 -mytop
root@127.0.0.1's password:
DoDBA tools -10:21:57 on host 127.0.0.1 UP 1 days  Load: 0.10 0.04 0.05
CPU: 0.00% user, 0.00% sys, 0.00% nice, 0.00% iowait, 0.00% idle
Mem:  996.9M total, 817.7M used, 179.3M free, 10.4M buffers
Swap:  2.0G total, 894.3M used, 1.1G free, 158.0M Cached
MySQL: 0 QPS, 0 TPS, 0 slowSQL, 0 run
6 收集到日志文件
./doDBA -h=10.1.x.xx -mysql -log
[root@hqmysql1 soft]# ./doDBA -h=127.0.0.1 -mysql -log
开启Doing功能
使用【-t】参数可以基于Threads_running的数量设置阈值,设置后可记录「processlist,engine innodb status」信息到dodba.log日志中,--复现现场。
./doDBA -h=10.1.x.xx -myall -t=3
[root@hqmysql1 soft]# ./doDBA -h=127.0.0.1 -myall -t=3
[root@localhost soft]# ./doDBA -h=127.0.0.1 -myall -t=3
root@127.0.0.1's password:
DoDBA tools on host 127.0.0.1
---------+----load--avg----+-----cpu-usage-----+--swap--+----net----+-------mysql-status-------+-slow---th---+---bytes---
time     |   1m    5m   10m| usr  sys  iow  ide|  si  so| recv  send|   QPS  TPS  ins  upd  del| sql run  con| recv  send
---------+-----------------+-------------------+--------+-----------+--------------------------+-------------+-----------
17:58:09 | 0.01  0.03  0.05| 1.0  1.3  0.0 97.7|   0   0|   0K    0K|     0    0    0    0    0|   0   2   10|   0K   13K
17:58:10 | 0.01  0.03  0.05| 0.9  1.4  0.0 97.8|   0   0|   2K    1K|     0    0    0    0    0|   0   2   10|   0K   13K
17:58:11 | 0.01  0.03  0.05| 0.9  1.4  0.0 97.8|   0   0|   0K    0K|     0    0    0    0    0|   0   2   10|   0K   13K
top
[mysql@mgr3 log]$ top
top - 08:26:29 up  1:50,  1 user,  load average: 0.00, 0.00, 0.38
Tasks: 122 total,   1 running, 121 sleeping,   0 stopped,   0 zombie
Cpu(s):  1.5%us,  1.8%sy,  0.2%ni, 84.3%id, 11.5%wa,  0.6%hi,  0.2%si,  0.0%st
Mem:   2054420k total,  1980752k used,    73668k free,    25880k buffers
Swap:  4128760k total,   137660k used,  3991100k free,    94832k cached
PID:进程的ID
  USER:进程所有者
  PR:进程的优先级别,越小越优先被执行
  NInice:值
  VIRT:进程占用的虚拟内存
  RES:进程占用的物理内存
  SHR:进程使用的共享内存
  S:进程的状态。S表示休眠,R表示正在运行,Z表示僵死状态,N表示该进程优先值为负数
  %CPU:进程占用CPU的使用率
  %MEM:进程使用的物理内存和总内存的百分比
  TIME+:该进程启动后占用的总的CPU时间,即占用CPU使用时间的累加值。
  COMMAND:进程启动命令名称
$ top -u mysql
P:按%CPU使用率排行
  T:按MITE+排行
  M:按%MEM排行
ps -ef|gerp mycat
ps -ef|gerp java
# netstat -antup|grep 2832#pid 查看pid对应的端口号
# netstat -antup|grep mysql#根据进程查看端口号
# linux 下 取进程占用内存(MEM)最高的前10个进程
# ps aux|head -1;ps aux|grep -v PID|sort -rn -k +4|head
# linux 下 取进程占用 cpu 最高的前10个进程
# ps aux|head -1;ps aux|grep -v PID|sort -rn -k +3|head
pmap
可以根据进程查看进程相关信息占用的内存情况,(进程号可以通过ps查看)如下所示:
[mysql@hqmysql1 scripts]$ pmap -d 5021
5021:   /bin/sh /usr/local/mysql/bin/mysqld_safe --defaults-file=/data/mysqldata/3306/my.cnf
ps,free
$ ps -e -o 'pid,comm,args,pcpu,rsz,vsz,stime,user,uid'  其中rsz是是实际内存
$ ps -e -o 'pid,comm,args,pcpu,rsz,vsz,stime,user,uid' | grep mysql |  sort -nr

占用内存的测量
测量一个进程占用了多少内存,linux为我们提供了一个很方便的方法,/proc目录为我们提供了所有的信息,实际上top等工具也通过这里来获取相应的信息。
cat /proc/meminfo 机器的内存使用信息
/proc/pid/maps pid为进程号,显示当前进程所占用的虚拟地址。
/proc/pid/statm 进程所占用的内存
---vmstat,iostat,mpstat,ifstat
vmstat:虚拟内存状况
vmstat命令是最常见的Linux/Unix监控工具,可以展现给定时间间隔的服务器的状态值,包括服务器的CPU使用率,内存使用,虚拟内存交换情况,IO读写情况。
[root@mysql2 ~]# vmstat 2 #每2秒采集一次服务器状态
procs -----------memory---------- ---swap-- -----io---- --system-- -----cpu-----
 r  b   swpd   free   buff  cache   si   so    bi    bo   in   cs us sy id wa st
 1  0      0 1402820  19564 109324    0    0   263    14  138  420  1  3 94  3  0
 0  0      0 1402804  19564 109324    0    0     0     0   27   13  0  0 100  0  0
r 表示运行队列(就是说多少个进程真的分配到CPU),当这个值超过了CPU数目,就会出现CPU瓶颈了
b 表示阻塞的进程
swpd 虚拟内存已使用的大小,如果大于0,表示你的机器物理内存不足了,如果不是程序内存泄露的原因,
    那么你该升级内存了或者把耗内存的任务迁移到其他机器。
free   空闲的物理内存的大小
buff   Linux/Unix系统是用来存储,目录里面有什么内容,权限等的缓存
cache cache直接用来记忆我们打开的文件,给文件做缓冲,把空闲的物理内存的一部分拿来做文件和目录的缓存,
        是为了提高 程序执行的性能,当程序使用内存时,buffer/cached会很快地被使用。
si  每秒从磁盘读入虚拟内存的大小,如果这个值大于0,表示物理内存不够用或者内存泄露了,要查找耗内存进程解决掉。
so  每秒虚拟内存写入磁盘的大小,如果这个值大于0,同上
bi  块设备每秒接收的块数量,这里的块设备是指系统上所有的磁盘和其他块设备,默认块大小是1024byte
bo 块设备每秒发送的块数量,例如我们读取文件,bo就要大于0。bi和bo一般都要接近0,不然就是IO过于频繁,需要调整
in 每秒CPU的中断次数,包括时间中断
cs 每秒上下文切换次数,例如我们调用系统函数,就要进行上下文切换,线程的切换,也要进程上下文切换,这个值要越小越好
    上下文切换次数过多表示你的CPU大部分浪费在上下文切换,导致CPU干正经事的时间少了,CPU没有充分利用,是不可取的
us 用户CPU时间
sy 系统CPU时间,如果太高,表示系统调用时间长,例如是IO操作频繁
id  空闲 CPU时间,一般来说,id + us + sy = 100,
wt 等待IO CPU时间。
iostat:io状况
#avgqu-sz   await  svctm
iostat主要用于监控系统设备的IO负载情况,iostat首次运行时显示自系统启动开始的各项统计信息,
之后运行iostat将显示自上次运行该命令以后的统计信息。用户可以通过指定统计的次数和时间来获得所需的统计信息。
[root@mysql2 ~]# iostat -d -k 1 10
Linux 2.6.39-200.24.1.el6uek.x86_64 (mysql2)     05/10/2016     _x86_64_    (2 CPU)

Device:            tps    kB_read/s    kB_wrtn/s    kB_read    kB_wrtn
sda               7.67       109.70         6.52     140258       8337
scd1              0.04         0.14         0.00        180          0
dm-0              7.90       106.01         6.51     135541       8328
dm-1              0.25         1.01         0.00       1288          0

Device:            tps    kB_read/s    kB_wrtn/s    kB_read    kB_wrtn
sda               0.99         7.92         0.00          8          0
scd1              0.00         0.00         0.00          0          0
dm-0              0.00         0.00         0.00          0          0
dm-1              0.00         0.00         0.00          0          0

dm-0,dm-1 ,次设备号分别是0、1,这类设备在/dev/mapper中
# dmsetup ls
# cd /dev/mapper; ll
关于mapper, 是 Linux2.6 内核中支持逻辑卷管理的通用设备映射机制,它为实现用于存储资源管理的块设备驱动提供了一个高度模块化的内核架构

tps:该设备每秒的传输次数,"一次传输"意思是"一次I/O请求"。
kB_read/s:每秒从设备(drive expressed)读取的数据量;
kB_wrtn/s:每秒向设备(drive expressed)写入的数据量;
kB_read:读取的总数据量;
kB_wrtn:写入的总数量数据量;这些单位都为Kilobytes。
[root@mysql2 ~]# iostat -d sda 2#指定只监控sda
Linux 2.6.39-200.24.1.el6uek.x86_64 (mysql2)     05/10/2016     _x86_64_    (2 CPU)

Device:            tps   Blk_read/s   Blk_wrtn/s   Blk_read   Blk_wrtn
sda               6.50       185.79        11.13     280532      16802
iostat -d -k 1 10         #查看TPS和吞吐量信息(磁盘读写速度单位为KB)
iostat -d -m 2            #查看TPS和吞吐量信息(磁盘读写速度单位为MB)
iostat -d -x -k 1 10      #查看设备使用率(%util)、响应时间(await)
iostat -c 1 10 #查看cpu状态
-x 参数
[root@mysql2 ~]# iostat -d -x -k 1 10
Linux 2.6.39-200.24.1.el6uek.x86_64 (mysql2)     05/10/2016     _x86_64_    (2 CPU)

Device:         rrqm/s   wrqm/s     r/s     w/s    rkB/s    wkB/s avgrq-sz avgqu-sz   await  svctm  %util
sda               0.23     0.81    5.30    0.42    81.61     4.95    30.27     0.05    8.19   1.89   1.08
scd1              0.00     0.00    0.03    0.00     0.10     0.00     8.00     0.00    0.40   0.40   0.00
dm-0              0.00     0.00    4.70    1.20    78.87     4.95    28.41     0.05    8.28   1.78   1.05
dm-1              0.00     0.00    0.19    0.00     0.75     0.00     8.00     0.00    1.64   1.64   0.03
[root@mysql2 trunk]# iostat -mxt 1
rrqm/s:每秒这个设备相关的读取请求有多少被Merge了(当系统调用需要读取数据的时候,VFS将请求发到各个FS,
如果FS发现不同的读取请求读取的是相同Block的数据,FS会将这个请求合并Merge);
wrqm/s:每秒这个设备相关的写入请求有多少被Merge了。
rsec/s:每秒读取的扇区数;
wsec/:每秒写入的扇区数。
rKB/s:The number of read requests that were issued to the device per second;
wKB/s:The number of write requests that were issued to the device per second;
avgrq-sz 平均请求扇区的大小
avgqu-sz 是平均请求队列的长度。毫无疑问,队列长度越短越好。
await:  每一个IO请求的处理的平均时间(单位是微秒毫秒)。这里可以理解为IO的响应时间,一般地系统IO响应时间应该低于5ms,如果大于10ms就比较大了。
         这个时间包括了队列时间和服务时间,也就是说,一般情况下,await大于svctm,它们的差值越小,
         则说明队列时间越短,反之差值越大,队列时间越长,说明系统出了问题。
svctm    表示平均每次设备I/O操作的服务时间(以毫秒为单位)。如果svctm的值与await很接近,表示几乎没有I/O等待,磁盘性能很好,如果await的值远高于svctm的值,则表示I/O队列等待太长,         系统上运行的应用程序将变慢。
%util: 在统计时间内所有处理IO时间,除以总共统计时间。例如,如果统计间隔1秒,该设备有0.8秒在处理IO,而0.2秒闲置,
那么该设备的%util = 0.8/1 = 80%,所以该参数暗示了设备的繁忙程度。一般地,如果该参数是100%表示设备已经接近满负荷
运行了(当然如果是多磁盘,即使%util是100%,因为磁盘的并发能力,所以磁盘使用未必就到了瓶颈)。
mpstat:CPU的状况#另一个用于获取 CPU 相关统计信息的有用的命令是 mpstat。mpstat 可以显示每个处理器的统计
# cat /proc/cpuinfo
[root@mysql2 ~]# mpstat -P ALL 1 2
Linux 2.6.39-200.24.1.el6uek.x86_64 (mysql2)     05/10/2016     _x86_64_    (2 CPU)

10:14:03 PM  CPU    %usr   %nice    %sys %iowait    %irq   %soft  %steal  %guest   %idle
10:14:04 PM  all    0.00    0.00    0.52    0.00    0.00    0.00    0.00    0.00   99.48
10:14:04 PM    0    0.00    0.00    0.00    0.00    0.00    0.00    0.00    0.00  100.00
10:14:04 PM    1    0.00    0.00    0.00    0.00    0.00    0.00    0.00    0.00  100.00
sys usr iowait
ifstat:网络状况
wget http://gael.roualland.free.fr/ifstat/ifstat-1.1.tar.gz #下载并安装
tar -zxvf ifstat-1.1.tar.gz
./configure
make && make install
[root@mysql2 ifstat-1.1]# ifstat -i eth0
       eth0
 KB/s in  KB/s out
    1.05      0.13
    0.53      0.12
    0.29      0.12
    0.23      0.12
in  out
dstat:所有资源统计汇总
资源汇总
[root@hongquan1 ~]# sar -n DEV 1 10000 #观察网卡流量
Linux 2.6.39-200.24.1.el6uek.x86_64 (hongquan1)     01/26/2018     _x86_64_    (2 CPU)
03:48:00 AM     IFACE   rxpck/s   txpck/s    rxkB/s    txkB/s   rxcmp/s   txcmp/s  rxmcst/s
03:48:01 AM        lo     57.83     57.83     10.53     10.53      0.00      0.00      0.00
03:48:01 AM      eth0     26.51     16.87      2.24      1.47      0.00      0.00      0.00
使用qperf命令来测试网络带宽和网络延迟
[root@hongquan1 yum.repos.d]# yum install qperf
[root@hongquan1 yum.repos.d]# qperf
^C
[root@hongquan2 yum.repos.d]# qperf -t 60 --use_bits_per_sec  192.168.20.118 tcp_bw tcp_lat
tcp_bw:
    bw  =  1.49 Gb/sec ---网络带宽
tcp_lat:
    latency  =  48.1 us --网络延时
pidstat
]#pidstat -u -t -p 4552 1
[root@hongquan1 bin]# pidstat -u -t -p 1854 1
Linux 2.6.39-200.24.1.el6uek.x86_64 (hongquan1)     04/24/2018     _x86_64_    (2 CPU)

02:20:08 AM      TGID       TID    %usr %system  %guest    %CPU   CPU  Command
02:20:09 AM      1854         -    0.00    0.00    0.00    0.00     0  mysqld_safe
02:20:09 AM         -      1854    0.00    0.00    0.00    0.00     0  |__mysqld_safe

pidstat -u -t -p 'pidof mysqld' 1 ,如果只有一个mysqld进程的话
pt-ioprofile--查询进程IO并打印一个IO活动表
[root@hqmysql1 trunk]# /usr/bin/pt-ioprofile --profile-pid=19616 --cell=sizes
Tue Aug  1 14:28:32 CST 2017
Tracing process ID 19616
     total     pwrite      write      fsync       open      close   getdents filename
   2260992    2260992          0          0          0          0          0 /data/mysqldata/3306/log/iblog/ibdata1
    622592     622592          0          0          0          0          0 /data/mysqldata/3306/data/zabbix/history.ibd
    393216     393216          0          0          0          0          0 /data/mysqldata/3306/data/zabbix/history_uint
read:从文件中读出数据。要读取的文件用文件描述符标识,数据读入一个事先定义好的缓冲区
write:把缓冲区的数据写入文件中
pread:由于lseek和read调用之间,内核可能会临时挂起进程,所以对同步问题造成了问题,调用pread相当于顺序调用了lseek和read,这两个操作相当于一个捆绑的原子操作
pwrite:由于lseek和write调用之间,内核可能会临时挂起进程,所以对同步问题造成了问题,调用pwrite相当于顺序调用了lseek 和write,这两个操作相当于一个捆绑的原子操作
fsync:确保文件所有已修改的内容已经正确同步到硬盘上,该调用会阻塞等待直到设备报告IO完成
open:打开一个文件,并返回这个文件的描述符
close:close系统调用用于“关闭”一个文件,close调用终止一个文件描述符以其文件之间的关联。文件描述符被释放,并能够重新使用
lseek:对文件描述符指定文件的读写指针进行设置,也就是说,它可以设置文件的下一个读写位置
fcntl:针对(文件)描述符提供控制
--参数
--cell=times|sizes|count,显示的单位,默认是times,即IO操作的时间,也可指定为count(O操作的次数),size(IO操作的大小)
--group-by=filename|all|pid
分组的单位,默认是filename,即对文件名进行统计,也可指定为all,即对所有操作进行统计,pid,对进程进行统计(
不太确定这里的进程指的是什么?怀疑是线程,但线程不可能这么少,具体可参考下面的输出)
--profile-pid 指定线程的ID
--profile-process 指定线程名
--run-time  执行strace命令的时间,OPT_RUN_TIME就是--run-time指定的值
--save-samples 将strace和lsof获取的结果保存到指定的文件中
[root@hongquan1 bin]# ./pt-ioprofile --profile-pid=2894 --cell=count --run-time=60 --save-samples=/tmp/ptiofile_2018050701.log
#pstack
Linux下有时候我们需要知道一个进程在做什么,比如说程序不正常的时候,他到底在干吗?最直接的方法就是打印出他所有线程的调用栈,
这样我们从栈再配合程序代码就知道程序在干吗了
[root@mysql2 ~]# pstack 3311
[root@hongquan1 soft]# pstack `pidof mysqld` > pid.info
[root@hongquan1 soft]# pt-pmp pid.info
     40 poll(libc.so.6),vio_io_wait,vio_socket_io_wait,vio_read,net_read_raw_loop,net_read_packet,my_net_read,Protocol_classic::read_packet,Protocol_classic::get_command,do_command,handle_connection,pfs_spawn_thread,start_thread(libpthread.so.0),clone(libc.so.6)
     38 pthread_cond_wait,Per_thread_connection_handler::block_until_new_connection,handle_connection,pfs_spawn_thread,start_thread(libpthread.so.0),clone(libc.so.6)
     16 pthread_cond_wait,os_event::wait_low,os_aio_handler,fil_aio_wait,io_handler_thread,start_thread(libpthread.so.0),clone(libc.so.6)
      1 sigwait(libpthread.so.0),signal_hand,pfs_spawn_thread,start_thread(libpthread.so.0),clone(libc.so.6)
      1 sigwaitinfo(libc.so.6),timer_notify_thread_func,pfs_spawn_thread,start_thread(libpthread.so.0),clone(libc.so.6)
      1 pthread_cond_wait,os_event::wait_low,srv_purge_coordinator_thread,start_thread(libpthread.so.0),clone(libc.so.6)
      1 pthread_cond_wait,os_event::wait_low,buf_resize_thread,start_thread(libpthread.so.0),clone(libc.so.6)
      1 pthread_cond_wait,os_event::wait_low,buf_flush_page_cleaner_worker,start_thread(libpthread.so.0),clone(libc.so.6)
      1 pthread_cond_wait,os_event::wait_low,buf_dump_thread,start_thread(libpthread.so.0),clone(libc.so.6)
      1 pthread_cond_wait,Event_queue::cond_wait,Event_queue::get_top_for_execution_if_time,Event_scheduler::run,event_scheduler_thread,pfs_spawn_thread,start_thread(libpthread.so.0),clone(libc.so.6)
      1 pthread_cond_wait,compress_gtid_table,pfs_spawn_thread,start_thread(libpthread.so.0),clone(libc.so.6)
      1 pthread_cond_timedwait,os_event::timed_wait,os_event::wait_time_low,srv_monitor_thread,start_thread(libpthread.so.0),clone(libc.so.6)
      1 pthread_cond_timedwait,os_event::timed_wait,os_event::wait_time_low,srv_error_monitor_thread,start_thread(libpthread.so.0),clone(libc.so.6)
      1 pthread_cond_timedwait,os_event::timed_wait,os_event::wait_time_low,lock_wait_timeout_thread,start_thread(libpthread.so.0),clone(libc.so.6)
      1 pthread_cond_timedwait,os_event::timed_wait,os_event::wait_time_low,ib_wqueue_timedwait,fts_optimize_thread,start_thread(libpthread.so.0),clone(libc.so.6)
      1 pthread_cond_timedwait,os_event::timed_wait,os_event::wait_time_low,dict_stats_thread,start_thread(libpthread.so.0),clone(libc.so.6)
      1 poll(libc.so.6),Mysqld_socket_listener::listen_for_connection_event,mysqld_main,__libc_start_main(libc.so.6),_start
      1 nanosleep(libpthread.so.0),os_thread_sleep,srv_master_thread,start_thread(libpthread.so.0),clone(libc.so.6)
      1 fsync(libpthread.so.0),os_file_flush_func,fil_flush,buf_dblwr_flush_buffered_writes,buf_flush_do_batch,buf_flush_lists,buf_flush_page_cleaner_coordinator,start_thread(libpthread.so.0),clone(libc.so.6)
pt-pmp有两方面的作用:一是获取进程的堆栈信息,二是对这些堆栈信息进行汇总。
进程的堆栈信息是利用gdb获取的,所以在获取的过程中,会对mysql服务端的性能有一定的影响
#tcprstat,tcprstat是percona用来监测mysql响应时间的。不过对于任何运行在TCP协议上的响应时间,都可以用
[root@12crac1 software]# mv tcprstat-static.v0.3.1.x86_64 /usr/bin/tcprstat
[root@12crac1 software]# chmod +x /usr/bin/tcprstat
[root@12crac1 software]# tcprstat -p 3306 -t 1 -n 5
timestamp    count    max    min    avg    med    stddev    95_max    95_avg    95_std    99_max    99_avg    99_std
1462935510    0    0    0    0    0    0    0    0    0    0    0    0
1462935511    0    0    0    0    0    0    0    0    0    0    0    0
1462935512    0    0    0    0    0    0    0    0    0    0    0    0
1462935513    0    0    0    0    0    0    0    0    0    0    0    0
1462935514    0    0    0    0    0    0    0    0    0    0    0    0
命令行参数    简短形式   类型      描述                    默认值
--format    -f        字符串     输出格式化字符串  ”%T	%n	%M	%m	%a	%h	%S	%95M	%95a	%95S	%99M	%99a	%99S
”
--help                          显示帮助信息
--interval  -t        数字      监控多少秒输出一次统计     10
--iterations  -n      数字      共输出几次统计信息         1
--local       -l      字符串    本级ip地址列表
--port        -p      数字      服务端口
--read        -r      字符串    pcap文件路径
#perf,查看实时的统计信息
[mysql@mysql2 full]$ ps -ef |grep mysql
[root@mysql2 ~]# perf top -p 3311
http://f.dataguru.cn/forum.php?mod=viewthread&tid=354010  perf系统性能优化工具
list, record, report, script, stat, top
$ perf report --sort comm,dso,symbol | head -10
  PerfTop:       7 irqs/sec  kernel:42.9%  exact:  0.0% [1000Hz cpu-clock],  (target_pid: 2974)
---------------------------------------------------------------------------------------------------------------------------------------------------------------------------------------------------------------

             samples  pcnt function                                                                                                              DSO
             _______ _____ _____________________________________________________________________________________________________________________ ___________________________

              176.00 14.8% _Z24btr_search_guess_on_hashP12dict_index_tP12btr_search_tPK8dtuple_tmmP9btr_cur_tmP5mtr_t                            /usr/local/mysql/bin/mysqld
              147.00 12.3% _Z20rec_get_offsets_funcPKhPK12dict_index_tPmmPP16mem_block_info_t                                                    /usr/local/mysql/bin/mysqld
              108.00  9.1% _Z16buf_page_get_genRK9page_id_tRK11page_size_tmP11buf_block_tmPKcmP5mtr_tb                                           /usr/local/mysql/bin/mysqld
               85.00  7.1% my_strnncollsp_utf8                                                                                                   /usr/local/mysql/bin/mysqld
               74.00  6.2% _Z29cmp_dtuple_rec_with_match_lowPK8dtuple_tPKhPKmmPm                                                                 /usr/local/mysql/bin/mysqld
               70.00  5.9% _Z23ha_insert_for_fold_funcP12hash_table_tmPKh                                                                        /usr/local/mysql/bin/mysqld
               67.00  5.6% _Z26page_cur_search_with_matchPK11buf_block_tPK12dict_index_tPK8dtuple_t15page_cur_mode_tPmS9_P10page_cur_tP8rtr_info /usr/local/mysql/bin/mysqld
               65.00  5.5% _raw_spin_unlock_irqrestore                                                                                           [kernel.kallsyms]
               49.00  4.1% __GI_memcpy                                                                                                           /lib64/libc-2.12.so
               36.00  3.0% _Z8ut_delaym                                                                                                          /usr/local/mysql/bin/mysqld
               31.00  2.6% _Z27ha_remove_all_nodes_to_pageP12hash_table_tmPKh                                                                    /usr/local/mysql/bin/mysqld
               28.00  2.3% _Z19ha_delete_hash_nodeP12hash_table_tP9ha_node_t                                                                     /usr/local/mysql/bin/mysqld
               27.00  2.3% finish_task_switch                                                                                                    [kernel.kallsyms]
               23.00  1.9% _ZN11PolicyMutexI14TTASEventMutexI16BlockMutexPolicyEE5enterEjjPKcj                                                   /usr/local/mysql/bin/mysqld
               17.00  1.4% _ZL15cmp_whole_fieldmmPKhjS0_j                                                                                        /usr/local/mysql/bin/mysqld
               12.00  1.0% _Z15row_search_mvccPh15page_cur_mode_tP14row_prebuilt_tmm                                                             /usr/local/mysql/bin/mysqld
               12.00  1.0% _ZN5mtr_t7Command11release_allEv                                                                                      /usr/local/mysql/bin/mysqld
               11.00  0.9% _Z40row_sel_field_store_in_mysql_format_funcPhPK17mysql_row_templ_tPKhm                                               /usr/local/mysql/bin/mysqld
               10.00  0.8% _Z41btr_cur_search_to_nth_level_with_no_latchP12dict_index_tmPK8dtuple_t15page_cur_mode_tP9btr_cur_tPKcmP5mtr_tb      /usr/local/mysql/bin/mysqld
               10.00  0.8% get_charset                                                                                                           /usr/local/mysql/bin/mysqld
               10.00  0.8% _Z18get_datetime_valueP3THDPPP4ItemS3_S2_Pb                                                                           /usr/local/mysql/bin/mysqld
               10.00  0.8% _ZL30row_sel_store_mysql_field_funcPhP14row_prebuilt_tPKhPKmmPK17mysql_row_templ_tm                                   /usr/local/mysql/bin/mysqld
                9.00  0.8% _Z11ut_crc32_hwPKhm                                                                                                   /usr/local/mysql/bin/mysqld
                8.00  0.7% _Z27btr_cur_search_to_nth_levelP12dict_index_tmPK8dtuple_t15page_cur_mode_tmP9btr_cur_tmPKcmP5mtr_t                   /usr/local/mysql/bin/mysqld
                7.00  0.6% _ZL18rw_lock_s_lock_lowP9rw_lock_tmPKcm                                                                               /usr/local/mysql/bin/mysqld
                7.00  0.6% _ZL23row_sel_store_mysql_recPhP14row_prebuilt_tPKhPK8dtuple_tmPK12dict_index_tPKmb                                    /usr/local/mysql/bin/mysqld
                6.00  0.5% _Z18row_search_no_mvccPh15page_cur_mode_tP14row_prebuilt_tmm                                                          /usr/local/mysql/bin/mysqld
                6.00  0.5% _ZN11PolicyMutexI14TTASEventMutexI16BlockMutexPolicyEE4exitEv                                                         /usr/local/mysql/bin/mysqld
                6.00  0.5% _Z38row_mysql_store_col_in_innobase_formatP8dfield_tPhmPKhmm                                                          /usr/local/mysql/bin/mysqld
                6.00  0.5% _Z21dict_index_copy_typesP8dtuple_tPK12dict_index_tm                                                                  /usr/local/mysql/bin/mysqld
                5.00  0.4% _Z18buf_block_from_ahiPKh                                                                                             /usr/local/mysql/bin/mysqld
                5.00  0.4% system_call_after_swapgs                                                                                              [kernel.kallsyms]
                5.00  0.4% pfs_start_rwlock_wait_v1                                                                                              /usr/local/mysql/bin/mysqld


#pt-stalk
pt-stalk 适用场景:

   ① MySQL Server 性能波动出现的频率很低、例如、几天一次
   ② MySQL Server 性能波动出现的机率很快、例如、几秒闪过
#tcpdump抓包
tcpdump [ -AdDeflLnNOpqRStuUvxX ] [ -c count ]
           [ -C file_size ] [ -F file ]
           [ -i interface ] [ -m module ] [ -M secret ]
           [ -r file ] [ -s snaplen ] [ -T type ] [ -w file ]
           [ -W filecount ]
           [ -E spi@ipaddr algo:secret,...  ]
           [ -y datalinktype ] [ -Z user ]
           [ expression ]

tcpdump -s 0 -l -w - dst 10.35.9.71 and port 3306 |strings

tcpdump -s 0 -i eth0 -l -w - dst 10.35.9.71 and port 3306 |strings
tcpdump -i lo -s 0 -i eth0 -l -w - dst port 3306 and src host 10.35.9.71 | strings | grep -i -E '<SELECT>'
tcpdump -s 0 -i eth0 -l -w - dst port 3306 and src host 10.35.9.71 | strings

截获主机hostname发送的所有数据
tcpdump src host hostname
监视所有发送到主机hostname的数据包
tcpdump dst host hostname
抓取ping包
# tcpdump -c 5 -nn -i eth0 icmp

# tcpdump -s 65535 -x -nn -q -tttt -i any -c 1000 port 3306 > mysql.tcp.txt
# pt-query-digest --type tcpdump mysql.tcp.txt

#!/bin/bash

tcpdump -i any -s 0 -l -w - dst 10.35.9.71 and port 3306 | strings | perl -e '
while(<>) { chomp; next if /^[^ ]+[ ]*$/;
    if(/^(SELECT|UPDATE|DELETE|INSERT|SET|COMMIT|ROLLBACK|CREATE|DROP|ALTER|CALL)/i)
    {
        if (defined $q) { print "$q
"; }
        $q=$_;
    } else {
        $_ =~ s/^[ 	]+//; $q.=" $_";
    }
}'
[root@mysql2 ~]# tcpdump -s 0 -l -w - dst 192.168.2.195 and port 3306 |strings
tcpdump: listening on eth0, link-type EN10MB (Ethernet), capture size 65535 bytes
show databases
2W)s
SELECT DATABASE()
test
[root@hongquan1 etc]# tcpdump -s 0 -l -w - dst 192.168.20.118 and port 3306 |strings
案例一:
       抓取特定主机192.168.135.128发送过来的数据包:           time tcpdump -i eth0 -s 65535 src host 192.168.135.128 and port 3306 -w 20140801-db-01.dmp

       # 获取发送过来的数据包
       strings 20140801-db-01.dmp | grep -i 'select' | awk '{printf("%s %s %s %sn", $1,$2,$3, $4);}'| sort | uniq -c | awk '{printf("%06ld %s %s %s %sn", $1,$2,$3,$4,$5);}'| sort
案例二:
      和pt-query-digest配合,调优MySQL服务器;
      ## pt-query-digest 对于tcpdump抓取包有一定的格式要求:(-x -nn -q -tttt)
      tcpdump -s 65535 -x -nn -q -tttt -i any -c 100000 port 3306 > test.dmp
   pt-query-digest --limit 10 --type tcpdump test.dmp > report.log

   ## 遇到内核丢包严重的情况,为了避免结果失真,可以抽样tcpdump数据包
    tcpdump -i eth0 -s 65535 -x -n -q -tttt 'port 3306 and tcp[1] & 7 == 2 and tcp[3] & 7 == 2'  > test.dmp
案例三:    抓取特定主机发送的SQL语句
Shell版本:

#!/bin/bash
tcpdump -i lo -s 0 -l -w - dst port 3306 and src host 192.168.170.17 | strings | grep -i -E '<select>|<insert>|<update>|<delete>|<commit>|<rollback>|<create>|<drop>|<alter>|<call>|<set>'
iotop – simple top-like I/O monitor
iotop是一个用来监视磁盘I/O使用状况的 top 类工具,可监测到哪一个程序使用的磁盘IO的信息(requires 2.6.20 or later)
yum -y install iotop
# iotop -oP

--version #显示版本号
-h, --help #显示帮助信息
-o, --only #显示进程或者线程实际上正在做的I/O,而不是全部的,可以随时切换按o
-b, --batch #运行在非交互式的模式
-n NUM, --iter=NUM #在非交互式模式下,设置显示的次数,
-d SEC, --delay=SEC #设置显示的间隔秒数,支持非整数值
-p PID, --pid=PID #只显示指定PID的信息
-u USER, --user=USER #显示指定的用户的进程的信息
-P, --processes #只显示进程,一般为显示所有的线程
-a, --accumulated #显示从iotop启动后每个线程完成了的IO总数
-k, --kilobytes #以千字节显示
-t, --time #在每一行前添加一个当前的时间
-q, --quiet #suppress some lines of header (implies --batch). This option can be specified up to three times to remove header lines.
-q column names are only printed on the first iteration,
-qq column names are never printed,
-qqq the I/O summary is never printed.