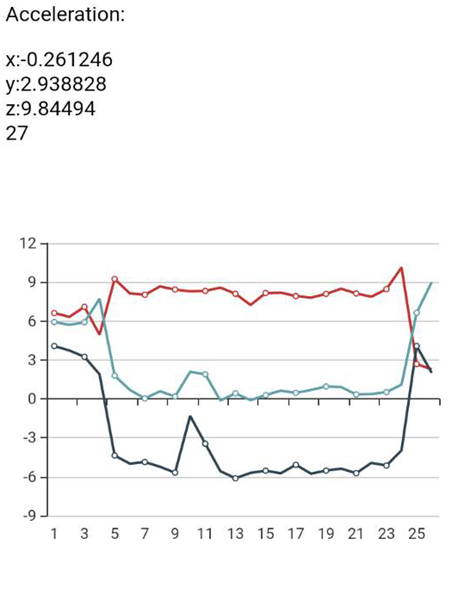
首先是x,y,z轴的加速度统计,利用四个数组记录,并长度为偶数时生成图表
var x=[];
var y=[];
var z=[];
var t=[];
document.addEventListener( "plusready", function(){
    // 扩展API加载完毕,现在可以正常调用扩展API
    var acc = document.getElementById("acc");
    plus.accelerometer.watchAcceleration( function ( a ) {

        x.push(a.xAxis);
        y.push(a.yAxis);
        z.push(a.zAxis);
        t.push(x.length);
        acc.innerText =  "x:" + a.xAxis + "
y:" + a.yAxis + "
z:" + a.zAxis+"
"+x.length;
        if(x.length%2==0){
            line();
        }
    }, function ( e ) {
        alert( "Acceleration error: " + e.message );
    }, {frequency:1000} ); // 设置更新间隔时间为1s
    }, false );
上面的全代码
<script type="text/javascript">
    var x=[];
    var y=[];
    var z=[];
    var t=[];
    var line = function(){
        var dom = document.getElementById("main");
        var myChart = echarts.init(dom);
        option = {

        tooltip: {
            trigger: 'item',
            formatter: '{a} <br/>{b} : {c}'
        },

        xAxis: {
            type: 'category',
            name: 'x',
            splitLine: {show: false},
            data: t
        },
        grid: {
            left: '3%',
            right: '4%',
            bottom: '3%',
            containLabel: true
        },
        yAxis: {


        },

        series: [
            {
                name: 'x',
                type: 'line',
                data: x
            },
            {
                name: 'y',
                type: 'line',
                data: y
            },
            {
                name: 'z',
                type: 'line',
                data: z
            }
        ]
    };
    myChart.setOption(option, true);
    };

    document.addEventListener( "plusready", function(){
    // 扩展API加载完毕,现在可以正常调用扩展API
    var acc = document.getElementById("acc");
    plus.accelerometer.watchAcceleration( function ( a ) {

        x.push(a.xAxis);
        y.push(a.yAxis);
        z.push(a.zAxis);
        t.push(x.length);
        acc.innerText =  "x:" + a.xAxis + "
y:" + a.yAxis + "
z:" + a.zAxis+"
"+x.length;
        if(x.length%2==0){
            line();
        }
    }, function ( e ) {
        alert( "Acceleration error: " + e.message );
    }, {frequency:1000} ); // 设置更新间隔时间为1s
    }, false );

    </script>
<head>
    <meta charset="utf-8"/>
    <meta name="viewport" content="initial-scale=1.0, maximum-scale=1.0, user-scalable=no"/>
    <title>Accelerometer Example</title>
    <script src="js/echarts.min.js"></script>
    </head>
    <body>
        Acceleration:<br/>
        <p id="acc"></p>
        <div id="main" style=" 350px;height:300px;"></div>
    </body>
    <script>
            document.addEventListener("plusready", function() {
                // 注册返回按键事件
                plus.key.addEventListener('backbutton', function() {
                    // 事件处理
                    window.history.back();
                }, false);
            });
    </script>