(1)What is Sentence Centrality and Centroid-based Summarization ?
Extractive summarization works by choosing a subset of the sentences in the original documents. This process can be viewed as identifying the most central sentences in a (multi-document) cluster that give the necessary and sufficient amount of information related to the main theme of the cluster.
The centroid of a cluster is a pseudo-document which consists of words that have tf×idf scores above a predefined threshold, where tf is the frequency of a word in the cluster, and idf values are typically computed over a much larger and similar genre data set.
In centroid-based summarization (Radev, Jing, & Budzikowska, 2000), the sentences that contain more words from the centroid of the cluster are considered as central. This is a measure of how close the sentence is to the centroid of the cluster.
(2)Centrality-based Sentence Salience:
All of our approaches are based on the concept of prestige in social networks. A social network is a mapping of relationships between interacting entities (e.g. people, organizations, computers). Social networks are represented as graphs, where the nodes represent the entities and the links represent the relations between the nodes.
A cluster of documents can be viewed as a network of sentences that are related to each other. We hypothesize that the sentences that are similar to many of the other sentences in a cluster are more central (or salient) to the topic.
There are two points to clarify in this definition of centrality:
1.How to define similarity between two sentences.
2.How to compute the overall centrality of a sentence given its similarity to other sentences.
To define similarity, we use the bag-of-words model to represent each sentence as an N-dimensional vector, where N is the number of all possible words in the target language. For each word that occurs in a sentence, the value of the corresponding dimension in the vector representation of the sentence is the number of occurrences of the word in the sentence times the idf of the word. The similarity between two sentences is then defined by the cosine between two corresponding vectors:

A cluster of documents may be represented by a cosine similarity matrix where each entry in the matrix is the similarity between the corresponding sentence pair.
Figure 1 shows a subset of a cluster used in DUC 2004, and the corresponding cosine similarity matrix. Sentence ID dXsY indicates the Y th sentence in the Xth document.
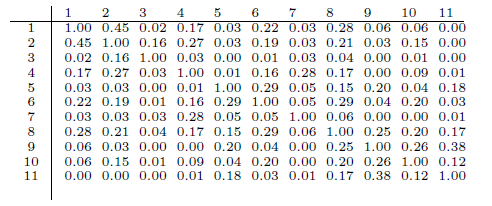
Figure 1: Intra-sentence cosine similarities in a subset of cluster d1003t from DUC 2004.
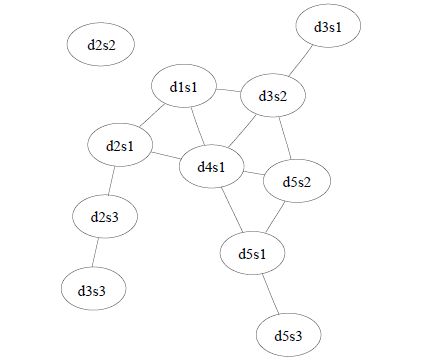
This matrix can also be represented as a weighted graph where each edge shows the cosine similarity between a pair of sentence (Figure 2).

Figure 2: Weighted cosine similarity graph for the cluster in Figure 1.
(3)Degree Centrality:
Since we are interested in significant similarities, we can eliminate some low values in this matrix by defining a threshold so that the cluster can be viewed as an (undirected) graph.
Figure 3 shows the graphs that correspond to the adjacency matrices derived by assuming the pair of sentences that have a similarity above 0.1, 0.2, and 0.3, respectively, in Figure 1 are similar to each other. Note that there should also be self links for all of the nodes in the graphs since every sentence is trivially similar to itself. Although we omit the self links for readability, the arguments in the following sections assume that they exist.

-----------------------------------------------------------------------
-----------------------------------------------------------------------

Figure 3: Similarity graphs that correspond to thresholds 0.1, 0.2, and 0.3, respectively, for the cluster in Figure 1.
A simple way of assessing sentence centrality by looking at the graphs in Figure 3 is to count the number of similar sentences for each sentence. We define degree centrality of a sentence as the degree of the corresponding node in the similarity graph. As seen in Table 1, the choice of cosine threshold dramatically influences the interpretation of centrality. Too low thresholds may mistakenly take weak similarities into consideration while too high thresholds may lose many of the similarity relations in a cluster.

Table 1: Degree centrality scores for the graphs in Figure 3. Sentence d4s1 is the most central sentence for thresholds 0.1 and 0.2.