zoukankan      html  css  js  c++  java
  • echarts 自定义进度条图标

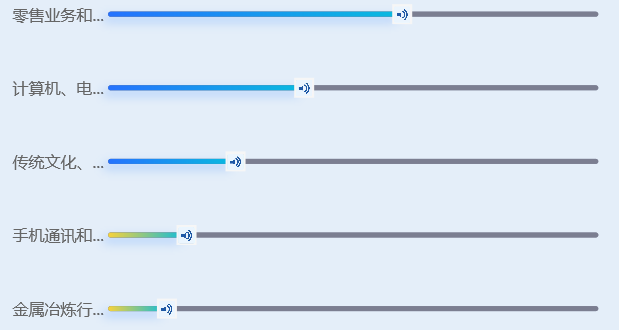
    option = {
        backgroundColor:"#e4eef9",
        grid:{
          top:"3%",
          right:"6%",
          left:"18%",
          bottom:"20%",
        },
        xAxis: {
            show:false,
        },
        yAxis: {
            type: 'category',
            axisLine:{show:false},  //去除y轴线
            axisTick:{show:false},  // 去除刻度
            axisLabel:{   //坐标轴文字设置
                color:"#333",
                fontSize:14,
                margin:4,
                180,
                formatter:function(val){
                    return val.length >5? "{b|"+val.substr(0,5)+"..."+"}" : "{a|"+val+"}";
                },
                rich:{
                    a:{
                        color:"#333",
                        fontSize:16,
                        180,
                        align:"center",
                        padding:[0,0,0,40]
                    },
                    b:{
                        color:"#666",
                        fontSize:16,
                        160,
                        align:"right",
                        padding:[0,0,0,12]
                    },
                }
            },
            data:["零售业务和批发","计算机、电信行业","传统文化、教育","手机通讯和电子设备","金属冶炼行业"],
            inverse:true
        },
        series: [
            {
                type: 'bar',
                barWidth:"5", //柱状图宽度
                showBackground: true, //显示背景颜色
                backgroundStyle: {
                    color: 'rgba(220, 220, 220, 0.5)',
                    barBorderRadius:[10,10,10,10],
                },
                data: [60, 40,26, 16, 12],
                label:{ //显示在文本上的字
                    show:true,
                    position:"insideRight",
                    distance:10,
                    align:"left",
                    formatter:function(params){
                        return "{img|}"
                    },
                    rich:{
                        img:{
                            backgroundColor:{
                                // image:"图片链接/路径"
                                image:"https://dss1.bdstatic.com/70cFvXSh_Q1YnxGkpoWK1HF6hhy/it/u=3762380421,1758877886&fm=26&gp=0.jpg"
                            },
                            20,
                            height:20,
                            padding:[0,0,0,0]
                        }
                    }
                },
                itemStyle:{
                    normal:{
                        // 每个数据的颜色
                        color:function(params){
                            if(params.dataIndex <=2){
                                return new echarts.graphic.LinearGradient(
                                    0, 0, 1, 0,
                                    [
                                        {offset: 0, color: '#2572fe'},
                                        {offset: 1, color: '#09bbdf'}
                                    ]
                                )
                            }else{
                                 return new echarts.graphic.LinearGradient(
                                    0, 0, 1, 0,
                                    [
                                        {offset: 0, color: '#f7d23b'},
                                        {offset: 1, color: '#09bbdf'}
                                    ]
                                )
                                
                            }
                        },
                        barBorderRadius:[30,30,30,30], //圆角大小
                        shadowBlur:10, //模糊程度
                        shadowColor:"rgba(0,103,255,0.3)", //颜色
                        shadowOffsetX:-5,
                        shadowOffsetY:5,
                    },
                },
                z:2,
                animation:true,
                animationEasing:"cubicOut",
                animationDuration:function(){
                    return 3000;
                }
            },
            {
                name:"",
                type:"bar",
                barWidth:"5",
                barCategoryGap:"30%",
                slient:true,
                barGap:"-100%",
                itemStyle:{
                    normal:{
                        barBorderRadius:7,
                        color:"#1b2046"
                    }
                },
                label:{
                    show:true,
                    position:["100%,0%"],
                    offset:[10,0],
                    fontSize:22,
                    formatter:function(params){
                        return params.data+"%"
                    },
                    rich:{
                        a:{
                            fontSize:30,
                            color:"#20c5b1",
                            fontWeight:"bold",
                        },
                        b:{
                            fontSize:30,
                            color:"#9497a0"
                            
                        },
                    }
                },
                z:1,
                data: [100, 100,100, 100, 100]
            }
        ]
    };
  • 相关阅读:
    (原创)攻击方式学习之(4) 拒绝服务(DOS/DDOS/DRDOS)
    gdb调试程序
    找找看XSS漏洞!!!
    C++实现发送HTTP请求
    Python天天美味(32) python数据结构与算法之堆排序
    (原创)攻击方式学习之(3) 缓冲区溢出(Buffer Overflow)
    Python天天美味(30) python数据结构与算法之快速排序
    CoderZh首款Python联机对战游戏 NancyTetris1.0倾情发布(一)
    ASCII表查看
    wxpython学习笔记
  • 原文地址:https://www.cnblogs.com/yunyin/p/13918088.html
Copyright © 2011-2022 走看看