zoukankan      html  css  js  c++  java
  • echarts仪表盘

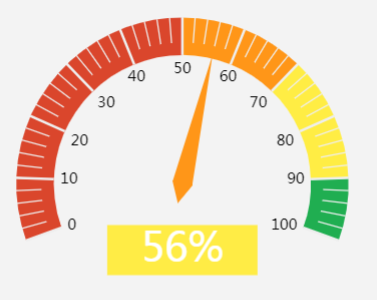
    option = {
             series: [
                 {
                     type: "gauge",
                     center: ["50%", "45%"], // 仪表位置
                     radius: "80%", //仪表大小
                     startAngle: 200, //开始角度
                     endAngle: -20, //结束角度
                     axisLine: {
                         show: false,
                         lineStyle: { // 属性lineStyle控制线条样式
                             color: [
                                 [ 0.5,  new echarts.graphic.LinearGradient(0, 0, 1, 0, [{
                                     offset: 1,
                                     color: "#E75F25" // 50% 处的颜色
                                 }, {
                                     offset: 0.8,
                                     color: "#D9452C" // 40% 处的颜色
                                 }], false) ], // 100% 处的颜色
                                  [ 0.7,  new echarts.graphic.LinearGradient(0, 0, 1, 0, [{
                                     offset: 1,
                                     color: "#FFC539" // 70% 处的颜色
                                 }, {
                                     offset: 0.8,
                                     color: "#FE951E" // 66% 处的颜色
                                 }, {
                                     offset: 0,
                                     color: "#E75F25" // 50% 处的颜色
                                 }], false) ],
                                  [ 0.9,  new echarts.graphic.LinearGradient(0, 0, 0, 1, [{
                                     offset: 1,
                                     color: "#C7DD6B" // 90% 处的颜色
                                 }, {
                                     offset: 0.8,
                                     color: "#FEEC49" // 86% 处的颜色
                                 }, {
                                     offset: 0,
                                     color: "#FFC539" // 70% 处的颜色
                                 }], false) ],
                                 [1,  new echarts.graphic.LinearGradient(0, 0, 0, 1, [ {
                                     offset: 0.2,
                                     color: "#1CAD52" // 92% 处的颜色
                                 }, {
                                     offset: 0,
                                     color: "#C7DD6B" // 90% 处的颜色
                                 }], false) ]
                             ],
                              10
                         }
                     },
                     splitLine: { 
                         show: false
                     },
                     axisTick: {
                         show: false
                     },
                     axisLabel: {
                         show: false
                     },
                     pointer : { //指针样式
                         length: '45%'
                     },
                     detail: {
                         show: false
                     }
                 },
                 {
                     type : "gauge",
                     center: ["50%", "45%"], // 默认全局居中
                     radius : "70%",
                     startAngle: 200,
                     endAngle: -20,
                     axisLine : {
                         show : true,
                         lineStyle : { // 属性lineStyle控制线条样式
                             color : [ //表盘颜色
                                 [ 0.5, "#DA462C" ],//0-50%处的颜色
                                 [ 0.7, "#FF9618" ],//51%-70%处的颜色
                                 [ 0.9, "#FFED44" ],//70%-90%处的颜色
                                 [ 1,"#20AE51" ]//90%-100%处的颜色
                             ],
                             width : 30//表盘宽度
                         }
                     },
                     splitLine : { //分割线样式(及10、20等长线样式)
                         length : 30,
                         lineStyle : { // 属性lineStyle控制线条样式
                             width : 2
                         }
                     },
                     axisTick : { //刻度线样式(及短线样式)
                          length : 20
                     },
                     axisLabel : { //文字样式(及“10”、“20”等文字样式)
                         color : "black",
                         distance : 5 //文字离表盘的距离
                     },
                     detail: {
                         formatter : "{score|{value}%}",
                         offsetCenter: [0, "40%"],
                         backgroundColor: '#FFEC45',
                         height:30,
                         rich : {
                             score : {
                                 color : "white",
                                 fontFamily : "微软雅黑",
                                 fontSize : 32
                             }
                         }
                     },
                     data: [{
                         value: 56,
                         label: {
                             textStyle: {
                                 fontSize: 12
                             }
                         }
                     }]
                 }
             ]
         };
  • 相关阅读:
    二、Elasticsearch核心配置文件详解
    javax.mail.AuthenticationFailedException: 535 authentication failed
    Java compiler level does not match the version of the installed java project facet
    一、设置cookie报非法参数异常
    slf4j的使用规范
    基于token的身份验证JWT
    单点登录
    spring的bean不能注入原因分析
    规避空指针异常规范
    Git远程操作详解
  • 原文地址:https://www.cnblogs.com/yunyin/p/14232320.html
Copyright © 2011-2022 走看看