ELKStack之生产案例(下)
链接:https://pan.baidu.com/s/1V2aYpB86ZzxL21Hf-AF1rA
提取码:7izv
复制这段内容后打开百度网盘手机App,操作更方便哦
4. 引入Redis
4.1 实验环境说明
| 主机名 | 主机IP | 用途 |
|---|---|---|
| ES1 | 192.168.200.16 | elasticsearch-node1 |
| ES2 | 192.168.200.17 | elasticsearch-node2 |
| ES3 | 192.168.200.18 | elasticsearch-node3 |
| Logstash-Kibana | 192.168.200.19 | 日志可视化服务器 |
| Web-Server | 192.168.200.20 | 模拟各种待收集的日志客户端 |
4.2 在logstash-Kibana上安装部署redis
4.2.1 安装epel源
[root@logstash-kibana ~]# yum -y install epel-release
4.2.2 利用yum安装redis
[root@logstash-kibana ~]# yum -y install redis
[root@logstash-kibana ~]# redis-server --version
Redis server v=3.2.12 sha=00000000:0 malloc=jemalloc-3.6.0 bits=64 build=7897e7d0e13773f
4.2.3 修改redis配置文件
[root@logstash-kibana ~]# cp /etc/redis.conf{,.bak}

#修改前配置
[root@logstash-kibana ~]# cat -n /etc/redis.conf.bak | sed -n '61p;480p'
    61	bind 127.0.0.1
   480	# requirepass foobared

#修改后配置
[root@logstash-kibana ~]# cat -n /etc/redis.conf | sed -n '61p;480p'
    61	bind 0.0.0.0
   480	requirepass yunwei
4.2.4 启动redis-server
[root@logstash-kibana ~]# systemctl start redis
[root@logstash-kibana ~]# netstat -antup | grep redis
tcp        0      0 0.0.0.0:6379            0.0.0.0:*               LISTEN      8391/redis-server 0
4.3 在Web服务器上安装logstash
4.3.1 yum安装jdk1.8
[root@web-server ~]# yum -y install java-1.8.0-openjdk
4.3.2 添加ELK的yum源文件
[root@web-server ~]# vim /etc/yum.repos.d/elastic.repo
[root@web-server ~]# cat /etc/yum.repos.d/elastic.repo
[elastic-6.x]

name=Elastic repository for 6.x packages
baseurl=https://artifacts.elastic.co/packages/6.x/yum
gpgcheck=1
gpgkey=https://artifacts.elastic.co/GPG-KEY-elasticsearch
enabled=1
autorefresh=1
type=rpm-md
4.3.3 yum安装logstash和filebeat
[root@web-server ~]# yum -y install logstash filebeat
4.3.4 创建收集数据写入redis的logstash配置文件
[root@web-server ~]# vim /etc/logstash/conf.d/logstash-to-redis.conf
[root@web-server ~]# cat /etc/logstash/conf.d/logstash-to-redis.conf
input {
   file {
       path => ["/var/log/messages"]
       type => "system"
       tags => ["syslog","test"]
       start_position => "beginning"
    }
    file {
        path => ["/var/log/audit/audit.log"]
        type => "system"
        tags => ["auth","test"]
        start_position => "beginning"
    }
}
filter {
}
output {
   redis {
      host => ["192.168.200.19:6379"]
      password => "yunwei"
      db => "0"
      data_type => "list"
      key => "logstash"
    }
}
4.3.5 启动WebServer服务器上的logstash
[root@web-server ~]# /usr/share/logstash/bin/logstash -f /etc/logstash/conf.d/logstash-to-redis.conf
#以下省略若干。。。
4.3.6 验证logstash是否成功将数据写入redis
[root@logstash-kibana ~]# redis-cli -a yunwei info Keyspace
# Keyspace
db0:keys=1,expires=0,avg_ttl=0

[root@logstash-kibana ~]# redis-cli -a yunwei scan 0
1) "0"
2) 1) "logstash"

[root@logstash-kibana ~]# redis-cli -a yunwei lrange logstash 0 1
1) "{"type":"system","path":"/var/log/messages","@version":"1","message":"May  3 19:33:21 ywb journal: Runtime journal is using 6.0M (max allowed 48.7M, trying to leave 73.0M free of 481.1M available xe2x86x92 current limit 48.7M).","@timestamp":"2019-09-11T16:34:10.575Z","tags":["syslog","test"],"host":"web-server"}"
2) "{"type":"system","path":"/var/log/audit/audit.log","@version":"1","message":"type=DAEMON_START msg=audit(1556883204.910:7254): op=start ver=2.8.1 format=raw kernel=3.10.0-862.el7.x86_64 auid=4294967295 pid=632 uid=0 ses=4294967295 subj=system_u:system_r:auditd_t:s0 res=success","@timestamp":"2019-09-11T16:34:10.577Z","tags":["auth","test"],"host":"web-server"}"

[root@logstash-kibana ~]# redis-cli -a yunwei llen logstash
(integer) 26078
4.4 在logstash-kibana服务器上配置读取redis数据的logstash配置文件
#在Logstash-Kibana进行如下操作
[root@logstash-kibana ~]# vim /etc/logstash/conf.d/logstash-from-redis.conf
[root@logstash-kibana ~]# cat /etc/logstash/conf.d/logstash-from-redis.conf
input {
   redis {
      host => "192.168.200.19"
      port => 6379
      password => "yunwei"
      db => "0"
      data_type => "list"
      key => "logstash"
   }
}
filter {
}
output {
   if [type] == "system" {
        if [tags][0] == "syslog" {
              elasticsearch {
                     hosts => ["http://192.168.200.16:9200","http://192.168.200.17:9200","http://192.168.200.18:9200"]
                     index => "logstash-mr_yang-syslog-%{+YYYY.MM.dd}"
              }
              stdout { codec => rubydebug }
        }
        else if [tags][0] == "auth" {
               elasticsearch {
                     hosts => ["http://192.168.200.16:9200","http://192.168.200.17:9200","http://192.168.200.18:9200"]
                     index => "logstash-mr_yang-auth-%{+YYYY.MM.dd}"
              }
              stdout { codec => rubydebug }
          }
     }
}
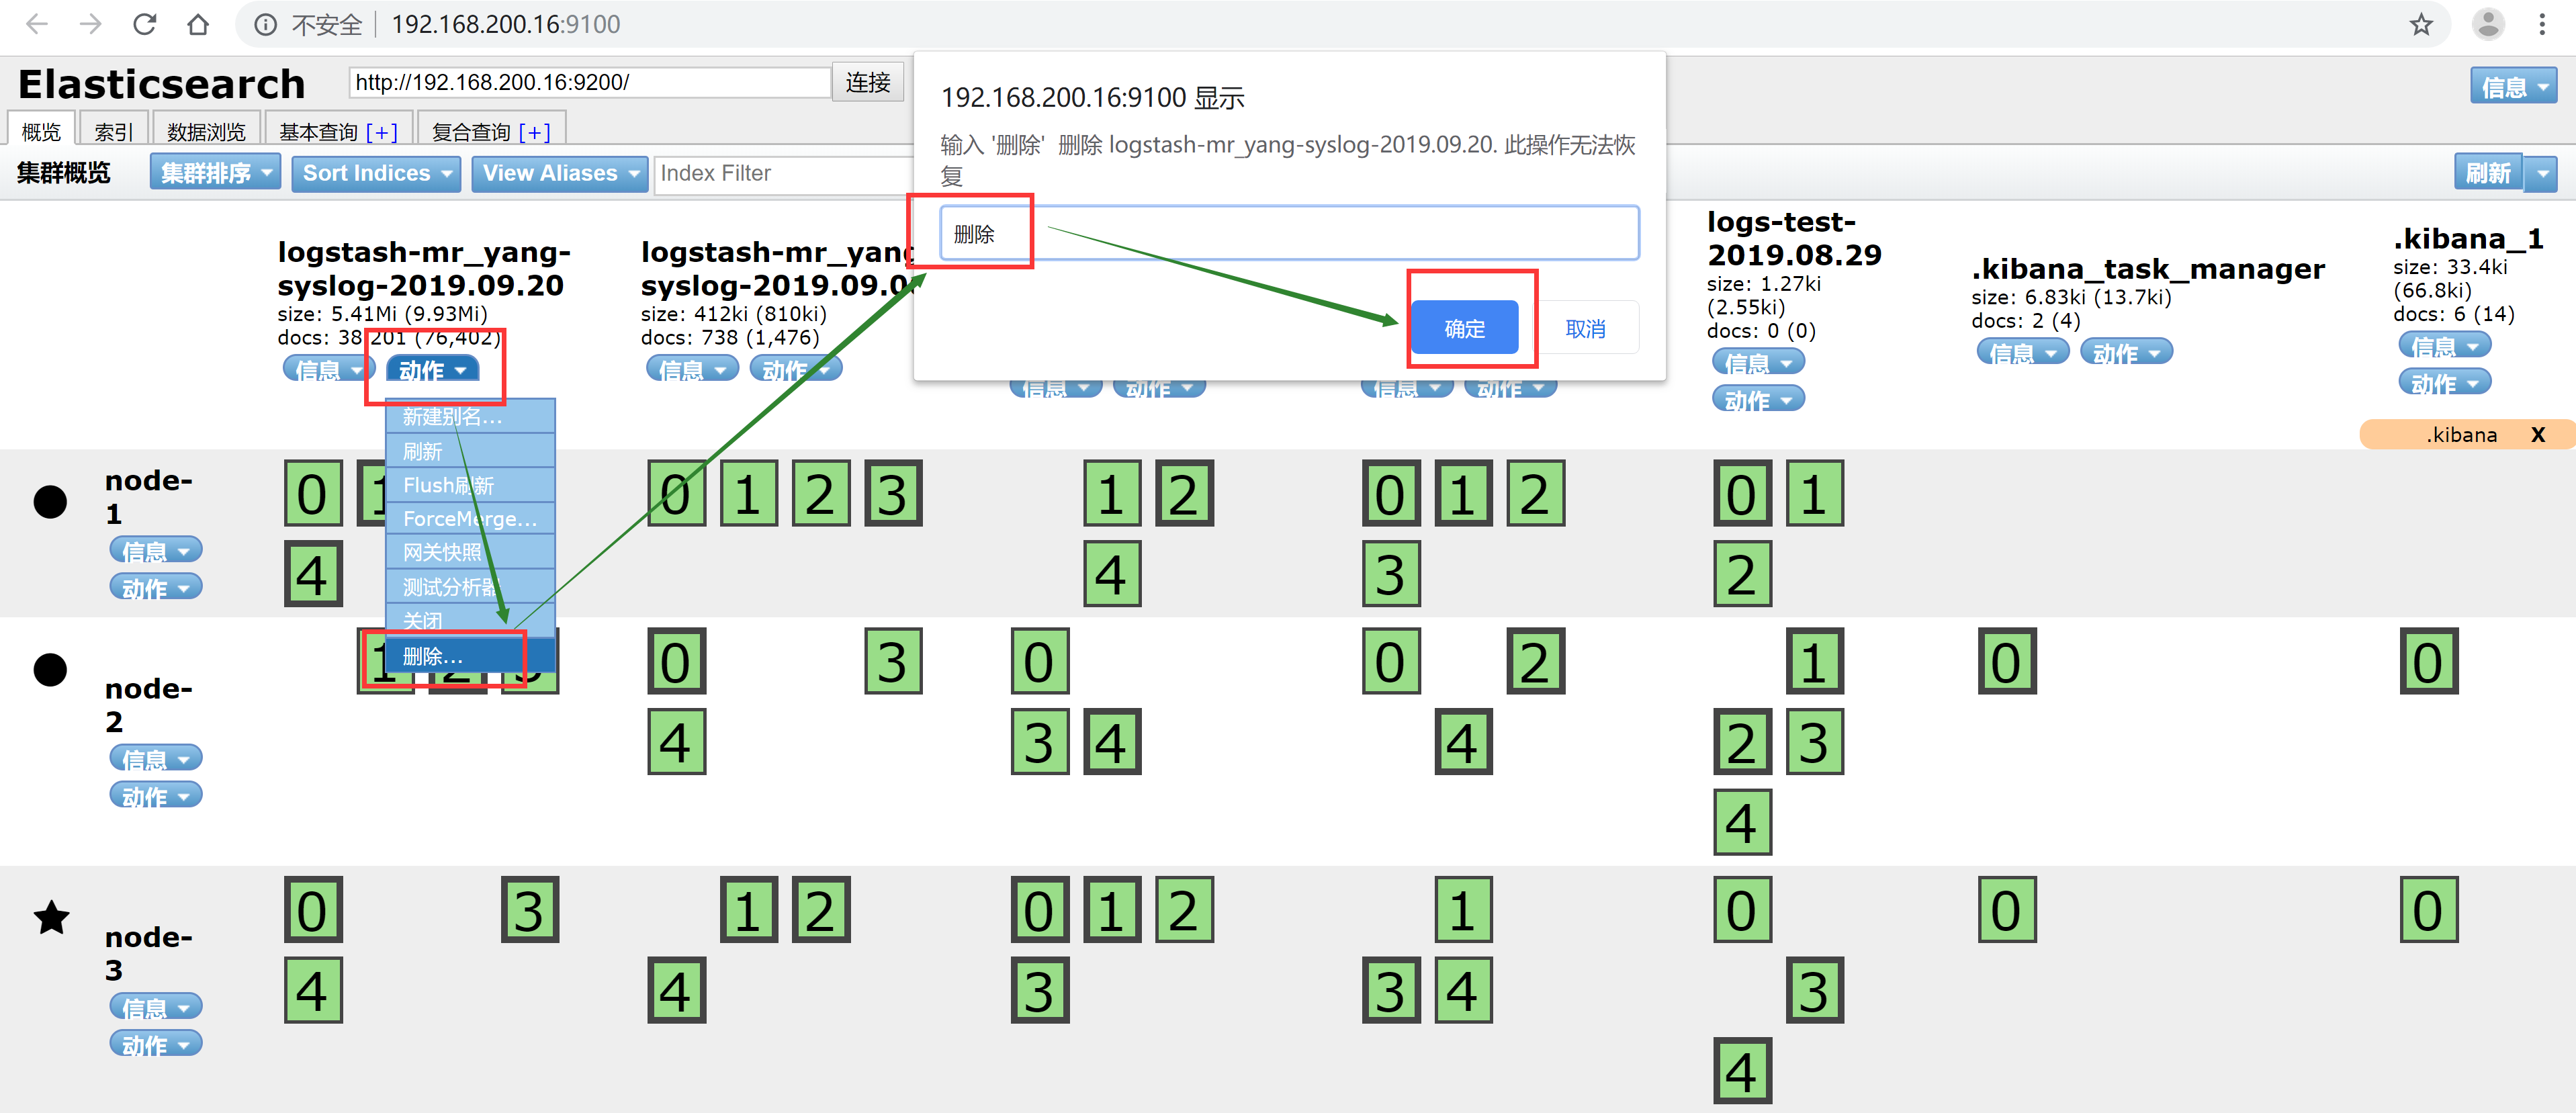
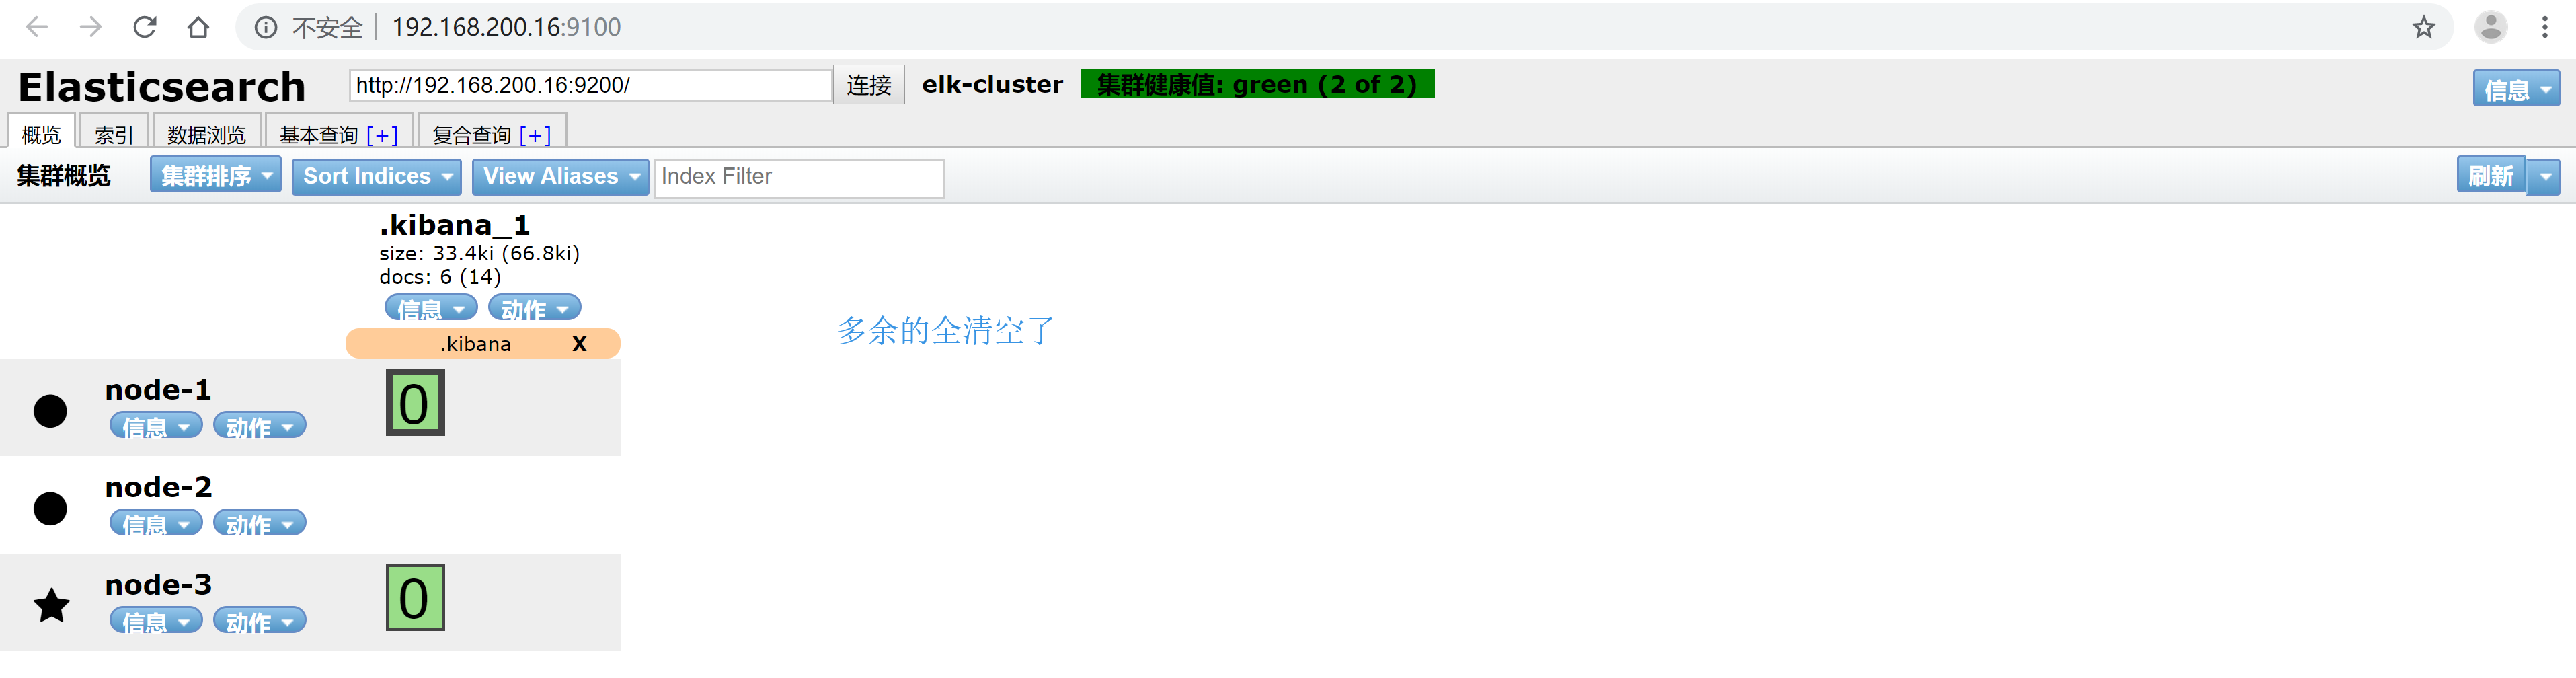
4.5 在ES1上启动图形化ES插件,清空ES上所有的索引
[root@ES1 ~]# cd elasticsearch-head/
[root@ES1 elasticsearch-head]# npm run start

> elasticsearch-head@0.0.0 start /root/elasticsearch-head
> grunt server

Running "connect:server" (connect) task
Waiting forever...
Started connect web server on http://localhost:9100
4.6 在logstash-kibana服务器上启动logstash,并查看kibana
#启动logstash
[root@logstash-kibana ~]# /usr/share/logstash/bin/logstash -f /etc/logstash/conf.d/logstash-from-redis.conf

#查看redis的key情况
[root@logstash-kibana ~]# redis-cli -a yunwei info Keyspace
# Keyspace
[root@logstash-kibana ~]# redis-cli -a yunwei llen logstash
(integer) 0


#备注:
#我们神奇的发现redis里的key已经全部都没有了
#这是因为redis在这里充当的是一个轻量级消息队列
#写入redis的logstash是生产者模型
#读取redis的logstash是消费者模型
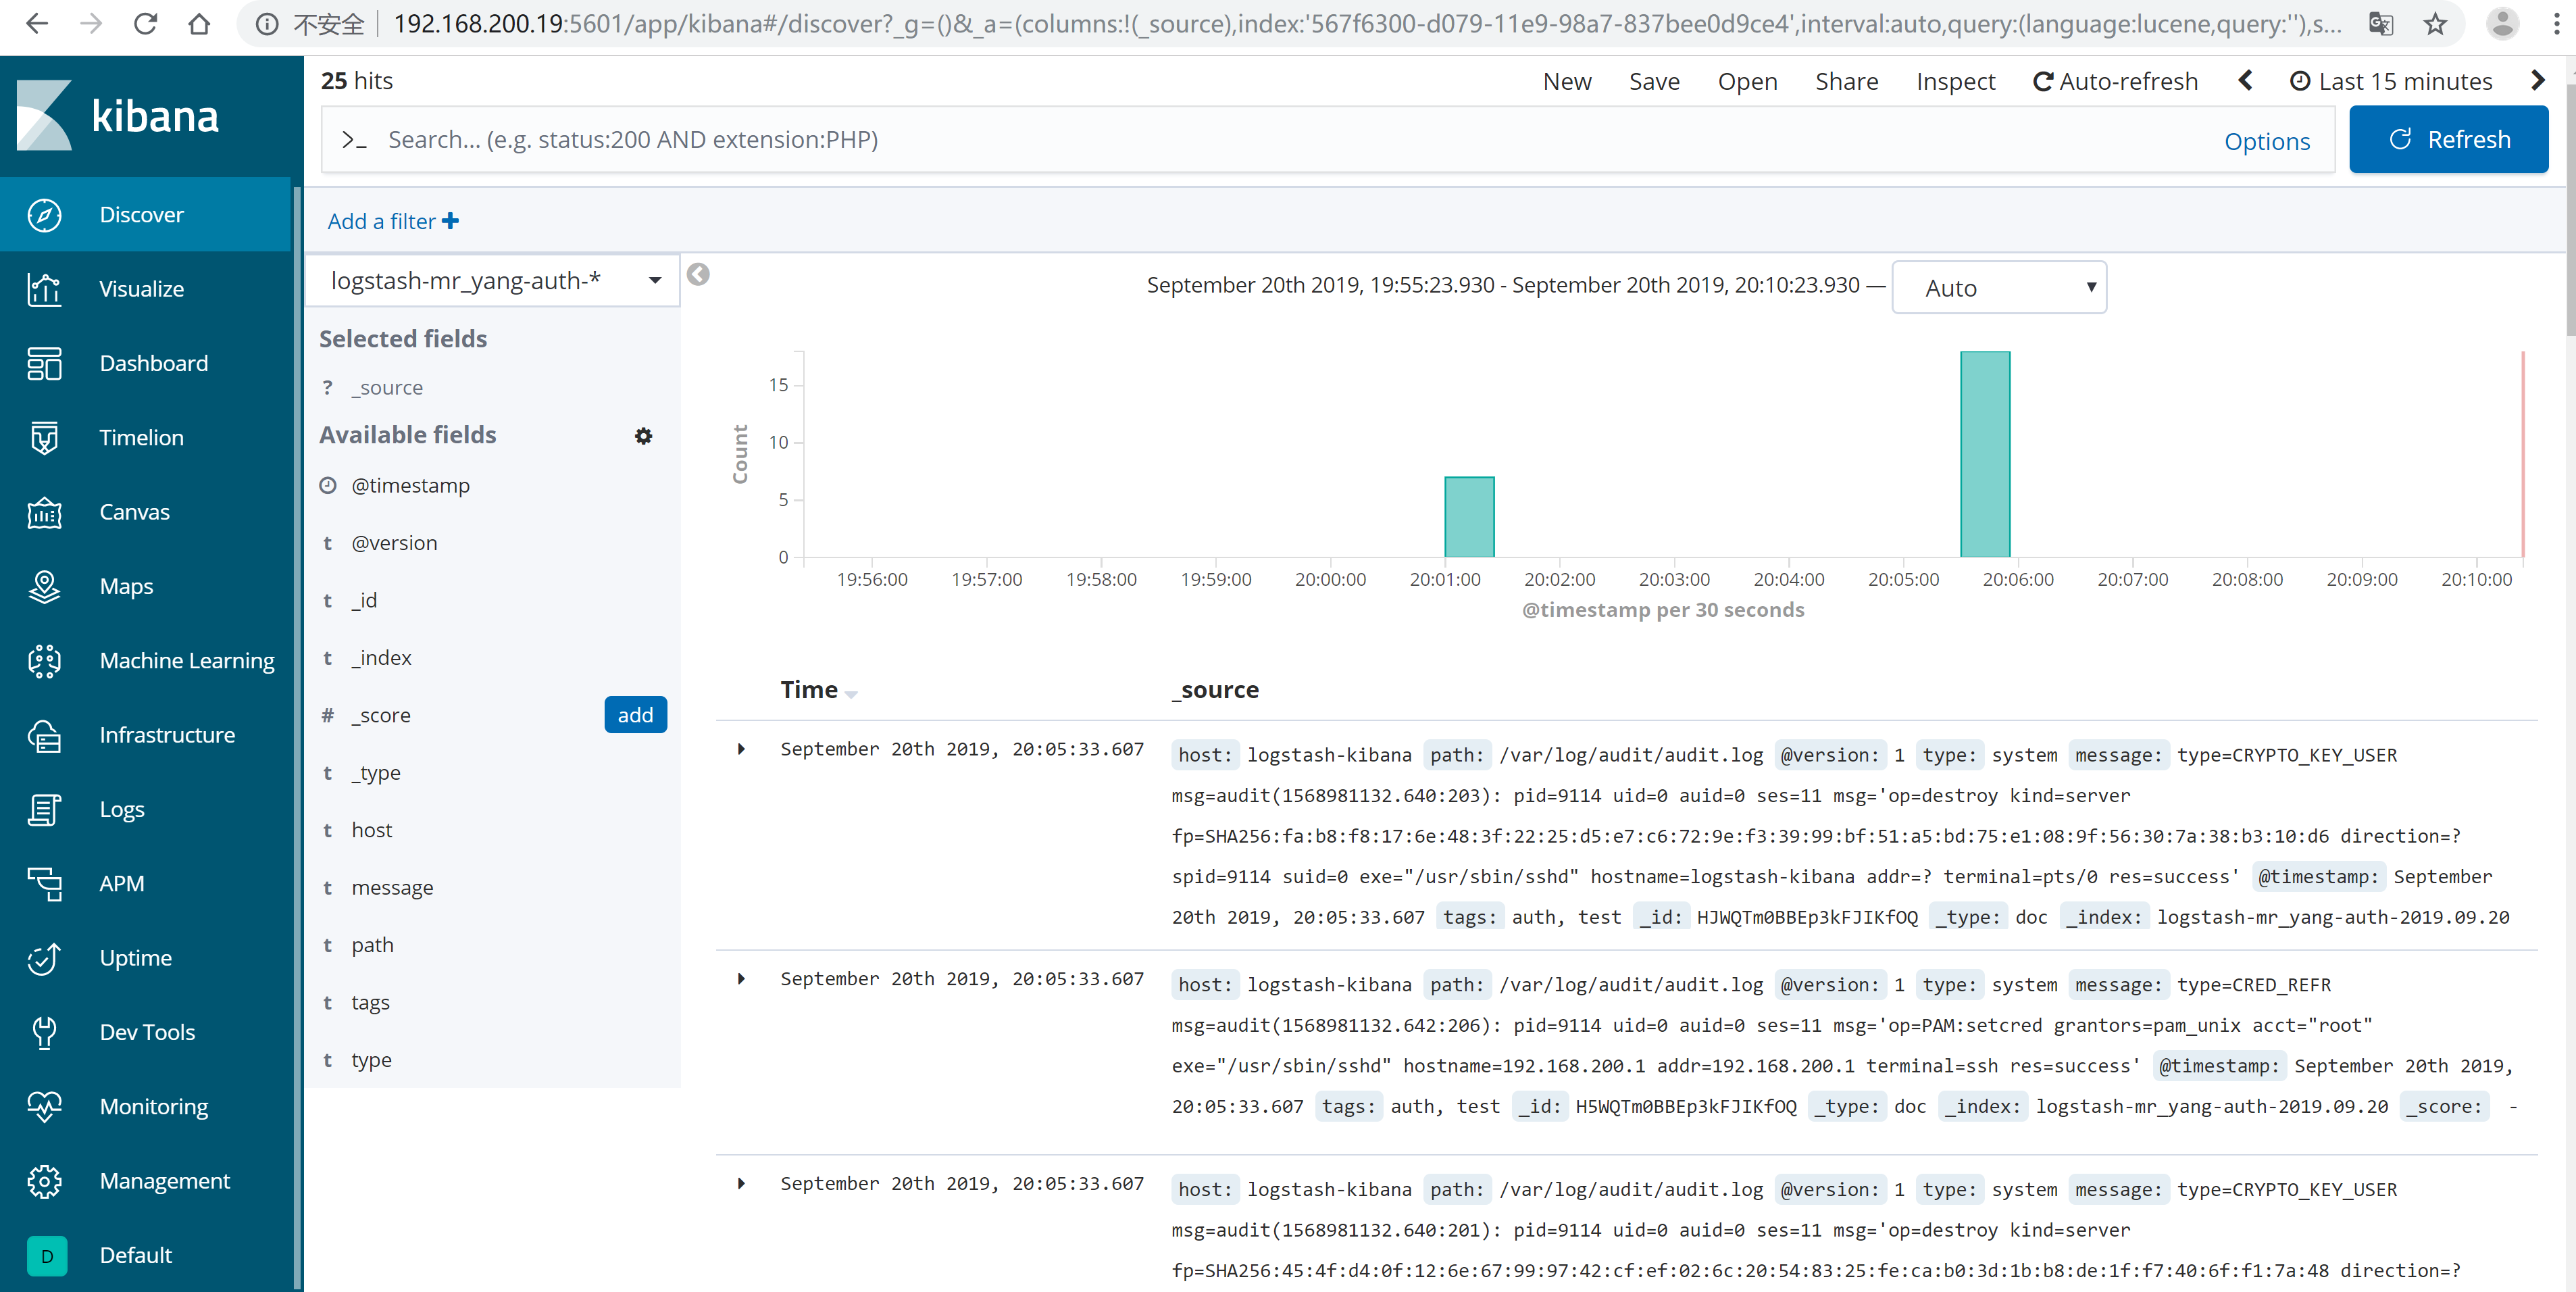
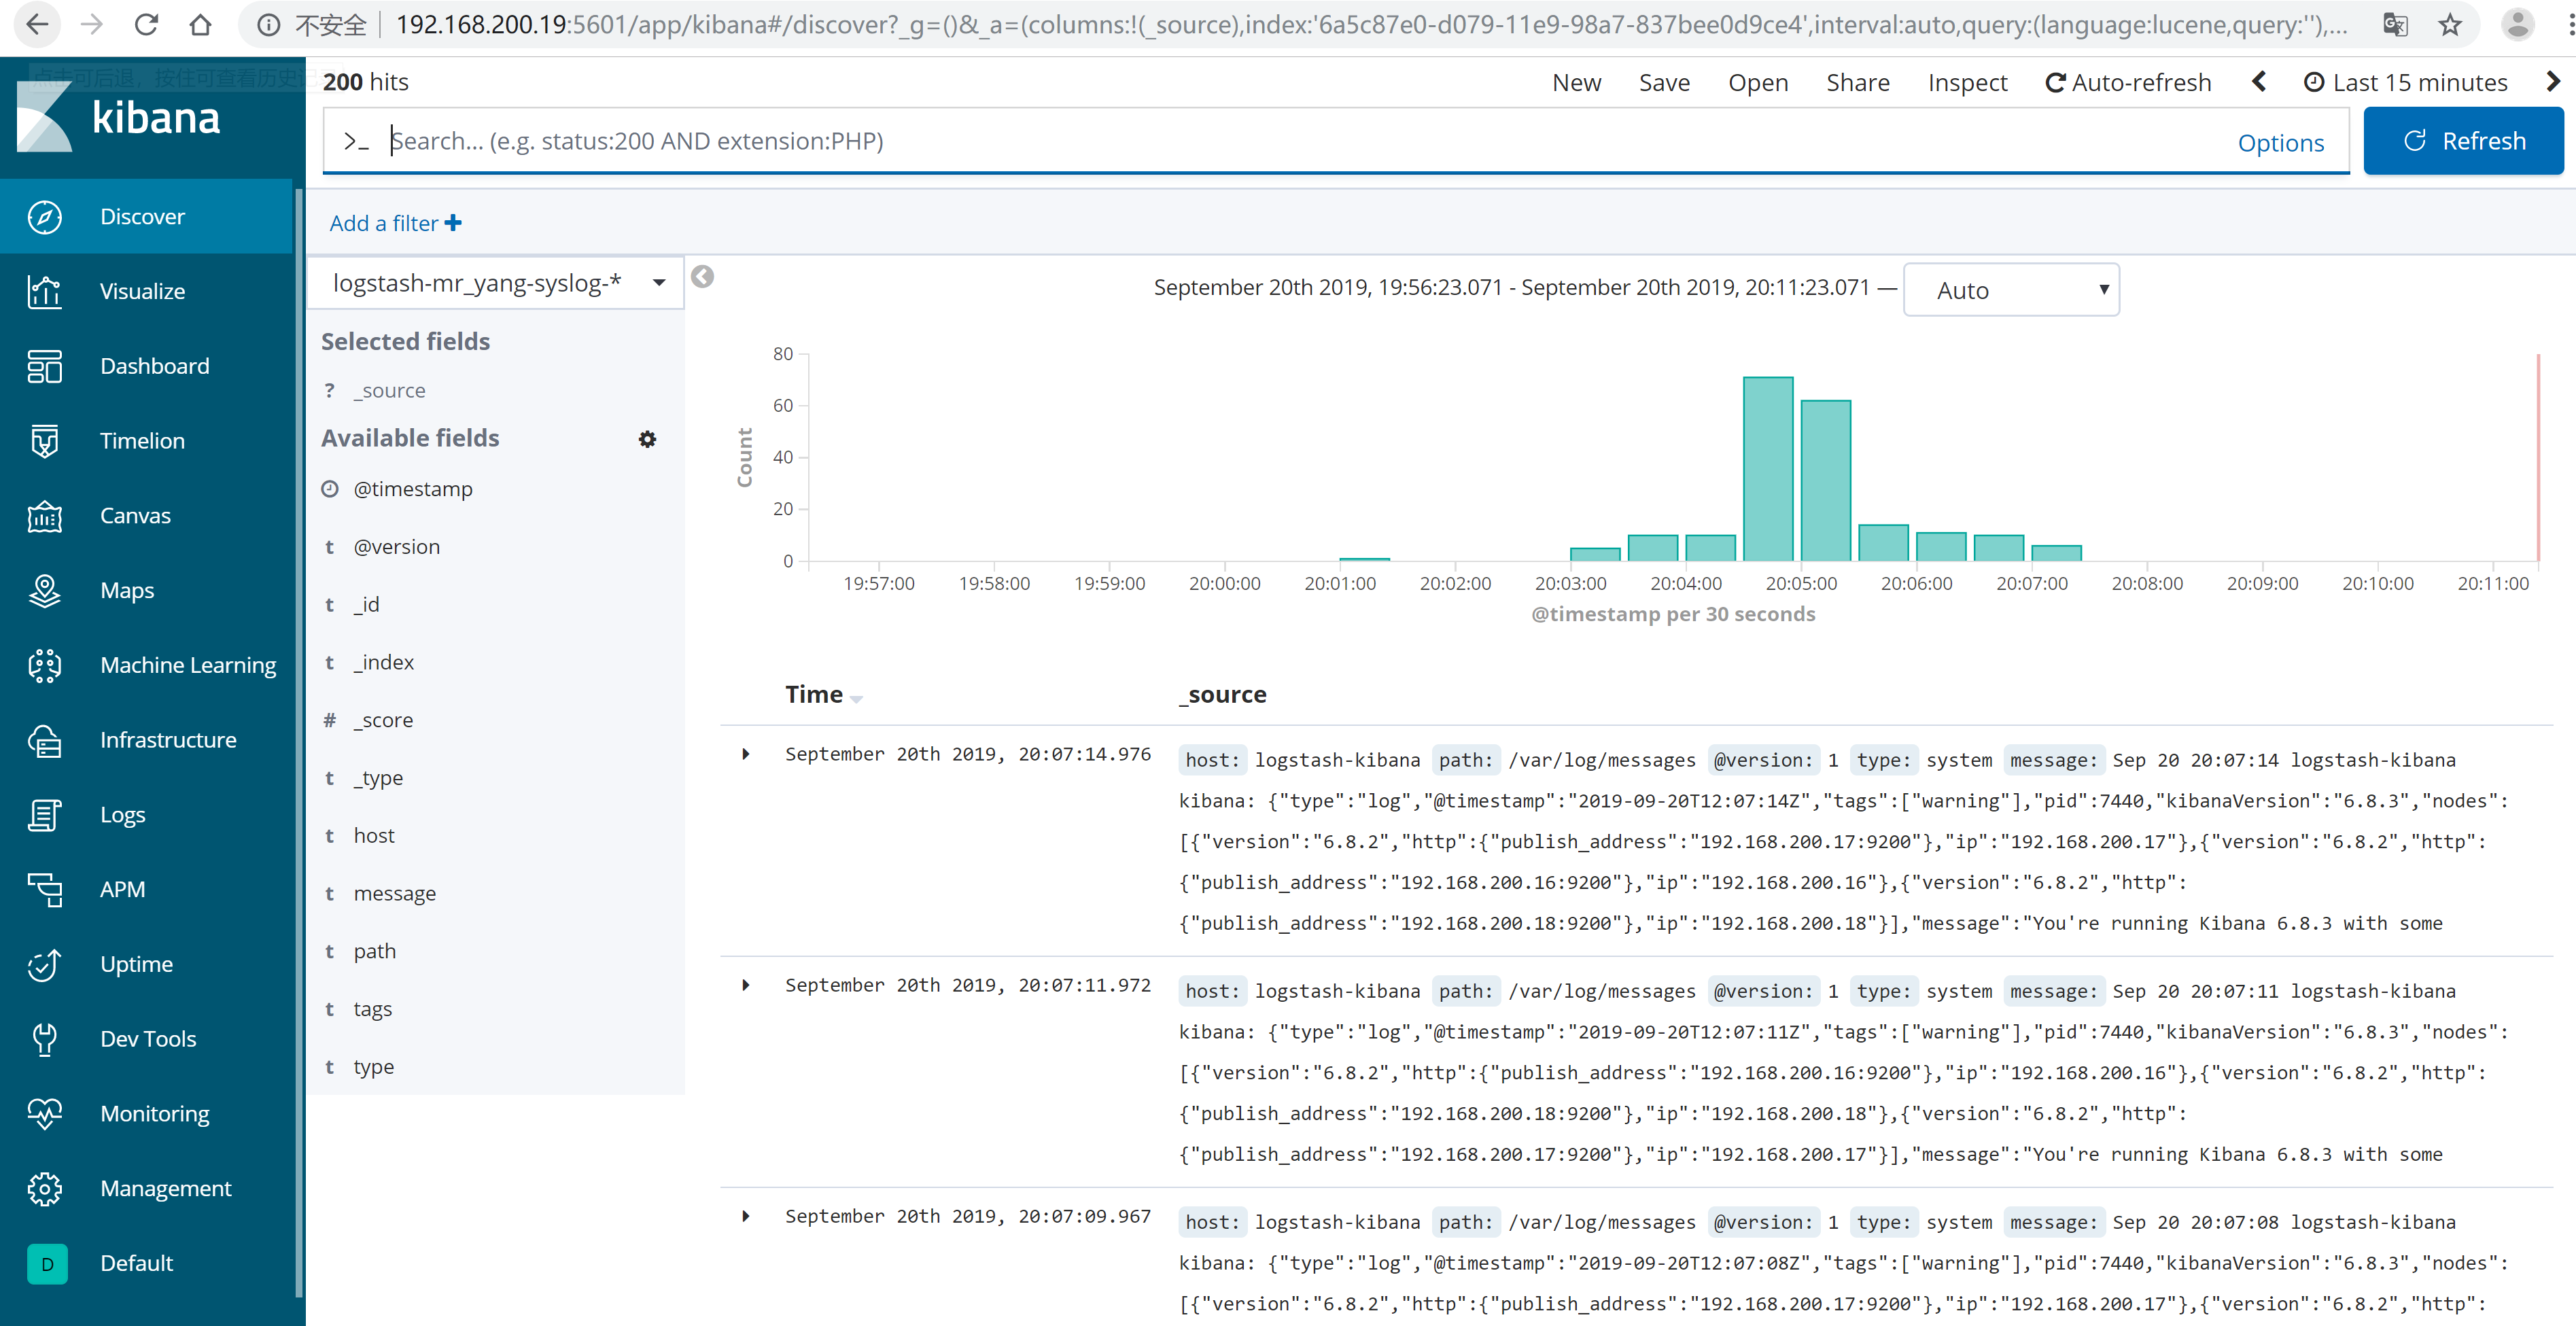
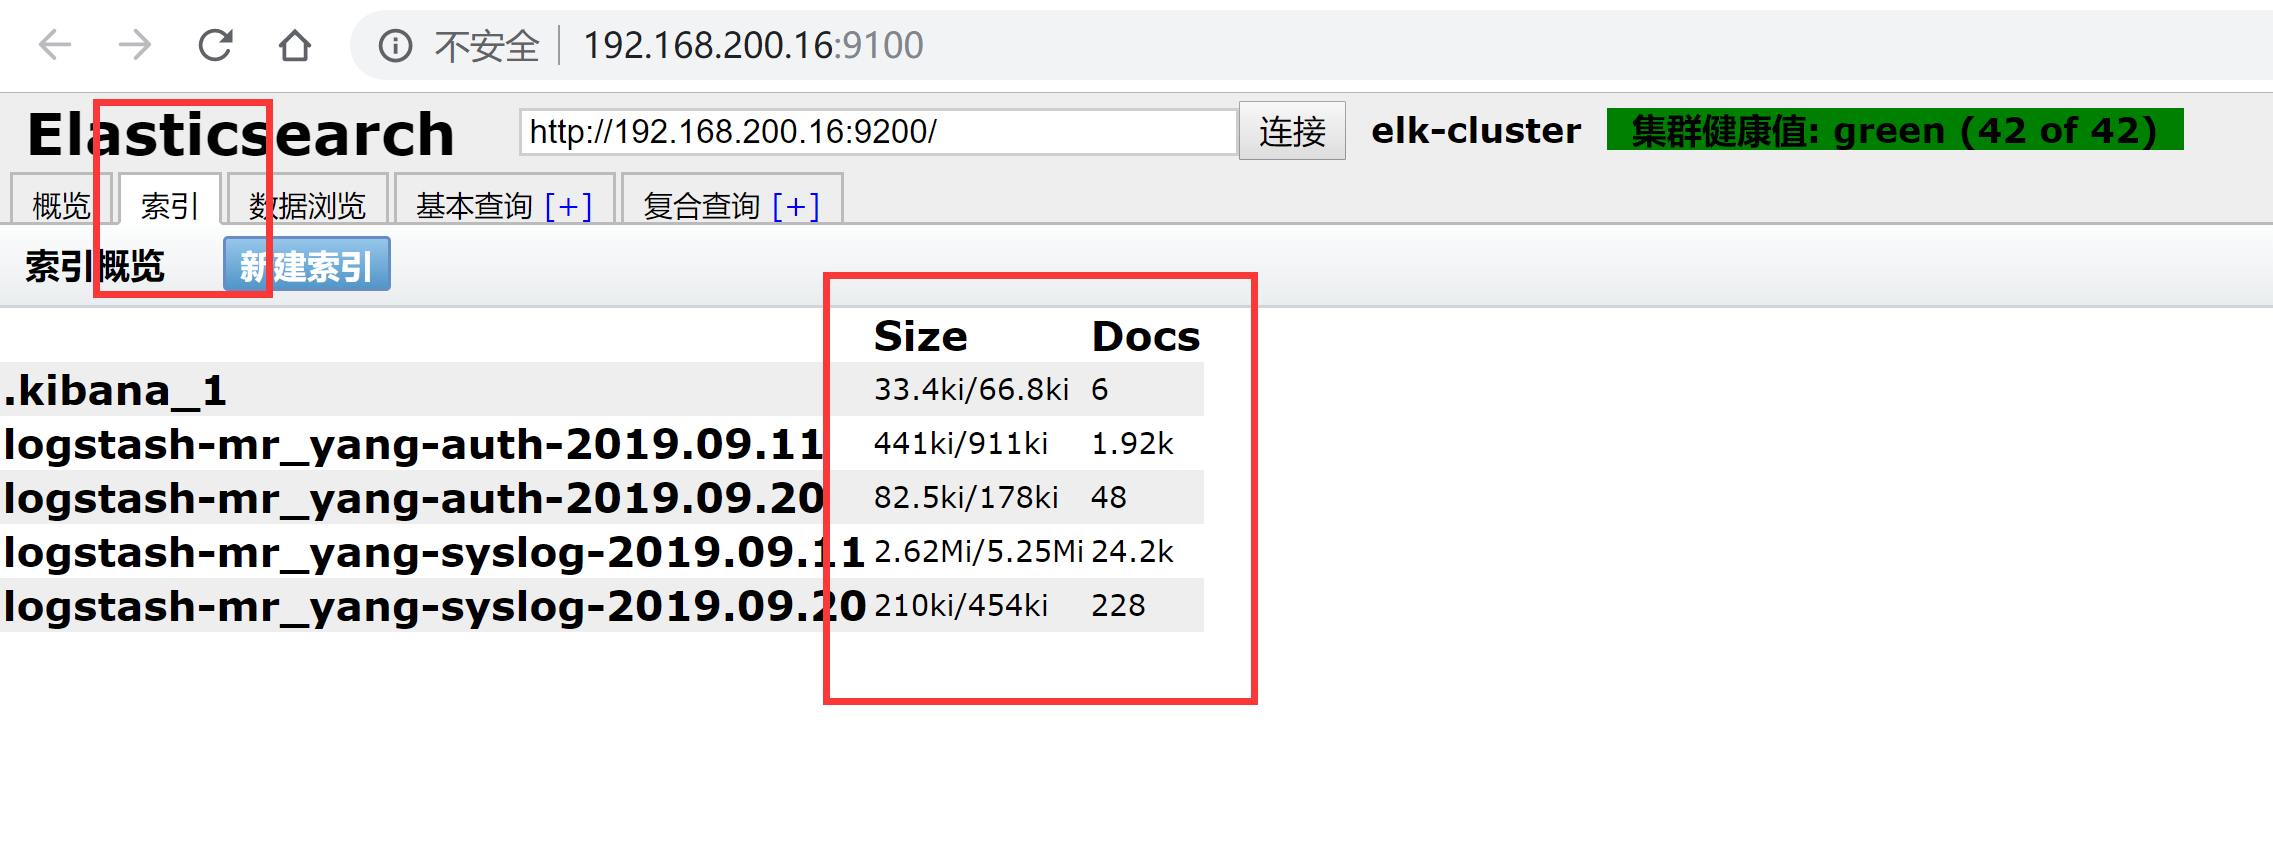
4.6.1 重新创建好索引后,如下图
4.6.2 查看elasticsearch里索引的数据大小
5. 引入Filebeat
- filebeat优点:轻量。缺点:不支持正则
- logstash优点:支持正则提取。缺点:比较重,依赖于java
5.1 在WebServer上yum安装filebeat
#安装filebeat
[root@web-server ~]# yum -y install filebeat

#修改filebeat配置文件
[root@web-server ~]# cp /etc/filebeat/filebeat.yml{,.bak}
[root@web-server ~]# vim /etc/filebeat/filebeat.yml
[root@web-server filebeat]# cat /etc/filebeat/filebeat.yml
filebeat.inputs:
- type: log
  paths:
    - /var/log/messages
  tags: ["syslog","test"]
  fields:
    type: system
  fields_under_root: true
- type: log
  paths:
    - /var/log/audit/audit.log
  tags: ["auth","test"]
  fields:
    type: system
  fields_under_root: true
output.redis:
  hosts: ["192.168.200.19"]
  password: "yunwei"
  key: "filebeat"
  db: 0
  datatype: list
#启动filebeat进行数据收集测试
[root@web-server ~]# systemctl start filebeat

#查看logstash-kibana服务器中的redis是否有数据
[root@logstash-kibana ~]# redis-cli -a yunwei llen filebeat
(integer) 224
5.2 利用图形化软件清空ES中的索引,再开启logstash读取redis数据写入ES
#修改logstash配置文件
[root@logstash-kibana ~]# vim /etc/logstash/conf.d/logstash-from-redis.conf
[root@logstash-kibana ~]# cat /etc/logstash/conf.d/logstash-from-redis.conf
input {
   redis {
      host => "192.168.200.19"
      port => 6379
      password => "yunwei"
      db => "0"
      data_type => "list"
      key => "filebeat"           #修改本行的读取的redis的key即可
   }
}
filter {
}
output {
   if [type] == "system" {
        if [tags][0] == "syslog" {
              elasticsearch {
                     hosts => ["http://192.168.200.16:9200","http://192.168.200.17:9200","http://192.168.200.18:9200"]
                     index => "logstash-mr_yang-syslog-%{+YYYY.MM.dd}"
              }
              stdout { codec => rubydebug }
        }
        else if [tags][0] == "auth" {
               elasticsearch {
                     hosts => ["http://192.168.200.16:9200","http://192.168.200.17:9200","http://192.168.200.18:9200"]
                     index => "logstash-mr_yang-auth-%{+YYYY.MM.dd}"
              }
              stdout { codec => rubydebug }
          }
     }
}
#清空ES数据后,启动logstash读取redis数据
[root@logstash-kibana ~]# /usr/share/logstash/bin/logstash -f /etc/logstash/conf.d/logstash-from-redis.conf

#查看redis的key被消费情况
[root@logstash-kibana ~]# redis-cli -a yunwei llen filebeat
(integer) 7
[root@Logstash-Kibana ~]# redis-cli -a yunwei llen filebeat
(integer) 0
[root@Logstash-Kibana ~]# redis-cli -a yunwei llen filebeat
(integer) 0
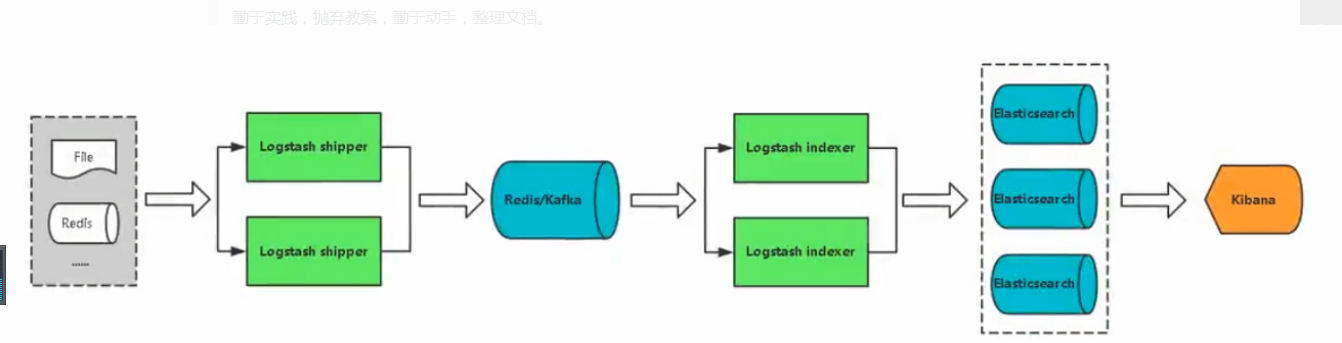
6. 生产应用案例(Filebeat+Redis+ELK)
| 主机名 | 主机IP | 用途 |
|---|---|---|
| ES1 | 192.168.200.16 | elasticsearch-node1 |
| ES2 | 192.168.200.17 | elasticsearch-node2 |
| ES3 | 192.168.200.18 | elasticsearch-node3 |
| Logstash-Kibana | 192.168.200.19 | 日志可视化服务器 |
| Web-Server | 192.168.200.20 | 模拟各种待收集的日志客户端 |
6.1 收集Nginx日志
6.1.1 部署nginxWeb
#安装依赖包
[root@web-server ~]# yum -y install pcre-devel openssl-devel
#编译安装nginx
[root@web-server ~]# tar xf nginx-1.10.2.tar.gz -C /usr/src/
[root@web-server ~]# cd /usr/src/nginx-1.10.2/
[root@web-server nginx-1.10.2]# useradd -s /sbin/nologin -M nginx
[root@web-server nginx-1.10.2]# ./configure --user=nginx --group=nginx --prefix=/usr/local/nginx --with-http_stub_status_module --with-http_ssl_module
#一些省略若干。。。

[root@web-server nginx-1.10.2]# make && make install
#一些省略若干。。。
#为nginx命令创建软连接
[root@web-server nginx-1.10.2]# ln -s /usr/local/nginx/sbin/* /usr/local/sbin/
[root@web-server nginx-1.10.2]# which nginx
/usr/local/sbin/nginx
[root@web-server nginx-1.10.2]# nginx -v
nginx version: nginx/1.10.2
#编译nginx配置文件
[root@web-server nginx-1.10.2]# cd /usr/local/nginx/
[root@web-server nginx]# vim conf/nginx.conf
[root@web-server nginx]# cat conf/nginx.conf
worker_processes  1;
events {
    worker_connections  1024;
}
http {
    include       mime.types;
    default_type  application/octet-stream;
    log_format main '$remote_addr - $remote_user [$time_local] "$request" '
                    '$status $body_bytes_sent "$http_referer" '
                    '"$http_user_agent" "$http_x_forwarded_for"';
    log_format json '{ "@timestamp":"$time_iso8601", '
                    '"remote_addr":"$remote_addr",'
                    '"remote_user":"$remote_user",'
                    '"body_bytes_sent":"$body_bytes_sent",'
                    '"request_time":"$request_time",'
                    '"status":"$status",'
                    '"request_uri":"$request_uri",'
                    '"request_method":"$request_method",'
                    '"http_referer":"$http_referer",'
                    '"body_bytes_sent":"$body_bytes_sent",'
                    '"http_x_forwarded_for":"$http_x_forwared_for",'
                    '"http_user_agent":"$http_user_agent"}';
    access_log logs/access_main.log main;        #开启main格式访问日志记录
    access_log logs/access_json.log json;        #开启json格式访问日志记录
    sendfile        on;
    keepalive_timeout  65;
    server {
        listen       80;
        server_name  www.ywb.com;
        location / {
            root   html/www;
            index  index.html index.htm;
        }
    }
}


[root@web-server nginx]# mkdir -p html/www
[root@web-server nginx]# echo "welcome to hyx" > html/www/index.html
[root@web-server nginx]# cat html/www/index.html
welcome to hyx
#启动nginx
[root@web-server nginx]# nginx
[root@web-server nginx]# netstat -antup | grep nginx
tcp        0      0 0.0.0.0:80              0.0.0.0:*               LISTEN      11789/nginx: master


[root@web-server nginx]# curl 192.168.200.20
welcome to hyx
[root@web-server nginx]# curl 192.168.200.20
welcome to hyx
[root@web-server nginx]# cat logs/access_main.log      #查看main格式访问日志
192.168.200.20 - - [22/Sep/2019:16:21:22 +0800] "GET / HTTP/1.1" 200 15 "-" "curl/7.29.0" "-"
192.168.200.20 - - [22/Sep/2019:16:21:23 +0800] "GET / HTTP/1.1" 200 15 "-" "curl/7.29.0" "-"

[root@web-server nginx]# cat logs/access_json.log      #查看json格式访问日志
{ "@timestamp":"2019-09-22T16:21:22+08:00", "remote_addr":"192.168.200.20","remote_user":"-","body_bytes_sent":"15","request_time":"0.000","status":"200","request_uri":"/","request_method":"GET","http_referer":"-","body_bytes_sent":"15","http_x_forwarded_for":"-","http_user_agent":"curl/7.29.0"}
{ "@timestamp":"2019-09-22T16:21:23+08:00", "remote_addr":"192.168.200.20","remote_user":"-","body_bytes_sent":"15","request_time":"0.000","status":"200","request_uri":"/","request_method":"GET","http_referer":"-","body_bytes_sent":"15","http_x_forwarded_for":"-","http_user_agent":"curl/7.29.0"}
6.1.2 修改WebServer服务器上的filebeat配置文件
#filebeat配置文件修改成如下所示
[root@web-server nginx]# vim /etc/filebeat/filebeat.yml
[root@web-server nginx]# cat /etc/filebeat/filebeat.yml
filebeat.inputs:
- type: log
  paths:
    - /usr/local/nginx/logs/access_json.log     #收集json格式的访问日志
  tags: ["access"]
  fields:
    app: www
    type: nginx-access-json
  fields_under_root: true

- type: log
  paths:
    - /usr/local/nginx/logs/access_main.log     #收集main格式的访问日志
  tags: ["access"]
  fields:
    app: www
    type: nginx-access
  fields_under_root: true

- type: log
  paths:
    - /usr/local/nginx/logs/error.log           #收集错误日志
  tags: ["error"]
  fields:
    app: www
    type: nginx-error
  fields_under_root: true

output.redis:                                    #输出到redis
  hosts: ["192.168.200.19"]
  password: "yunwei"
  key: "filebeat"
  db: 0
  datatype: list
#启动filebeat
[root@web-server nginx]# systemctl restart filebeat
#查看logstash-kibana服务器上redis储存的key
[root@Logstash-Kibana ~]# redis-cli -a yunwei llen filebeat
(integer) 63
6.1.3 修改logstash-kibana服务器上logstash的配置文件
#logstash配置文件修改成如下所示
[root@Logstash-Kibana ~]# vim /etc/logstash/conf.d/logstash-from-redis.conf
[root@Logstash-Kibana ~]# cat /etc/logstash/conf.d/logstash-from-redis.conf
input {
  redis {
    host => "192.168.200.19"
    port => 6379
    password => "yunwei"
    db => "0"
	    data_type => "list"
	    key => "filebeat"
	  }
	}
	filter {
	  if [app] == "www" {   #如果日志项目名称是www
	     if [type] == "nginx-access-json" {     #如果是json类型的数据
	        json {
	             source => "message"            #将源为message的json格式数据进行解析
	             remove_field => ["message"]    #移除message字段
	        }
	        geoip {
	             source => "remote_addr"    #针对remote_addr的数据进行来源解析
	             target => "geoip"          #将解析结果输出到geoip字段中
	             database => "/opt/GeoLite2-City.mmdb"  #geoip的解析库文件位置
	             add_field => ["[geoip][coordinates]","%{[geoip][longitude]}"]  #添加列表格式字段数据
	             add_field => ["[geoip][coordinates]","%{[geoip][latitude]}"]   #添加列表格式字段数据
	        }
	        mutate {
	             convert => ["[geoip][coordinates]","float"]    #将列表格式转换成字符串格式
	        }
	     }
	     if [type] == "nginx-access" {      #如果是main格式类型数据
	        grok {
	             match => {
	                "message" => '(?<client>[0-9.]+).*' #从message中抓取client字段数据
	             }
	        }
	        geoip {
	             source => "client" #对client字段数据进行来源解析
	             target => "geoip"
	             database => "/opt/GeoLite2-City.mmdb"
	             add_field => ["[geoip][coordinates]","%{[geoip][longitude]}"]
	             add_field => ["[geoip][coordinates]","%{[geoip][latitude]}"]
	        }
	        mutate {
	             convert => ["[geoip][coordinates]","float"]
	        }
	     }
	  }
	}
	output {
	  elasticsearch {
	      hosts => ["http://192.168.200.16:9200","http://192.168.200.17:9200","http://192.168.200.18:9200"]
	      index => "logstash-mr_yang-%{type}-%{+YYYY.MM.dd}"    #根据type变量的值的不同写入不同的索引
	  }
	  stdout { codec => rubydebug }
	}
#启动logstash进程
[root@Logstash-Kibana ~]# /usr/share/logstash/bin/logstash -f /etc/logstash/conf.d/logstash-from-redis.conf

#查看redis的key的消费情况
[root@Logstash-Kibana ~]# redis-cli -a yunwei llen filebeat
(integer) 0
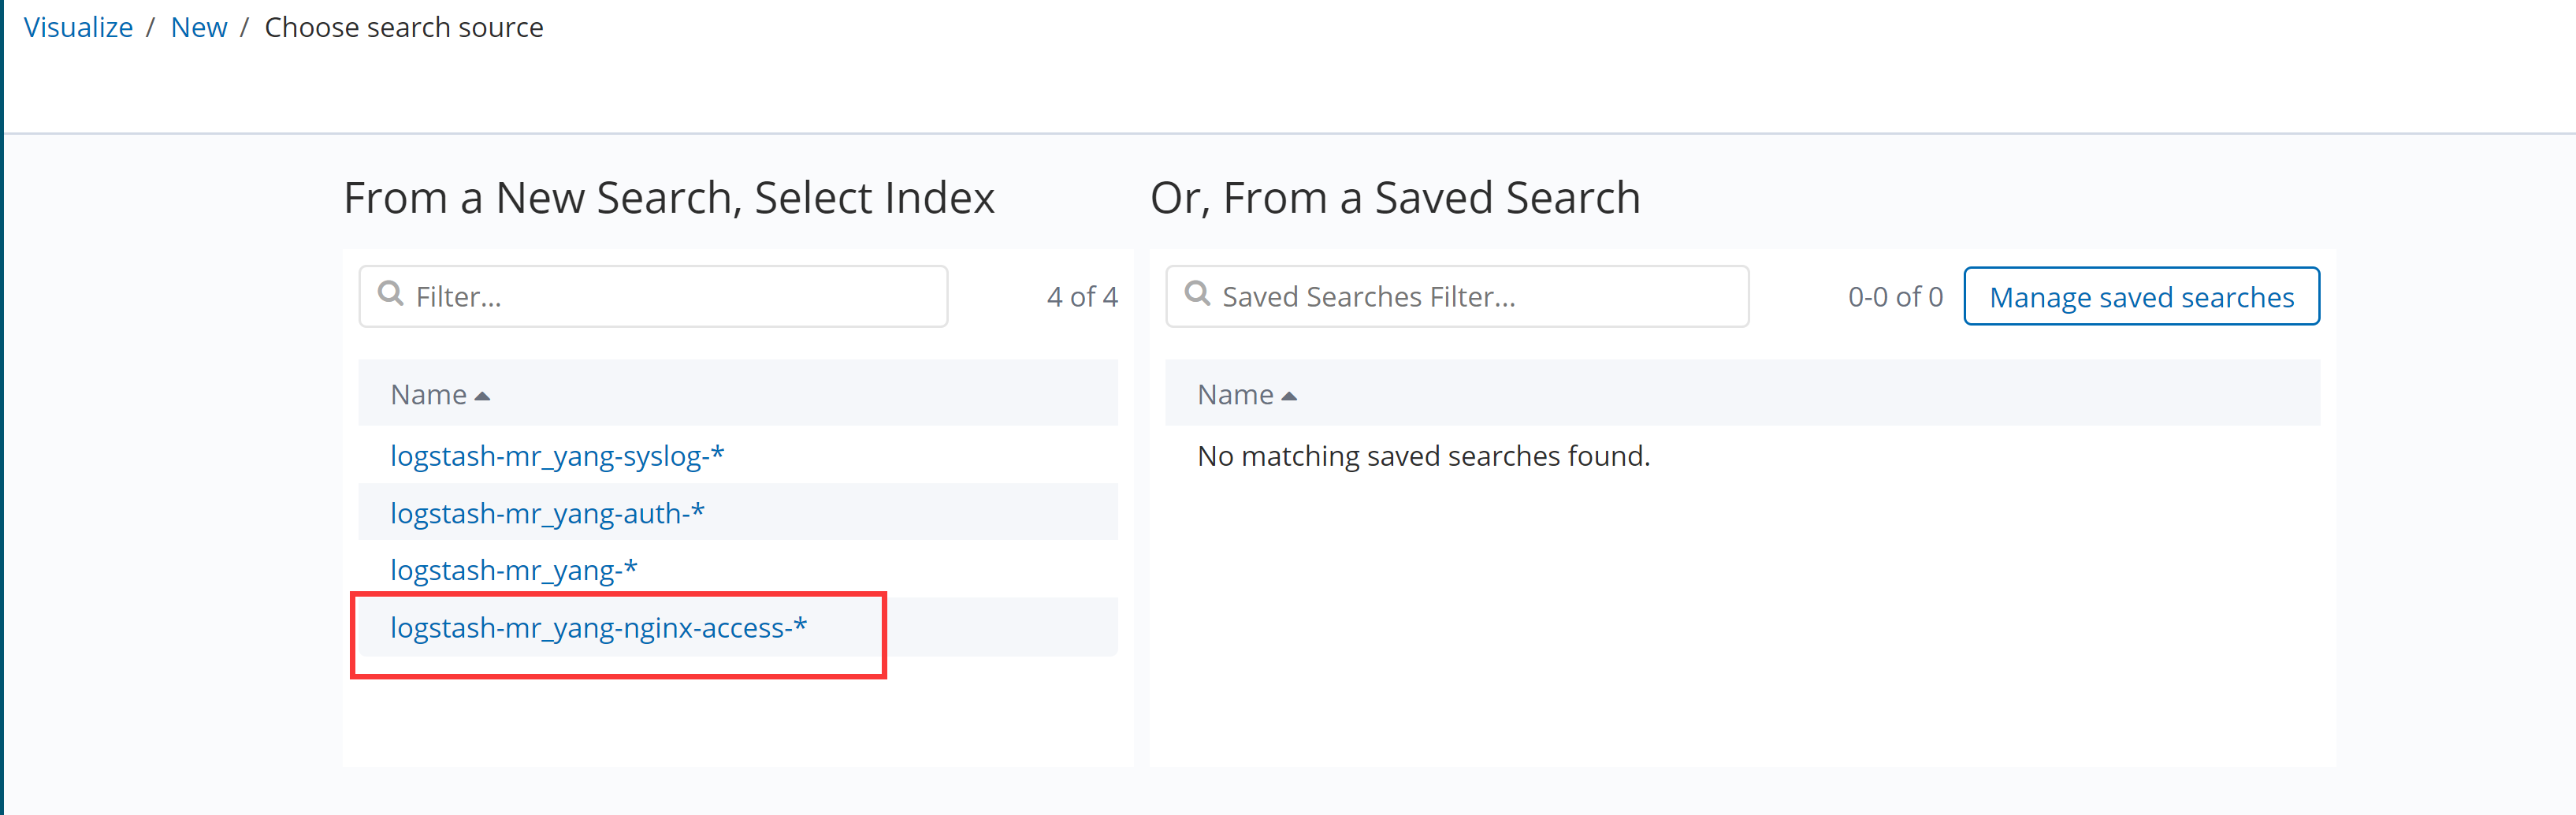
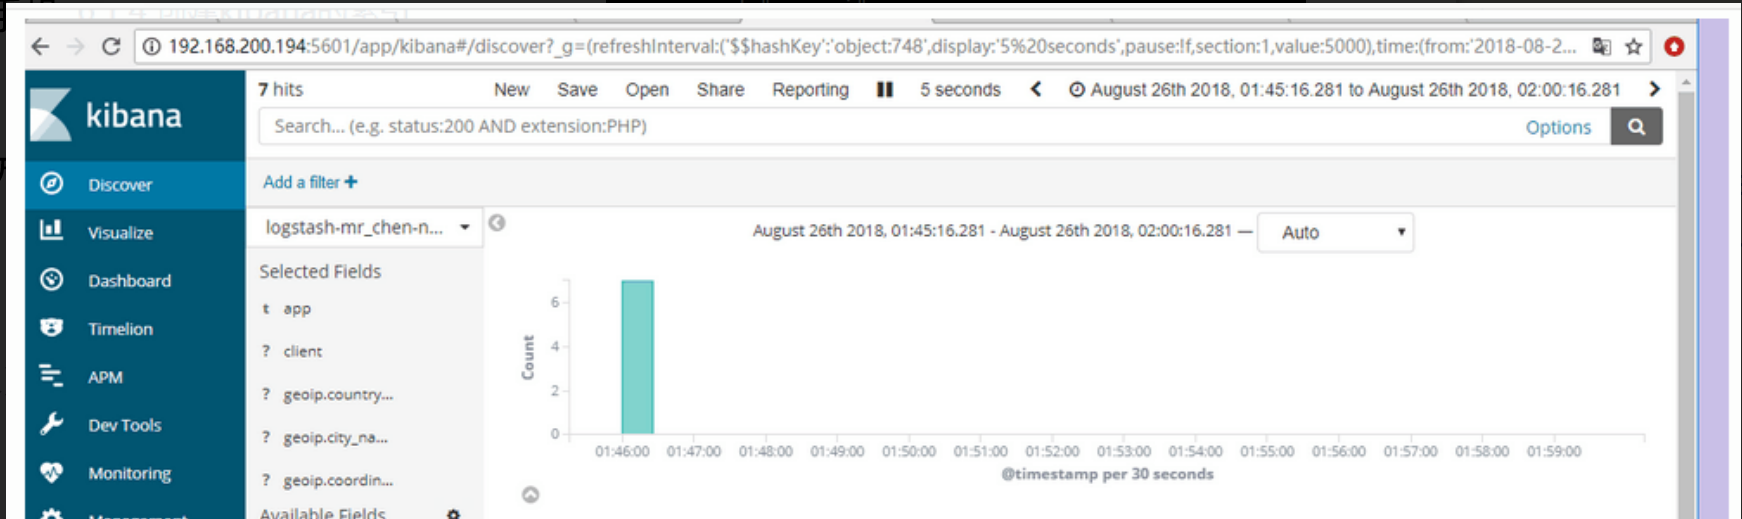
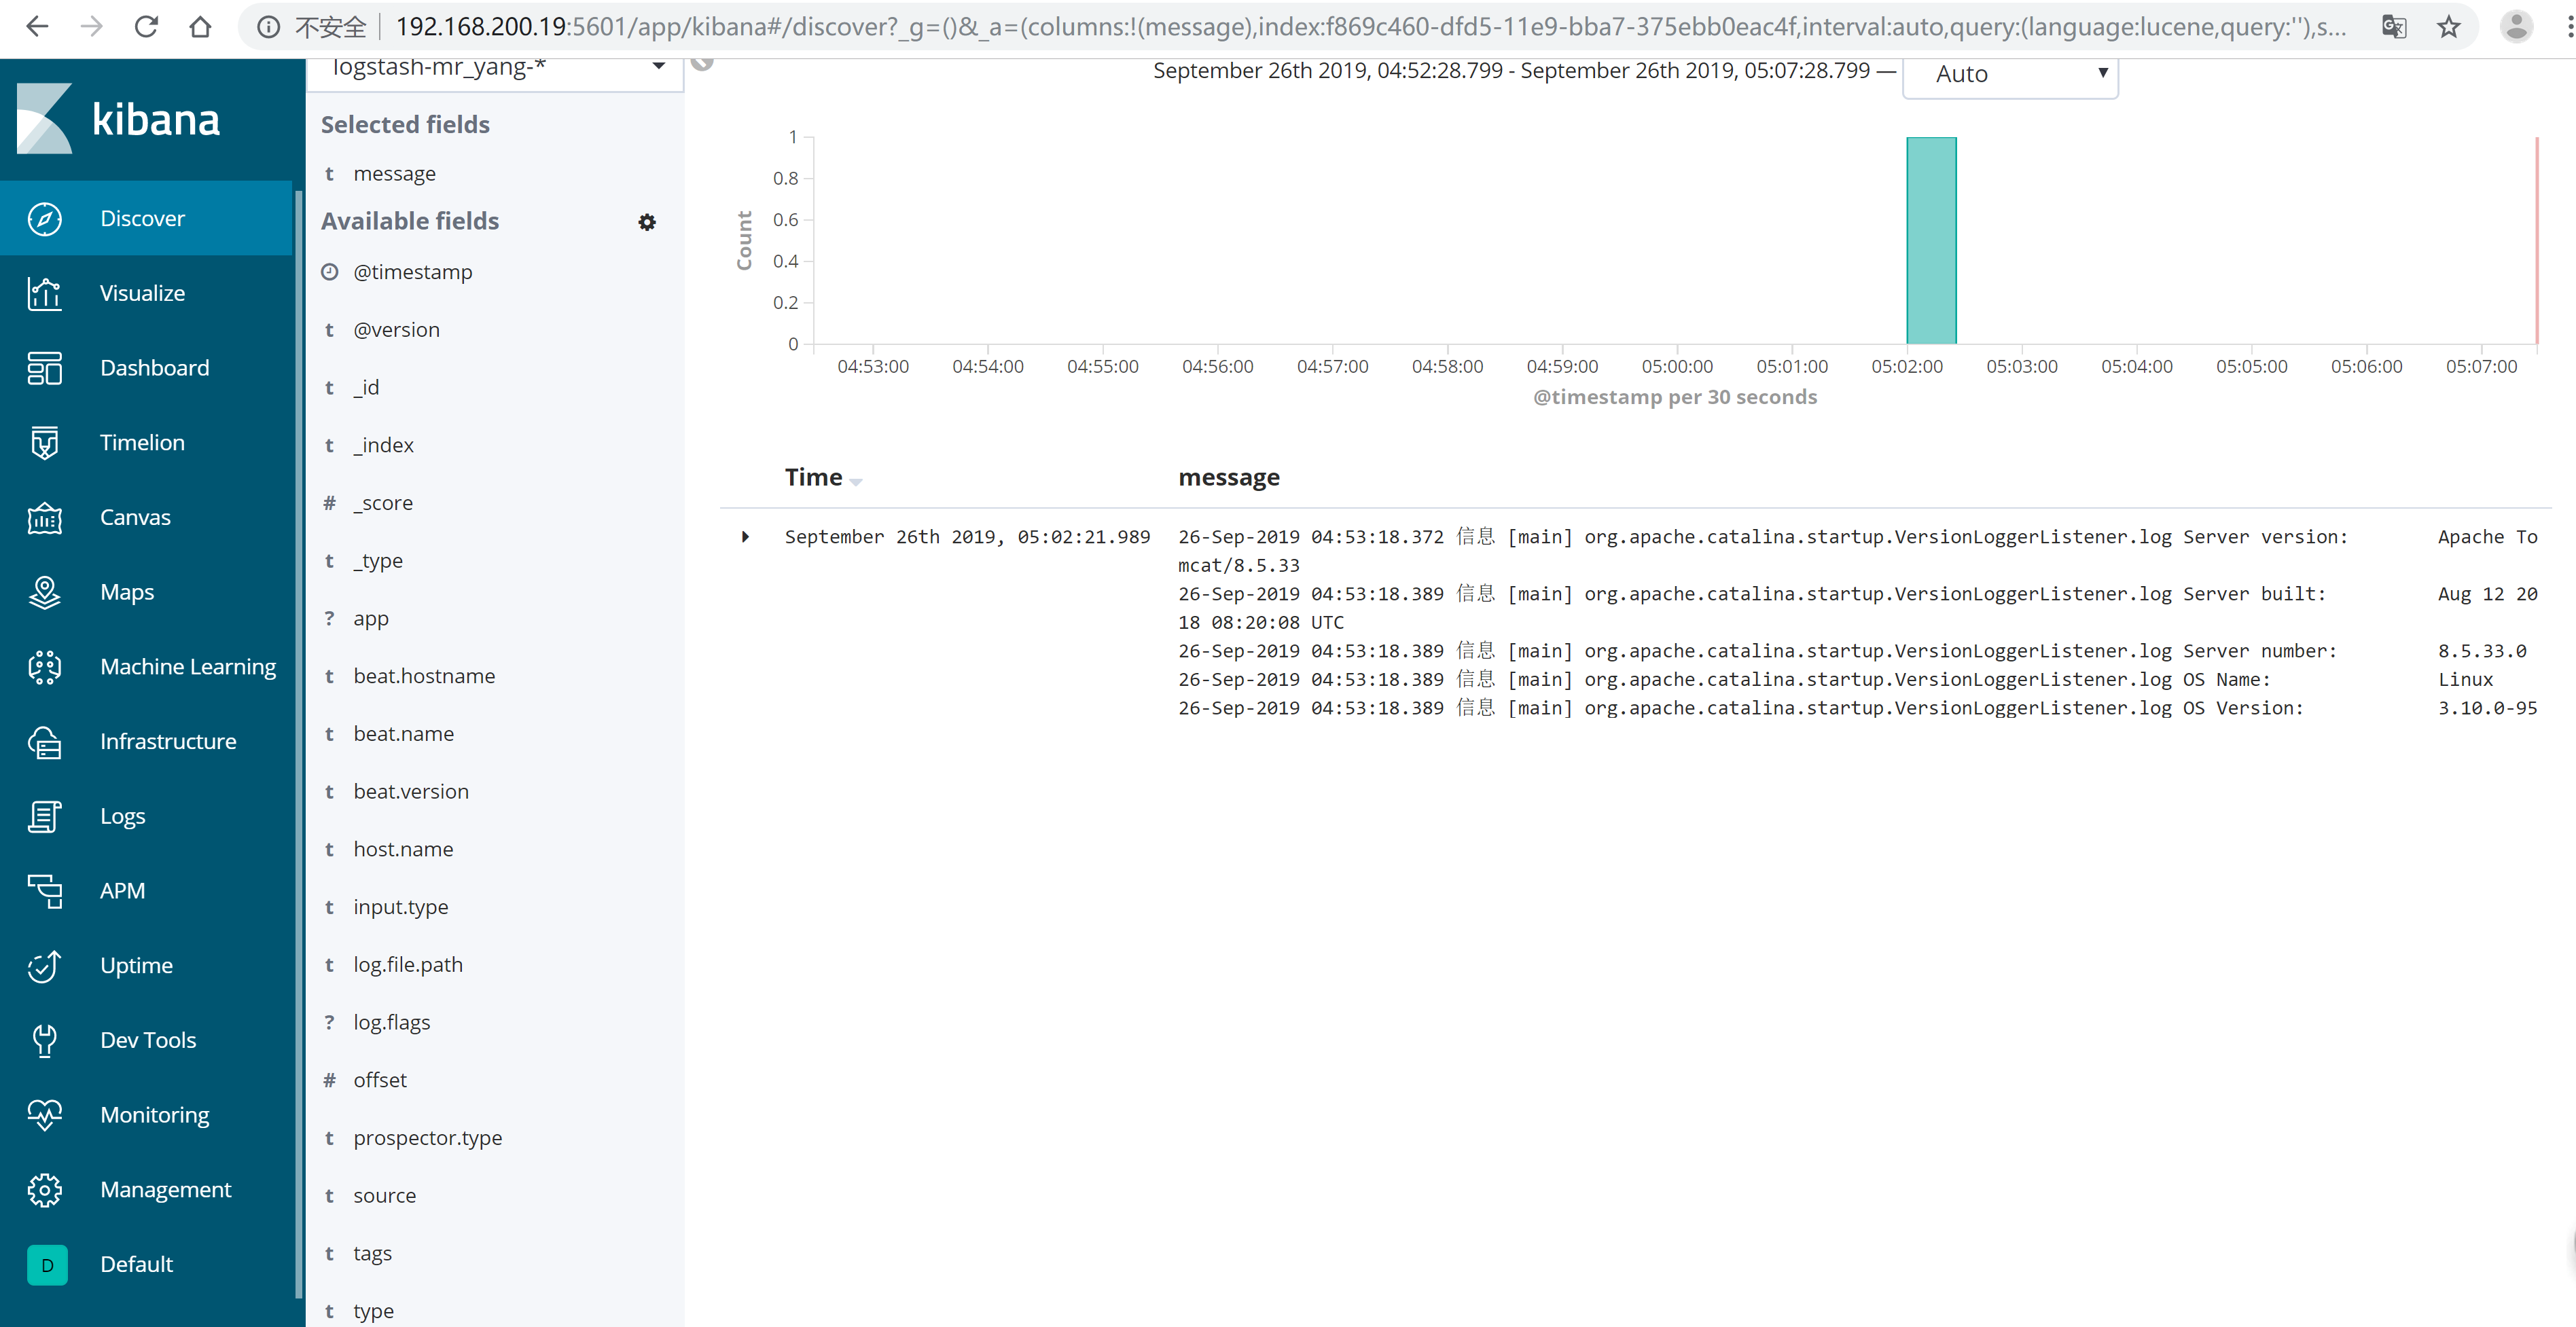
6.1.4 创建kibana的索引
在kibana上关联索引,进行数据收集的展示http://192.168.200.19:5601
6.2 收集Java堆栈日志
6.2.1 部署tomcat
[root@Web-Server ~]# wget http://mirror.bit.edu.cn/apache/tomcat/tomcat-8/v8.5.33/bin/apache-tomcat-8.5.33.tar.gz
[root@Web-Server ~]# tar xf apache-tomcat-8.5.33.tar.gz -C /usr/local/
[root@Web-Server ~]# mv /usr/local/apache-tomcat-8.5.33 /usr/local/tomcat

[root@Web-Server ~]# /usr/local/tomcat/bin/startup.sh
Using CATALINA_BASE:   /usr/local/tomcat
Using CATALINA_HOME:   /usr/local/tomcat
Using CATALINA_TMPDIR: /usr/local/tomcat/temp
Using JRE_HOME:        /usr
Using CLASSPATH:       /usr/local/tomcat/bin/bootstrap.jar:/usr/local/tomcat/bin/tomcat-juli.jar
Tomcat started.

[root@Web-Server ~]# tail -f /usr/local/tomcat/logs/catalina.out   #查看日志
26-Sep-2019 04:53:19.113 信息 [localhost-startStop-1] org.apache.catalina.startup.HostConfig.deployDirectory Deployment of web application directory [/usr/local/tomcat/webapps/docs] has finished in [24] ms
26-Sep-2019 04:53:19.113 信息 [localhost-startStop-1] org.apache.catalina.startup.HostConfig.deployDirectory Deploying web application directory [/usr/local/tomcat/webapps/examples]
26-Sep-2019 04:53:19.448 信息 [localhost-startStop-1] org.apache.catalina.startup.HostConfig.deployDirectory Deployment of web application directory [/usr/local/tomcat/webapps/examples] has finished in [335] ms
26-Sep-2019 04:53:19.448 信息 [localhost-startStop-1] org.apache.catalina.startup.HostConfig.deployDirectory Deploying web application directory [/usr/local/tomcat/webapps/host-manager]
26-Sep-2019 04:53:19.474 信息 [localhost-startStop-1] org.apache.catalina.startup.HostConfig.deployDirectory Deployment of web application directory [/usr/local/tomcat/webapps/host-manager] has finished in [26] ms
26-Sep-2019 04:53:19.475 信息 [localhost-startStop-1] org.apache.catalina.startup.HostConfig.deployDirectory Deploying web application directory [/usr/local/tomcat/webapps/manager]
26-Sep-2019 04:53:19.499 信息 [localhost-startStop-1] org.apache.catalina.startup.HostConfig.deployDirectory Deployment of web application directory [/usr/local/tomcat/webapps/manager] has finished in [24] ms
26-Sep-2019 04:53:19.514 信息 [main] org.apache.coyote.AbstractProtocol.start Starting ProtocolHandler ["http-nio-8080"]
26-Sep-2019 04:53:19.523 信息 [main] org.apache.coyote.AbstractProtocol.start Starting ProtocolHandler ["ajp-nio-8009"]
26-Sep-2019 04:53:19.526 信息 [main] org.apache.catalina.startup.Catalina.start Server startup in 962 ms
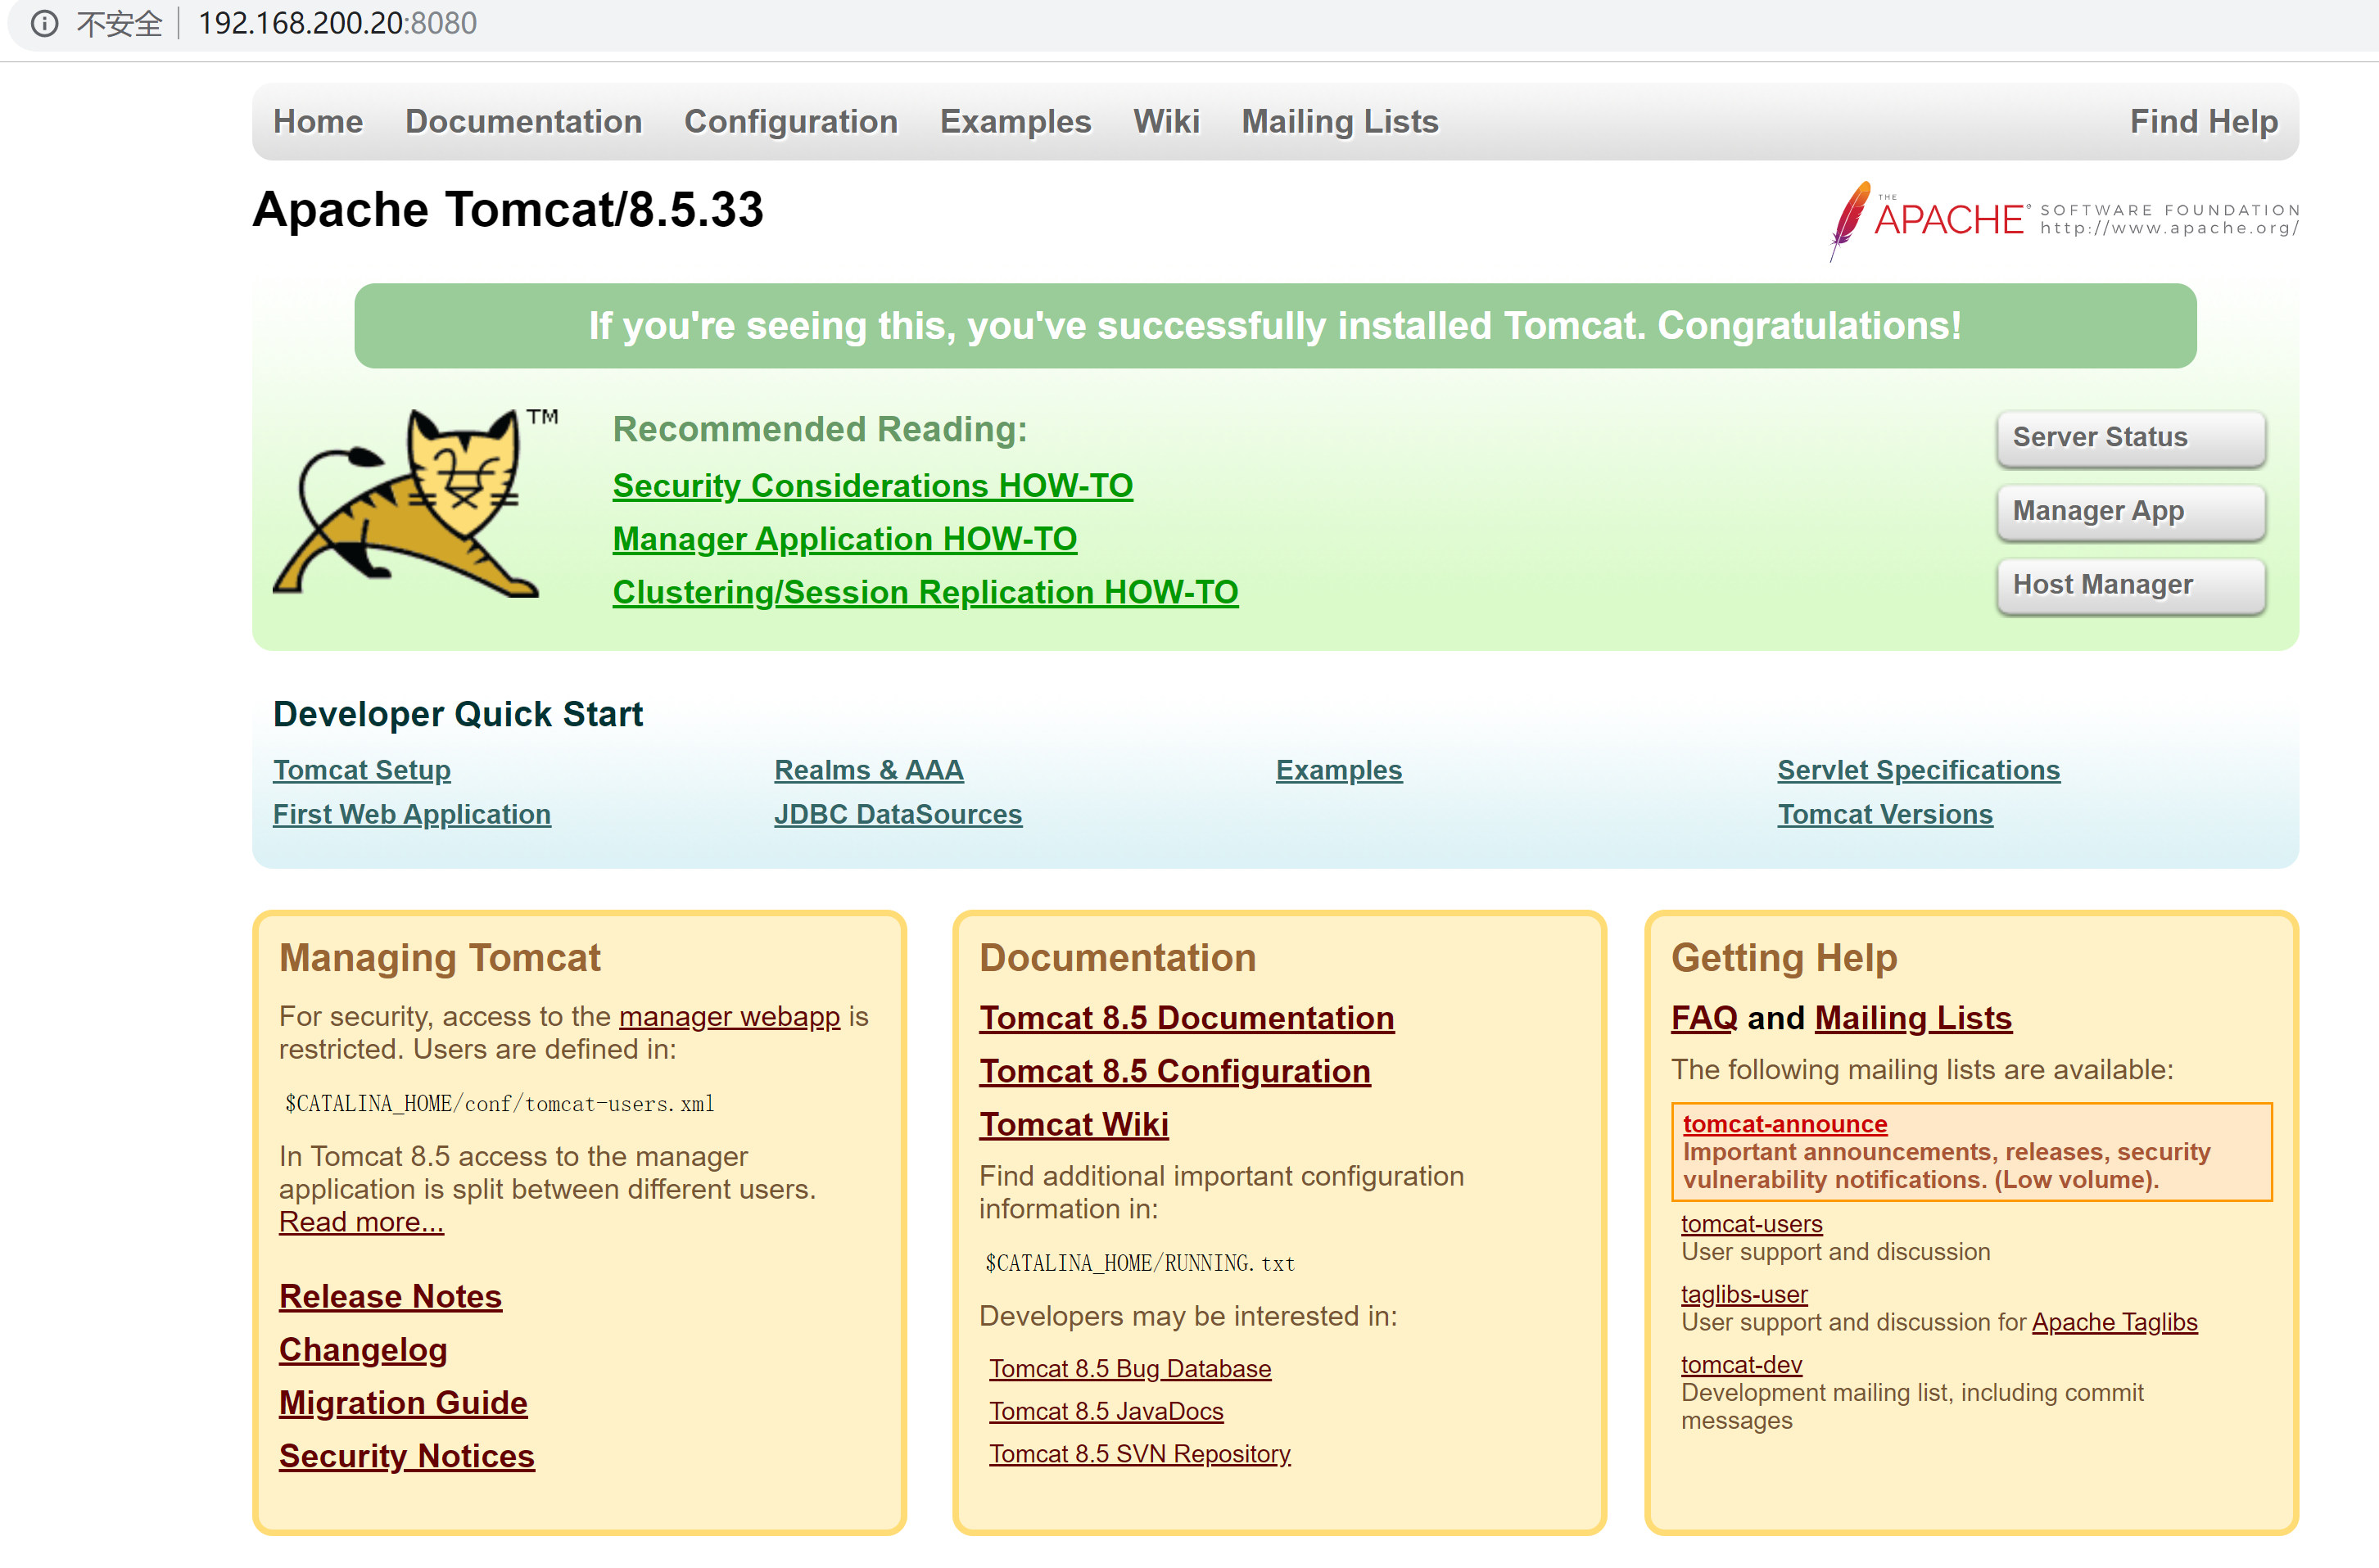
6.2.2 用浏览器访问tomcat
6.2.3 配置filebeat收集日志
catalina.out就是tomcat的堆栈日志
#catalina.out的堆栈报错示例
2019-09-26 04:20:08
[ERROR]-[Thread: Druid-ConnectionPool-Create-1090484466]-[com.alibaba.druid.pool.DruidDataSource$CreateConnectionThread.run()]: create connection error, url: jdbc:mysql://localhost:3306/jpress?useUnicode=true&characterEncoding=utf8&zeroDateTimeBehavior=convertToNull, errorCode 0, state 08S01
com.mysql.jdbc.exceptions.jdbc4.CommunicationsException: Communications link failure

The last packet sent successfully to the server was 0 milliseconds ago. The driver has not received any packets from the server.
    at sun.reflect.GeneratedConstructorAccessor25.newInstance(Unknown Source)
    at sun.reflect.DelegatingConstructorAccessorImpl.newInstance(DelegatingConstructorAccessorImpl.java:45)
    at java.lang.reflect.Constructor.newInstance(Constructor.java:423)
	    at com.mysql.jdbc.Util.handleNewInstance(Util.java:411)
	    at com.mysql.jdbc.SQLError.createCommunicationsException(SQLError.java:1117)
	    at com.mysql.jdbc.MysqlIO.<init>(MysqlIO.java:350)
	    at com.mysql.jdbc.ConnectionImpl.coreConnect(ConnectionImpl.java:2393)
	    at com.mysql.jdbc.ConnectionImpl.connectOneTryOnly(ConnectionImpl.java:2430)
	    at com.mysql.jdbc.ConnectionImpl.createNewIO(ConnectionImpl.java:2215)
	    at com.mysql.jdbc.ConnectionImpl.<init>(ConnectionImpl.java:813)
	    at com.mysql.jdbc.JDBC4Connection.<init>(JDBC4Connection.java:47)
	    at sun.reflect.GeneratedConstructorAccessor22.newInstance(Unknown Source)
	    at sun.reflect.DelegatingConstructorAccessorImpl.newInstance(DelegatingConstructorAccessorImpl.java:45)
	    at java.lang.reflect.Constructor.newInstance(Constructor.java:423)
	    at com.mysql.jdbc.Util.handleNewInstance(Util.java:411)
	    at com.mysql.jdbc.ConnectionImpl.getInstance(ConnectionImpl.java:399)
	    at com.mysql.jdbc.NonRegisteringDriver.connect(NonRegisteringDriver.java:334)
	    at com.alibaba.druid.filter.FilterChainImpl.connection_connect(FilterChainImpl.java:148)
	    at com.alibaba.druid.filter.stat.StatFilter.connection_connect(StatFilter.java:211)
	    at com.alibaba.druid.filter.FilterChainImpl.connection_connect(FilterChainImpl.java:142)
	    at com.alibaba.druid.pool.DruidAbstractDataSource.createPhysicalConnection(DruidAbstractDataSource.java:1423)
	    at com.alibaba.druid.pool.DruidAbstractDataSource.createPhysicalConnection(DruidAbstractDataSource.java:1477)
	    at com.alibaba.druid.pool.DruidDataSource$CreateConnectionThread.run(DruidDataSource.java:2001)
	Caused by: java.net.ConnectException: 拒绝连接 (Connection refused)
	    at java.net.PlainSocketImpl.socketConnect(Native Method)
	    at java.net.AbstractPlainSocketImpl.doConnect(AbstractPlainSocketImpl.java:350)
	    at java.net.AbstractPlainSocketImpl.connectToAddress(AbstractPlainSocketImpl.java:206)
	    at java.net.AbstractPlainSocketImpl.connect(AbstractPlainSocketImpl.java:188)
	    at java.net.SocksSocketImpl.connect(SocksSocketImpl.java:392)
	    at java.net.Socket.connect(Socket.java:589)
	    at java.net.Socket.connect(Socket.java:538)
	    at java.net.Socket.<init>(Socket.java:434)
	    at java.net.Socket.<init>(Socket.java:244)
	    at com.mysql.jdbc.StandardSocketFactory.connect(StandardSocketFactory.java:257)
	    at com.mysql.jdbc.MysqlIO.<init>(MysqlIO.java:300)
	    ... 17 more
#修改filebeat配置文件加入对tomcat的堆栈报错的数据收集
[root@Web-Server ~]# vim /etc/filebeat/filebeat.yml
[root@Web-Server ~]# cat /etc/filebeat/filebeat.yml
filebeat.inputs:
- type: log
  paths:
    - /usr/local/nginx/logs/access_json.log
  tags: ["access"]
  fields:
    app: www
    type: nginx-access-json
  fields_under_root: true

- type: log
  paths:
    - /usr/local/nginx/logs/access_main.log
  tags: ["access"]
  fields:
    app: www
    type: nginx-access
  fields_under_root: true

- type: log
  paths:
    - /usr/local/nginx/logs/error.log
  tags: ["error"]
  fields:
    app: www
    type: nginx-error
  fields_under_root: true

- type: log
  paths:
    - /usr/local/tomcat/logs/catalina.out
  tags: ["tomcat"]
  fields:
    app: www
    type: tomcat-catalina
  fields_under_root: true
  multiline:
    pattern: '^['
    negate: true
    match: after

output.redis:
  hosts: ["192.168.200.19"]
  password: "yunwei"
  key: "filebeat"
  db: 0
  datatype: list
#重新启动filebeat
[root@Web-Server ~]# systemctl restart filebeat

#查看redis的数据队列数
[root@Logstash-Kibana ~]# redis-cli -a yunwei llen filebeat
(integer) 7

#启动logstash-kibana服务器下的logstash进程
[root@Logstash-Kibana ~]# /usr/share/logstash/bin/logstash -f /etc/logstash/conf.d/logstash-from-redis.conf
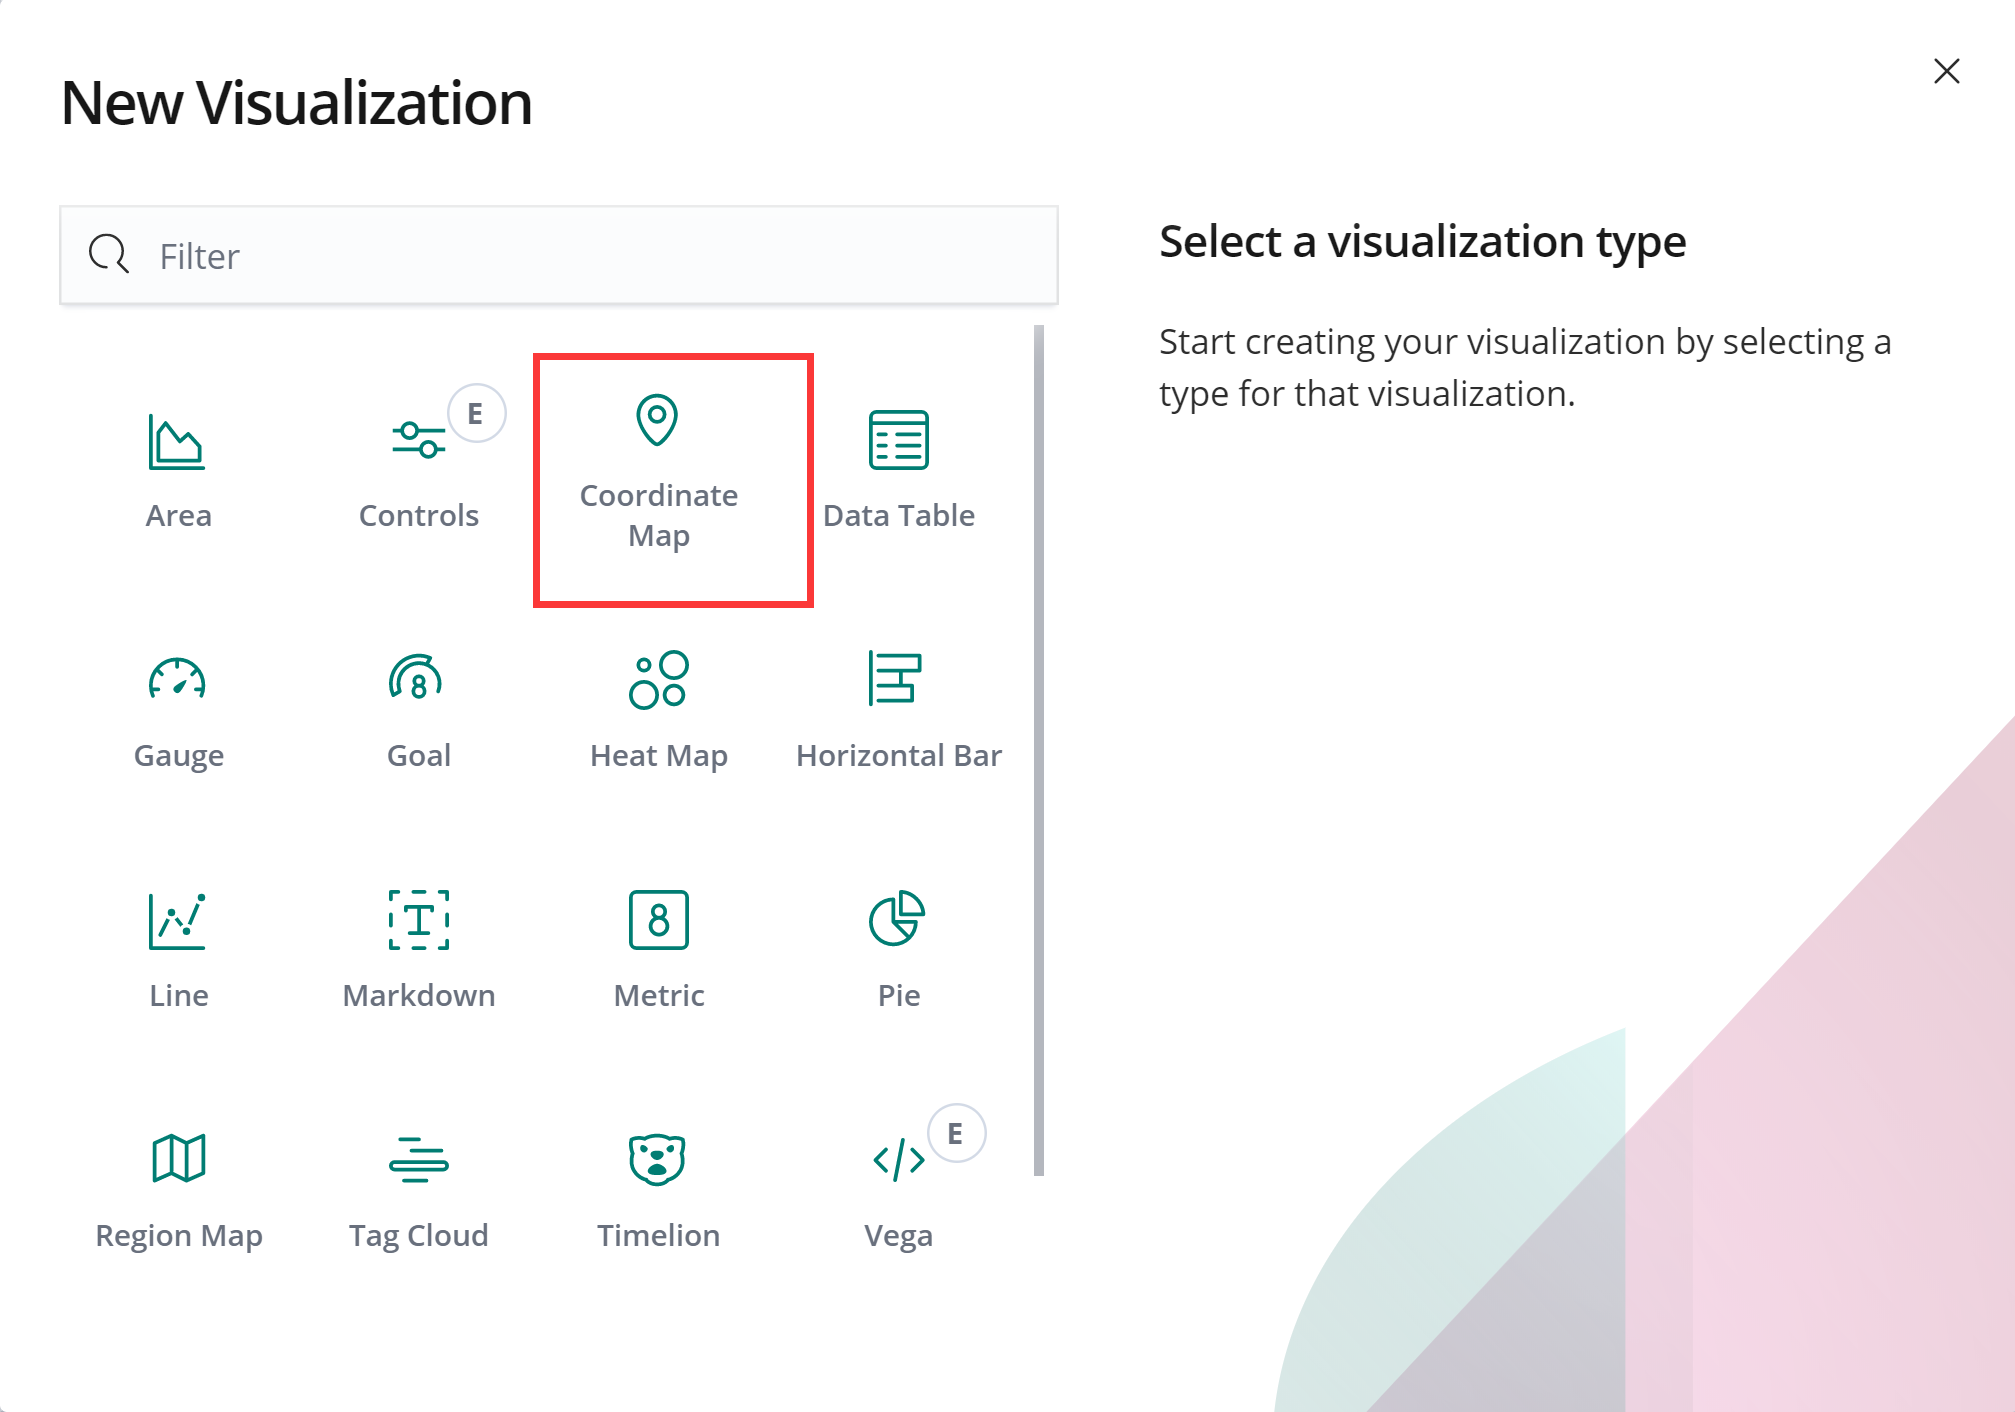
6.2.4 创建kibana的索引展示
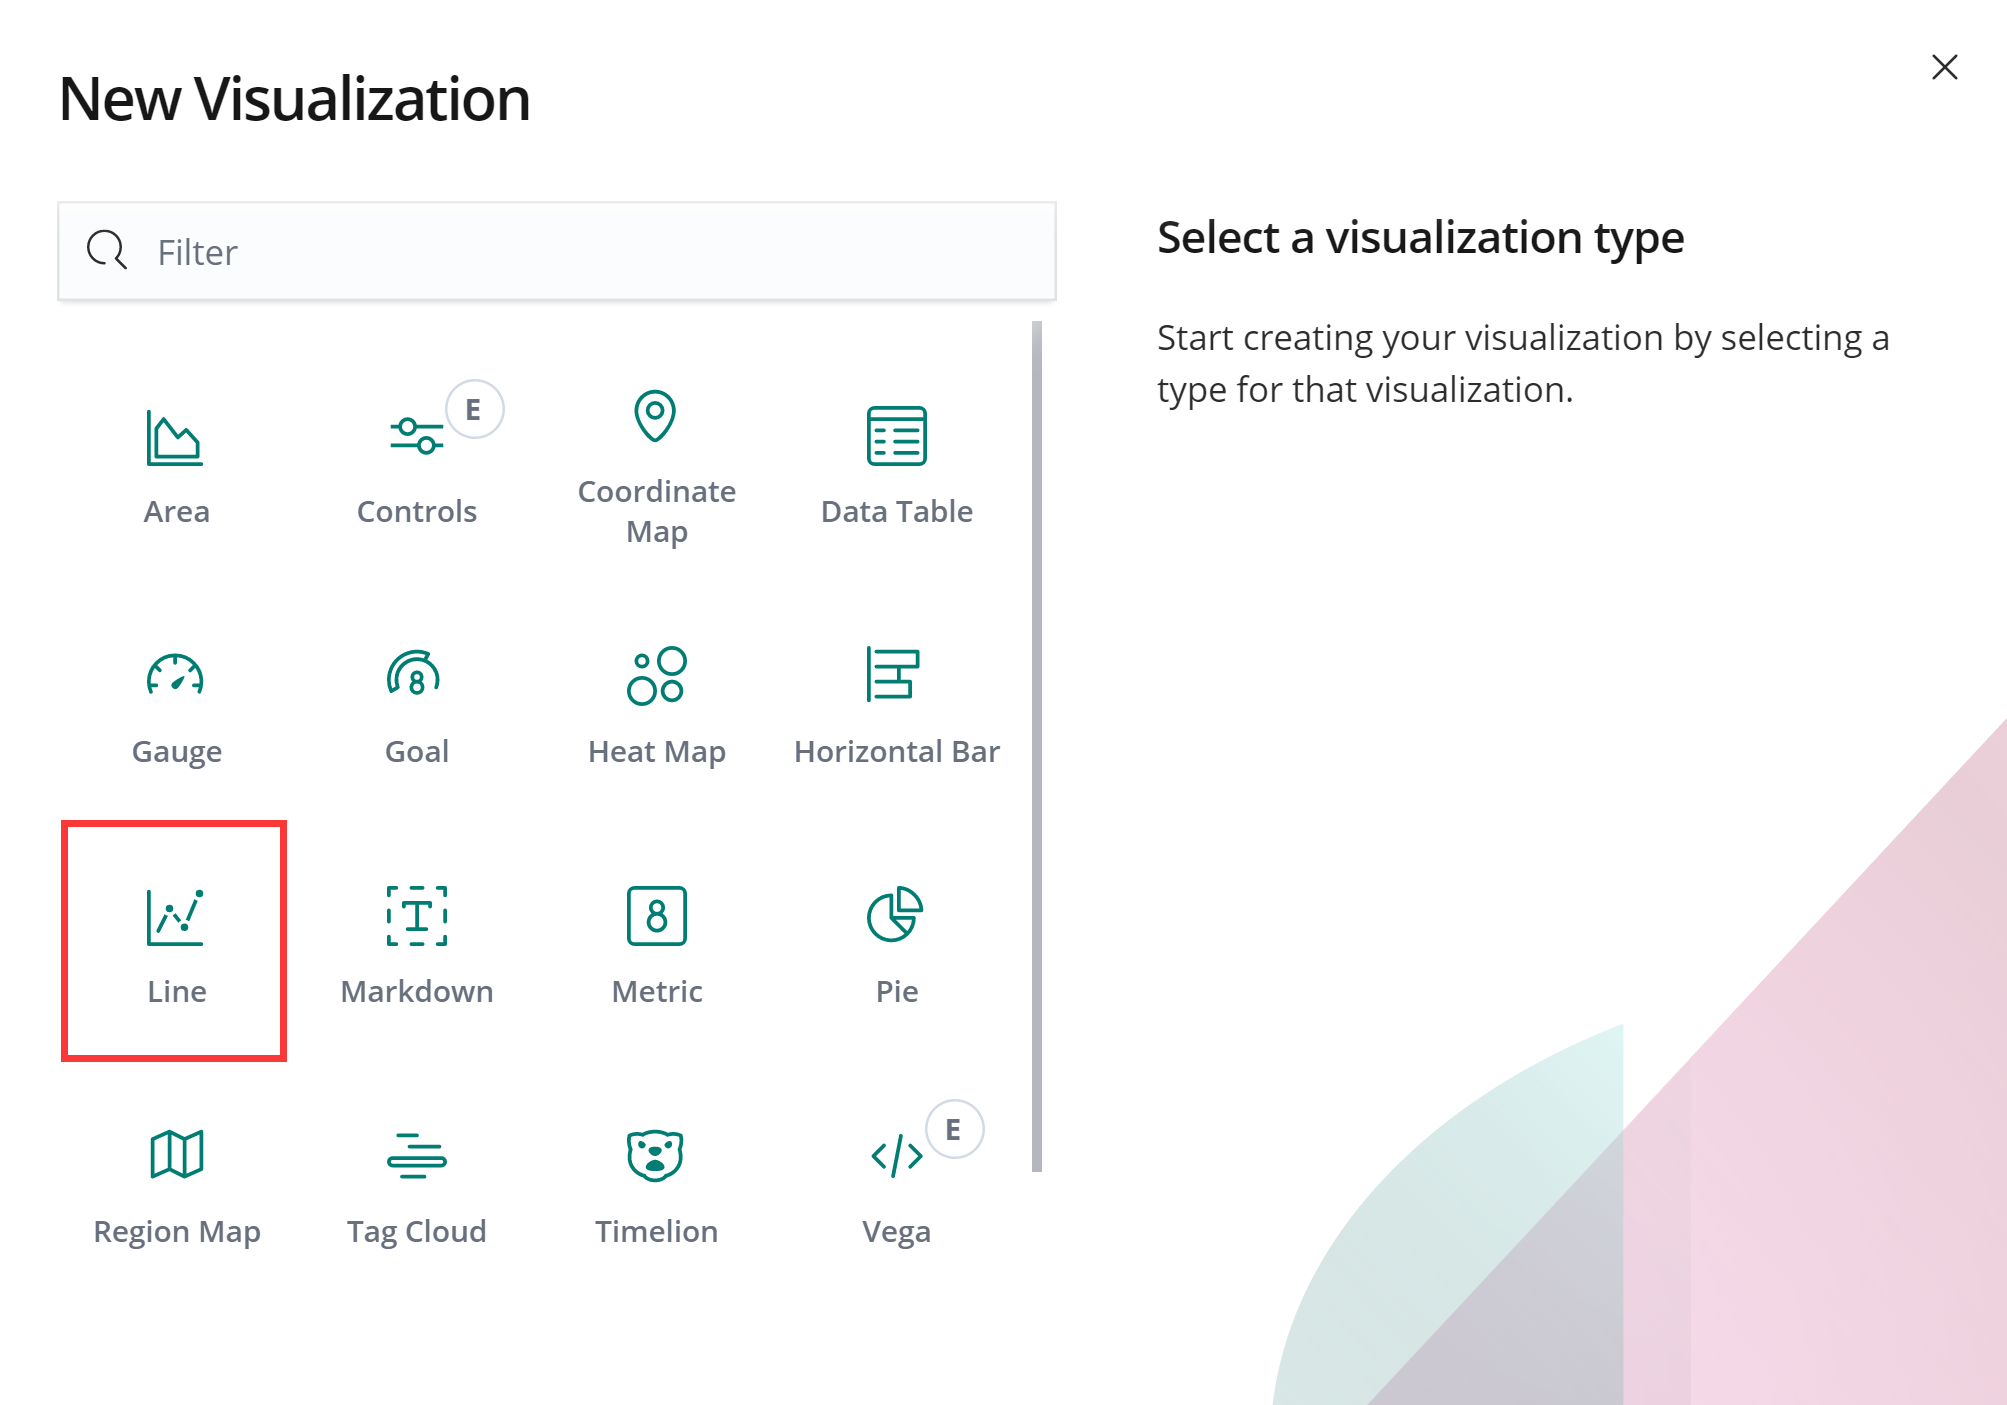
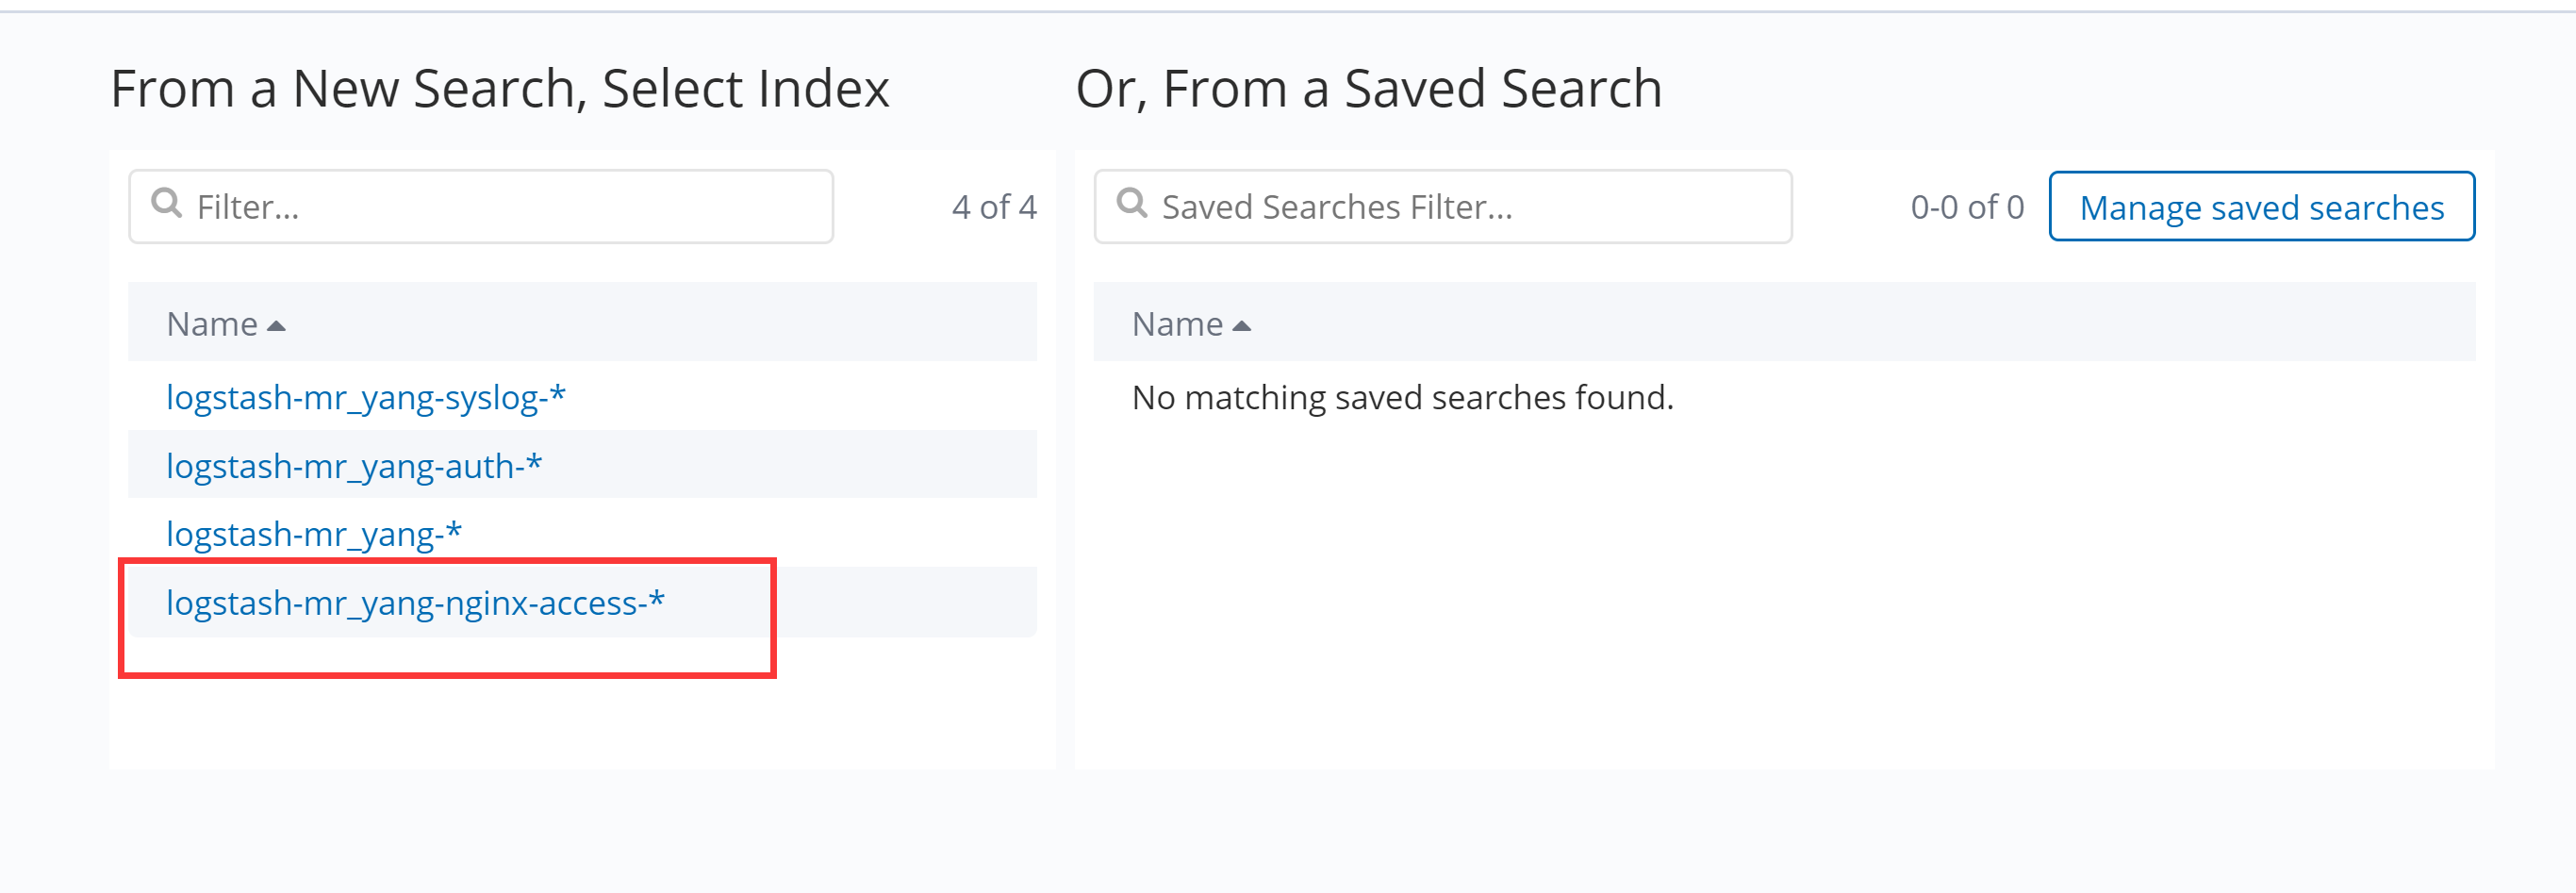
6.3 Kibana可视化和仪表盘
6.3.1 在nginx访问日志的main格式中,模拟些不同的访问IP
113.108.182.52
123.150.187.130
203.186.145.250
114.80.166.240
119.147.146.189
58.89.67.152
[root@Web-Server ~]# a='58.89.67.152 - - [26/Aug/2018:14:17:33 +0800] "GET / HTTP/1.1" 200 21 "-" "curl/7.29.0" "-"'
[root@Web-Server ~]# for i in `seq 50`;do echo $a >> /usr/local/nginx/logs/access_main.log ;done
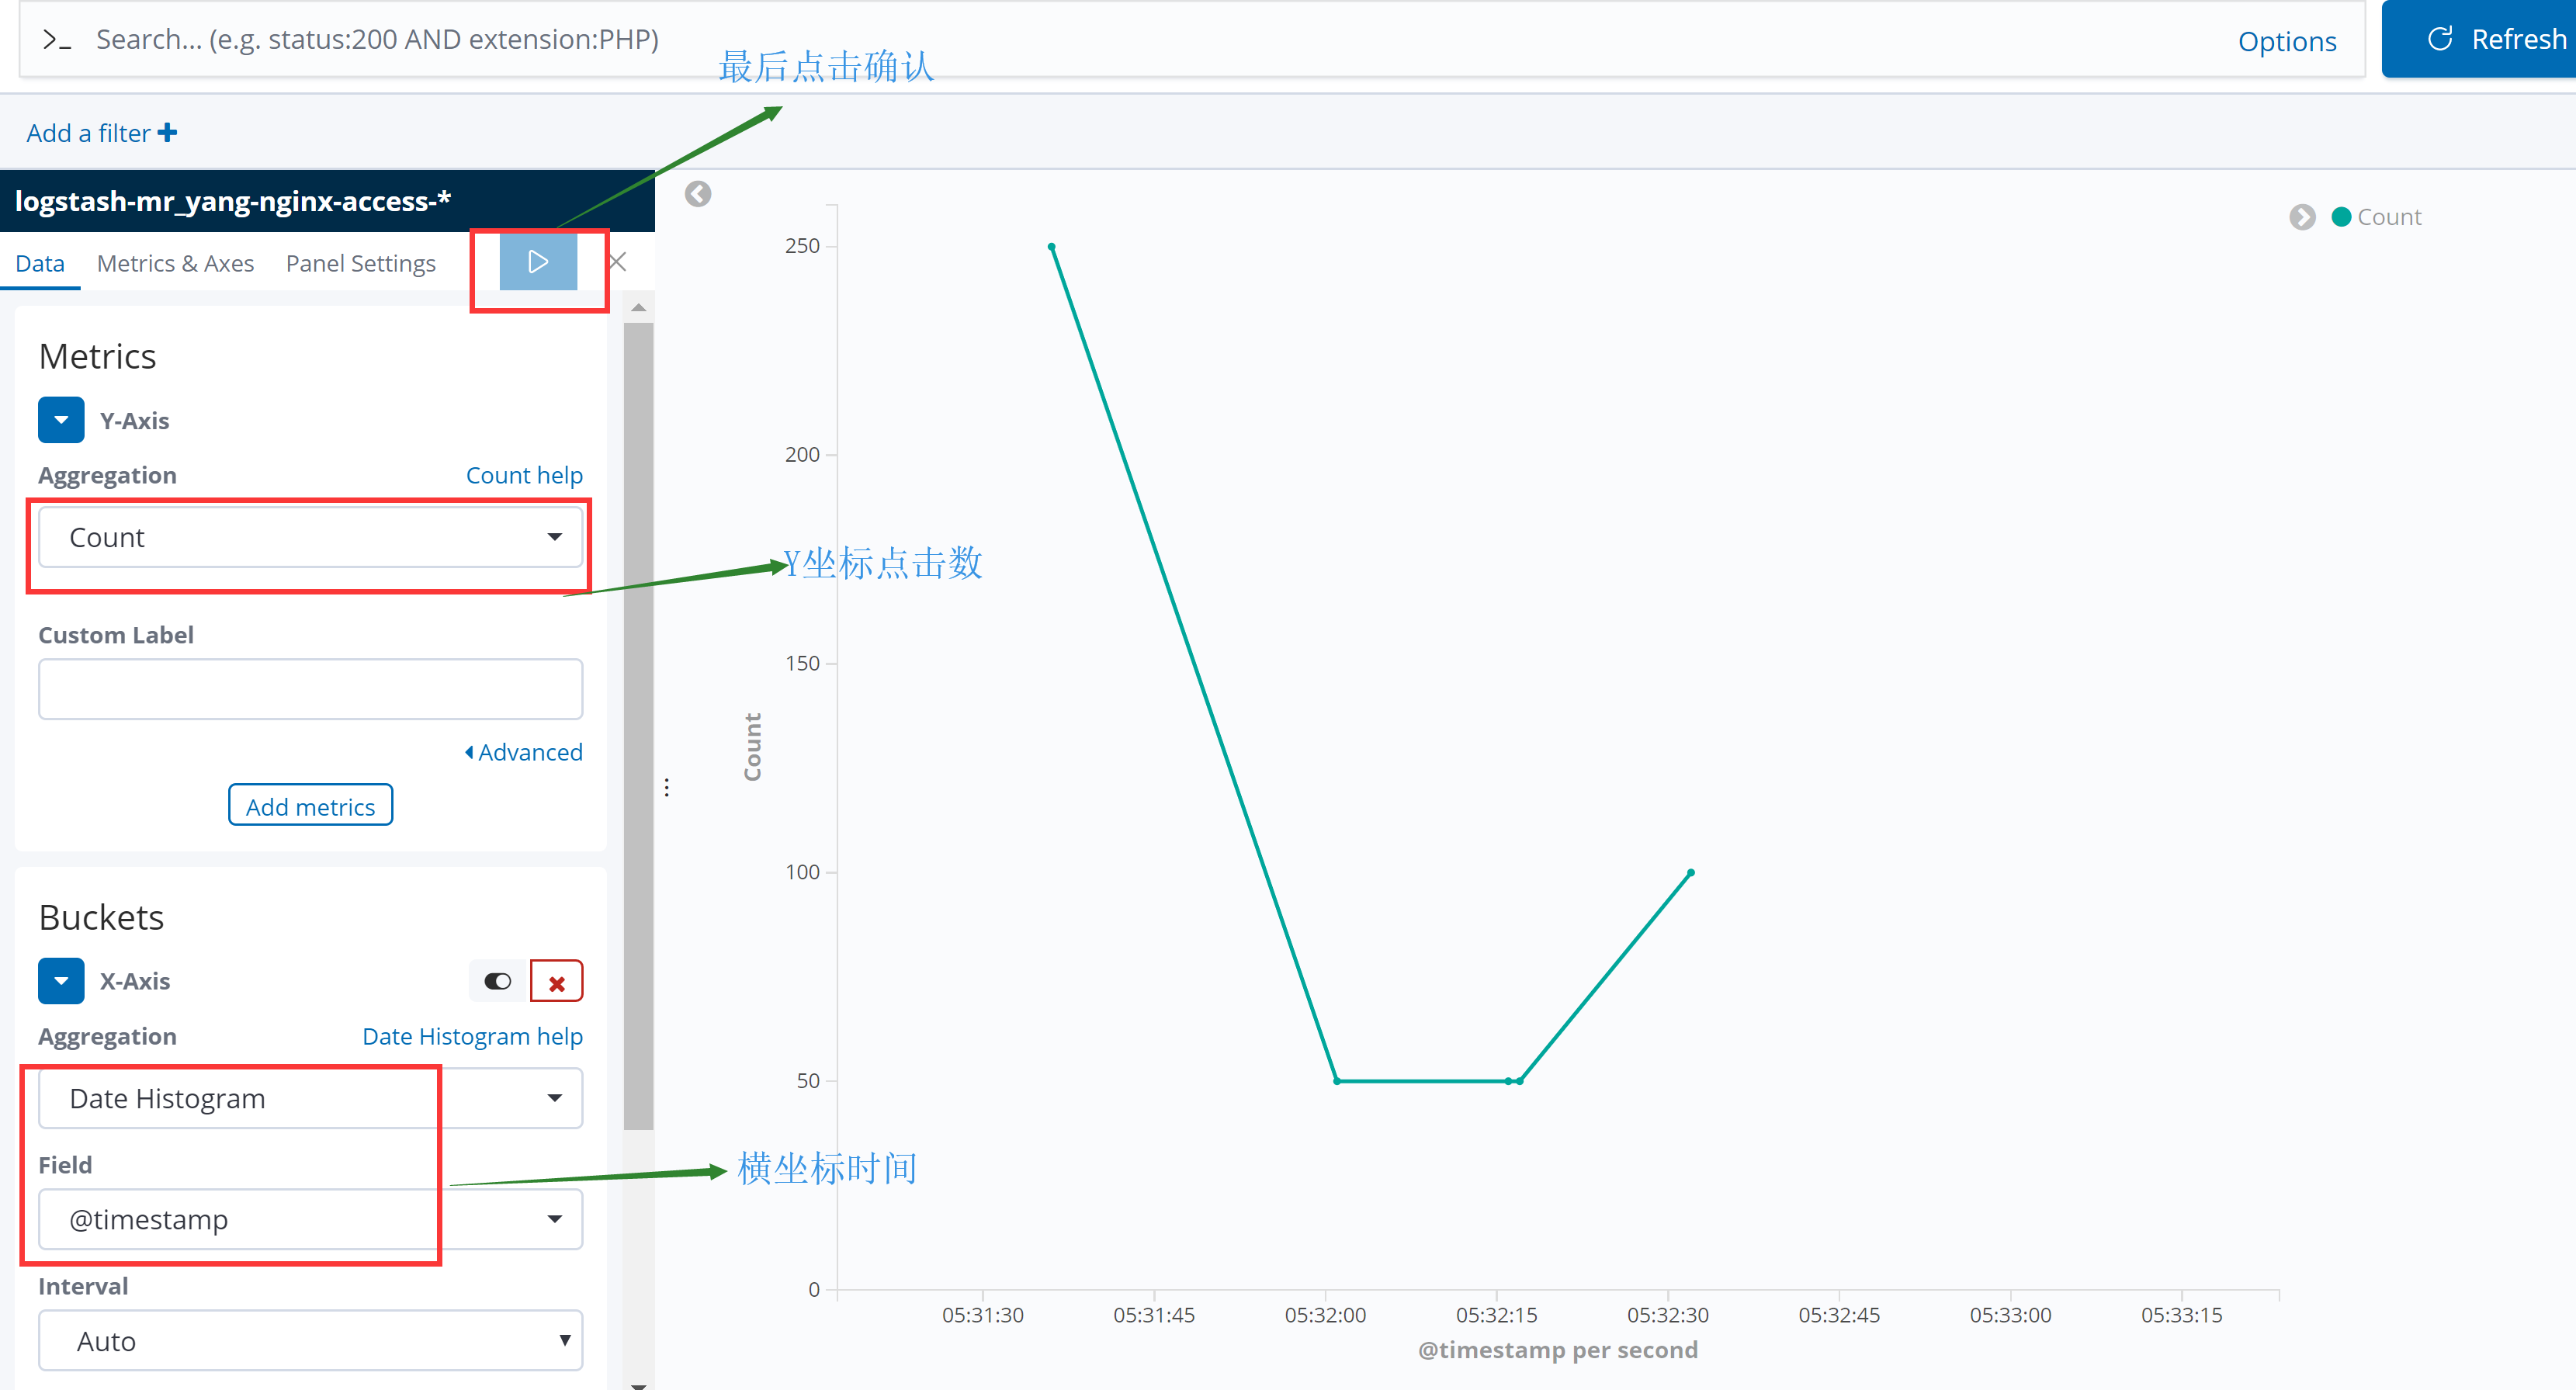
6.3.2 PV/IP
统计pv其实就是统计单位时间内的访问量

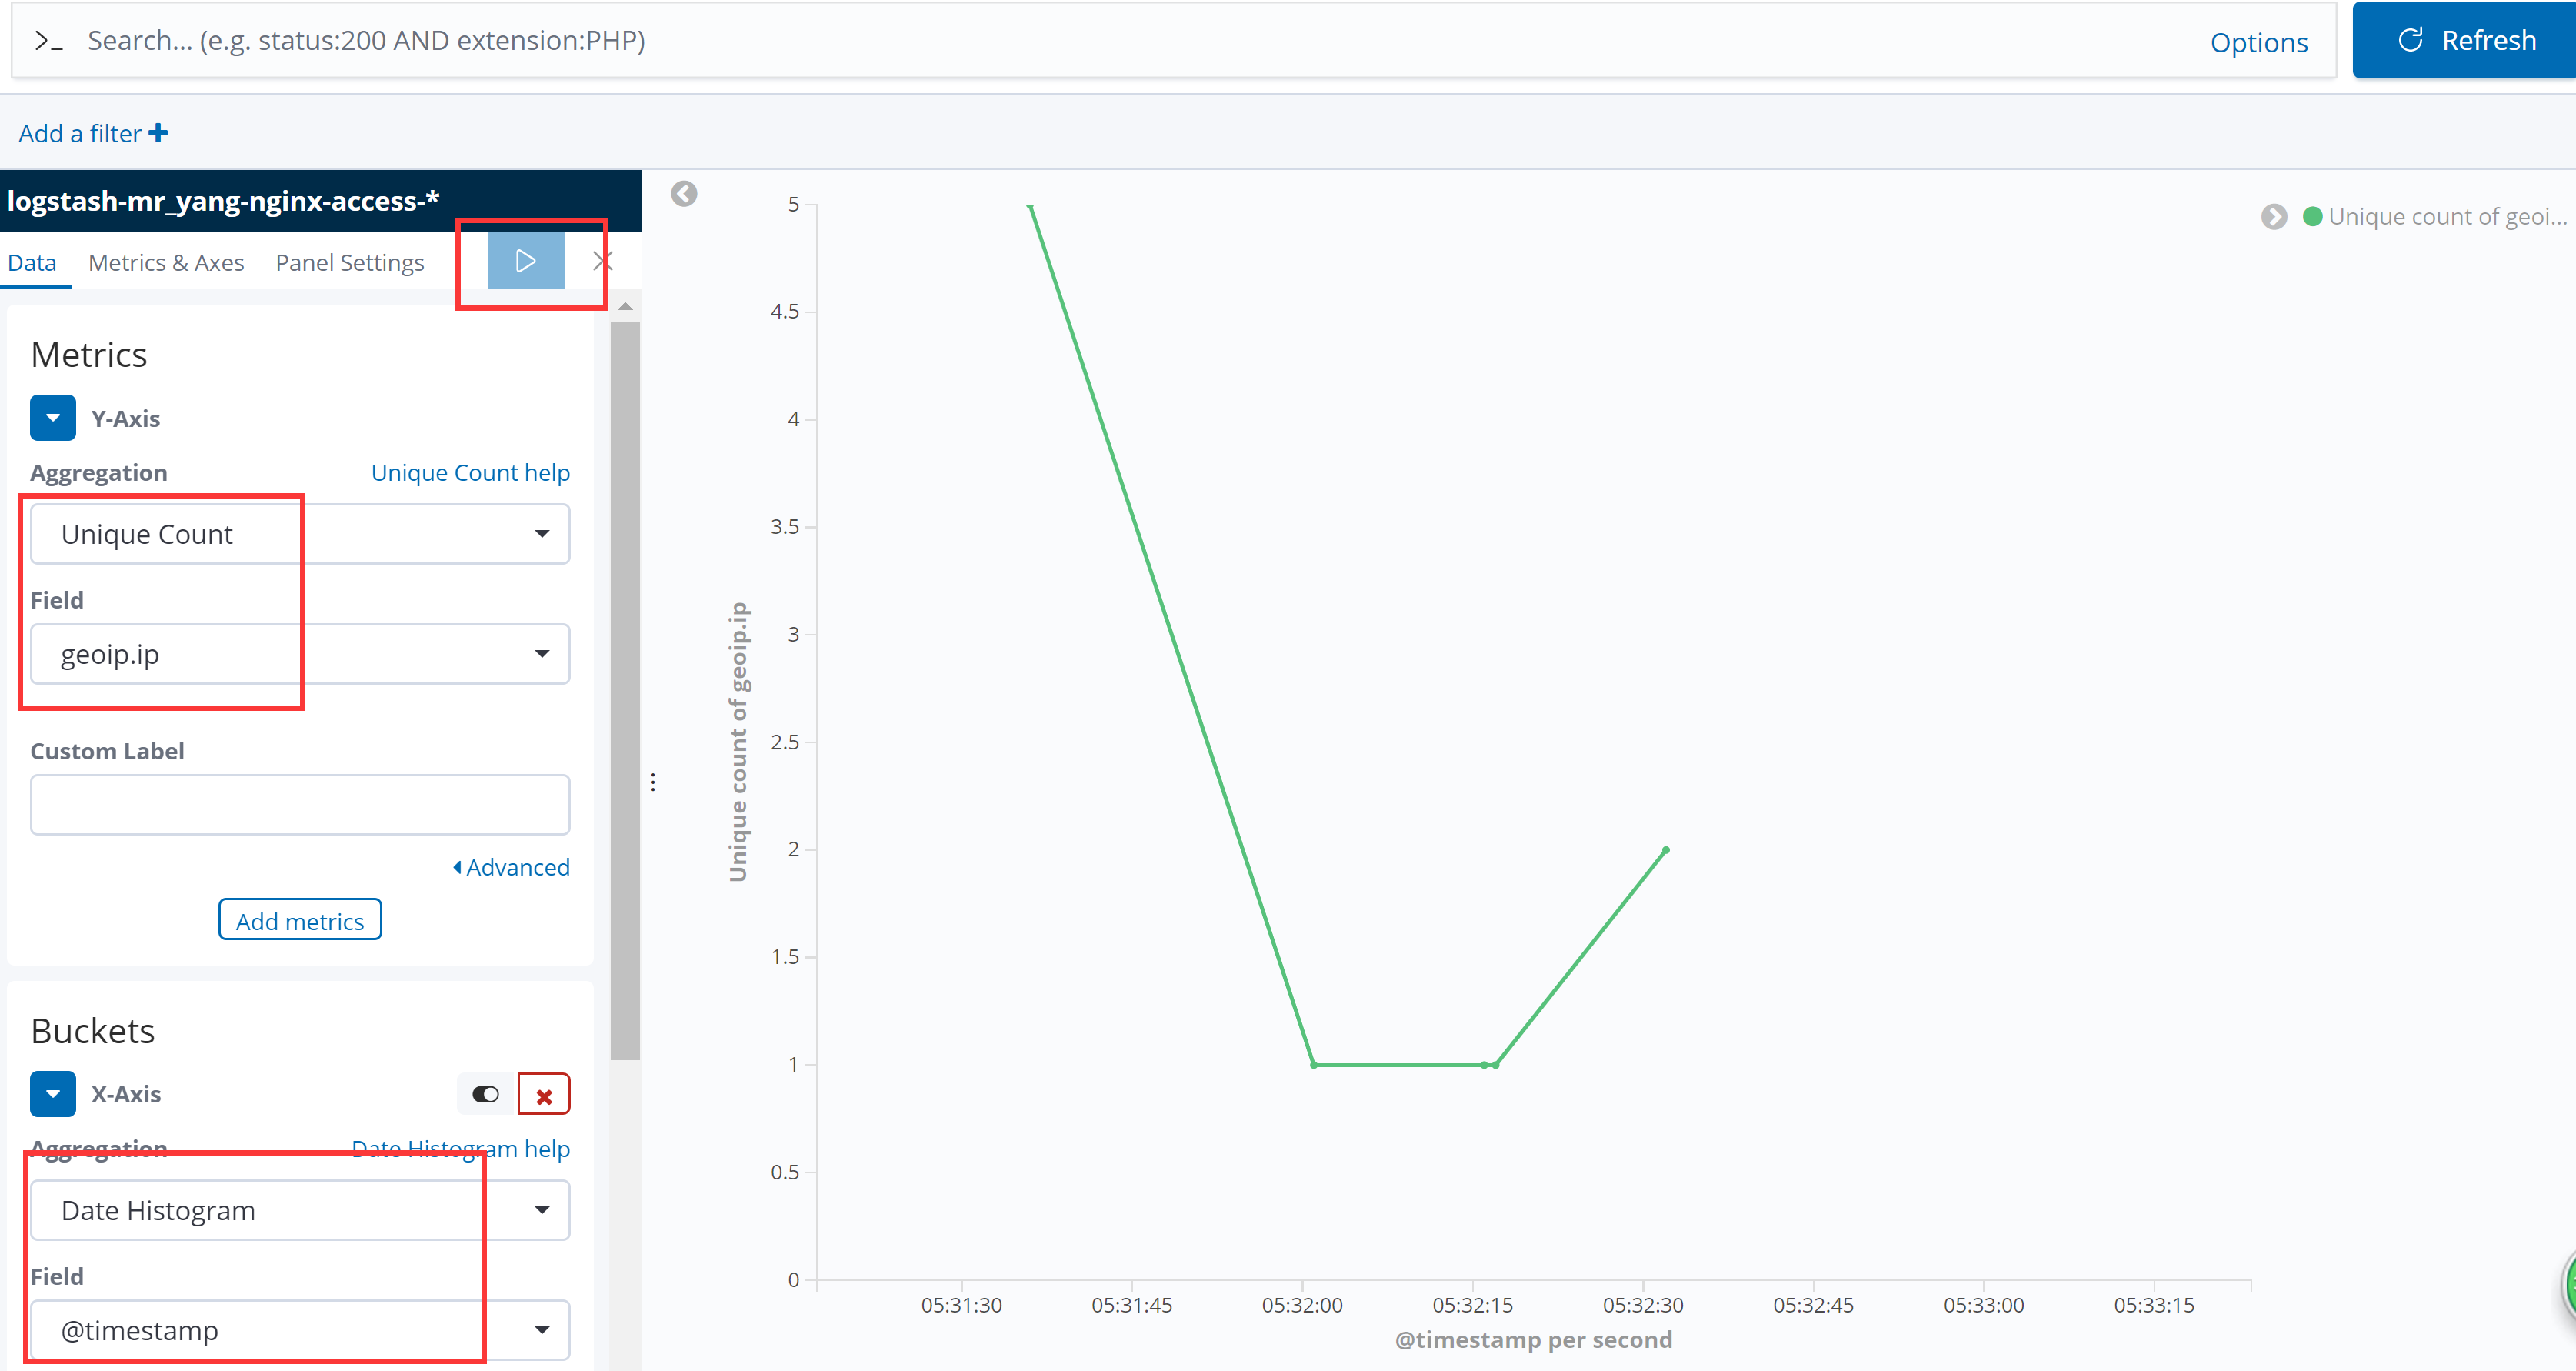
6.3.3 统计IP其实就是统计去重复以后的访问IP数
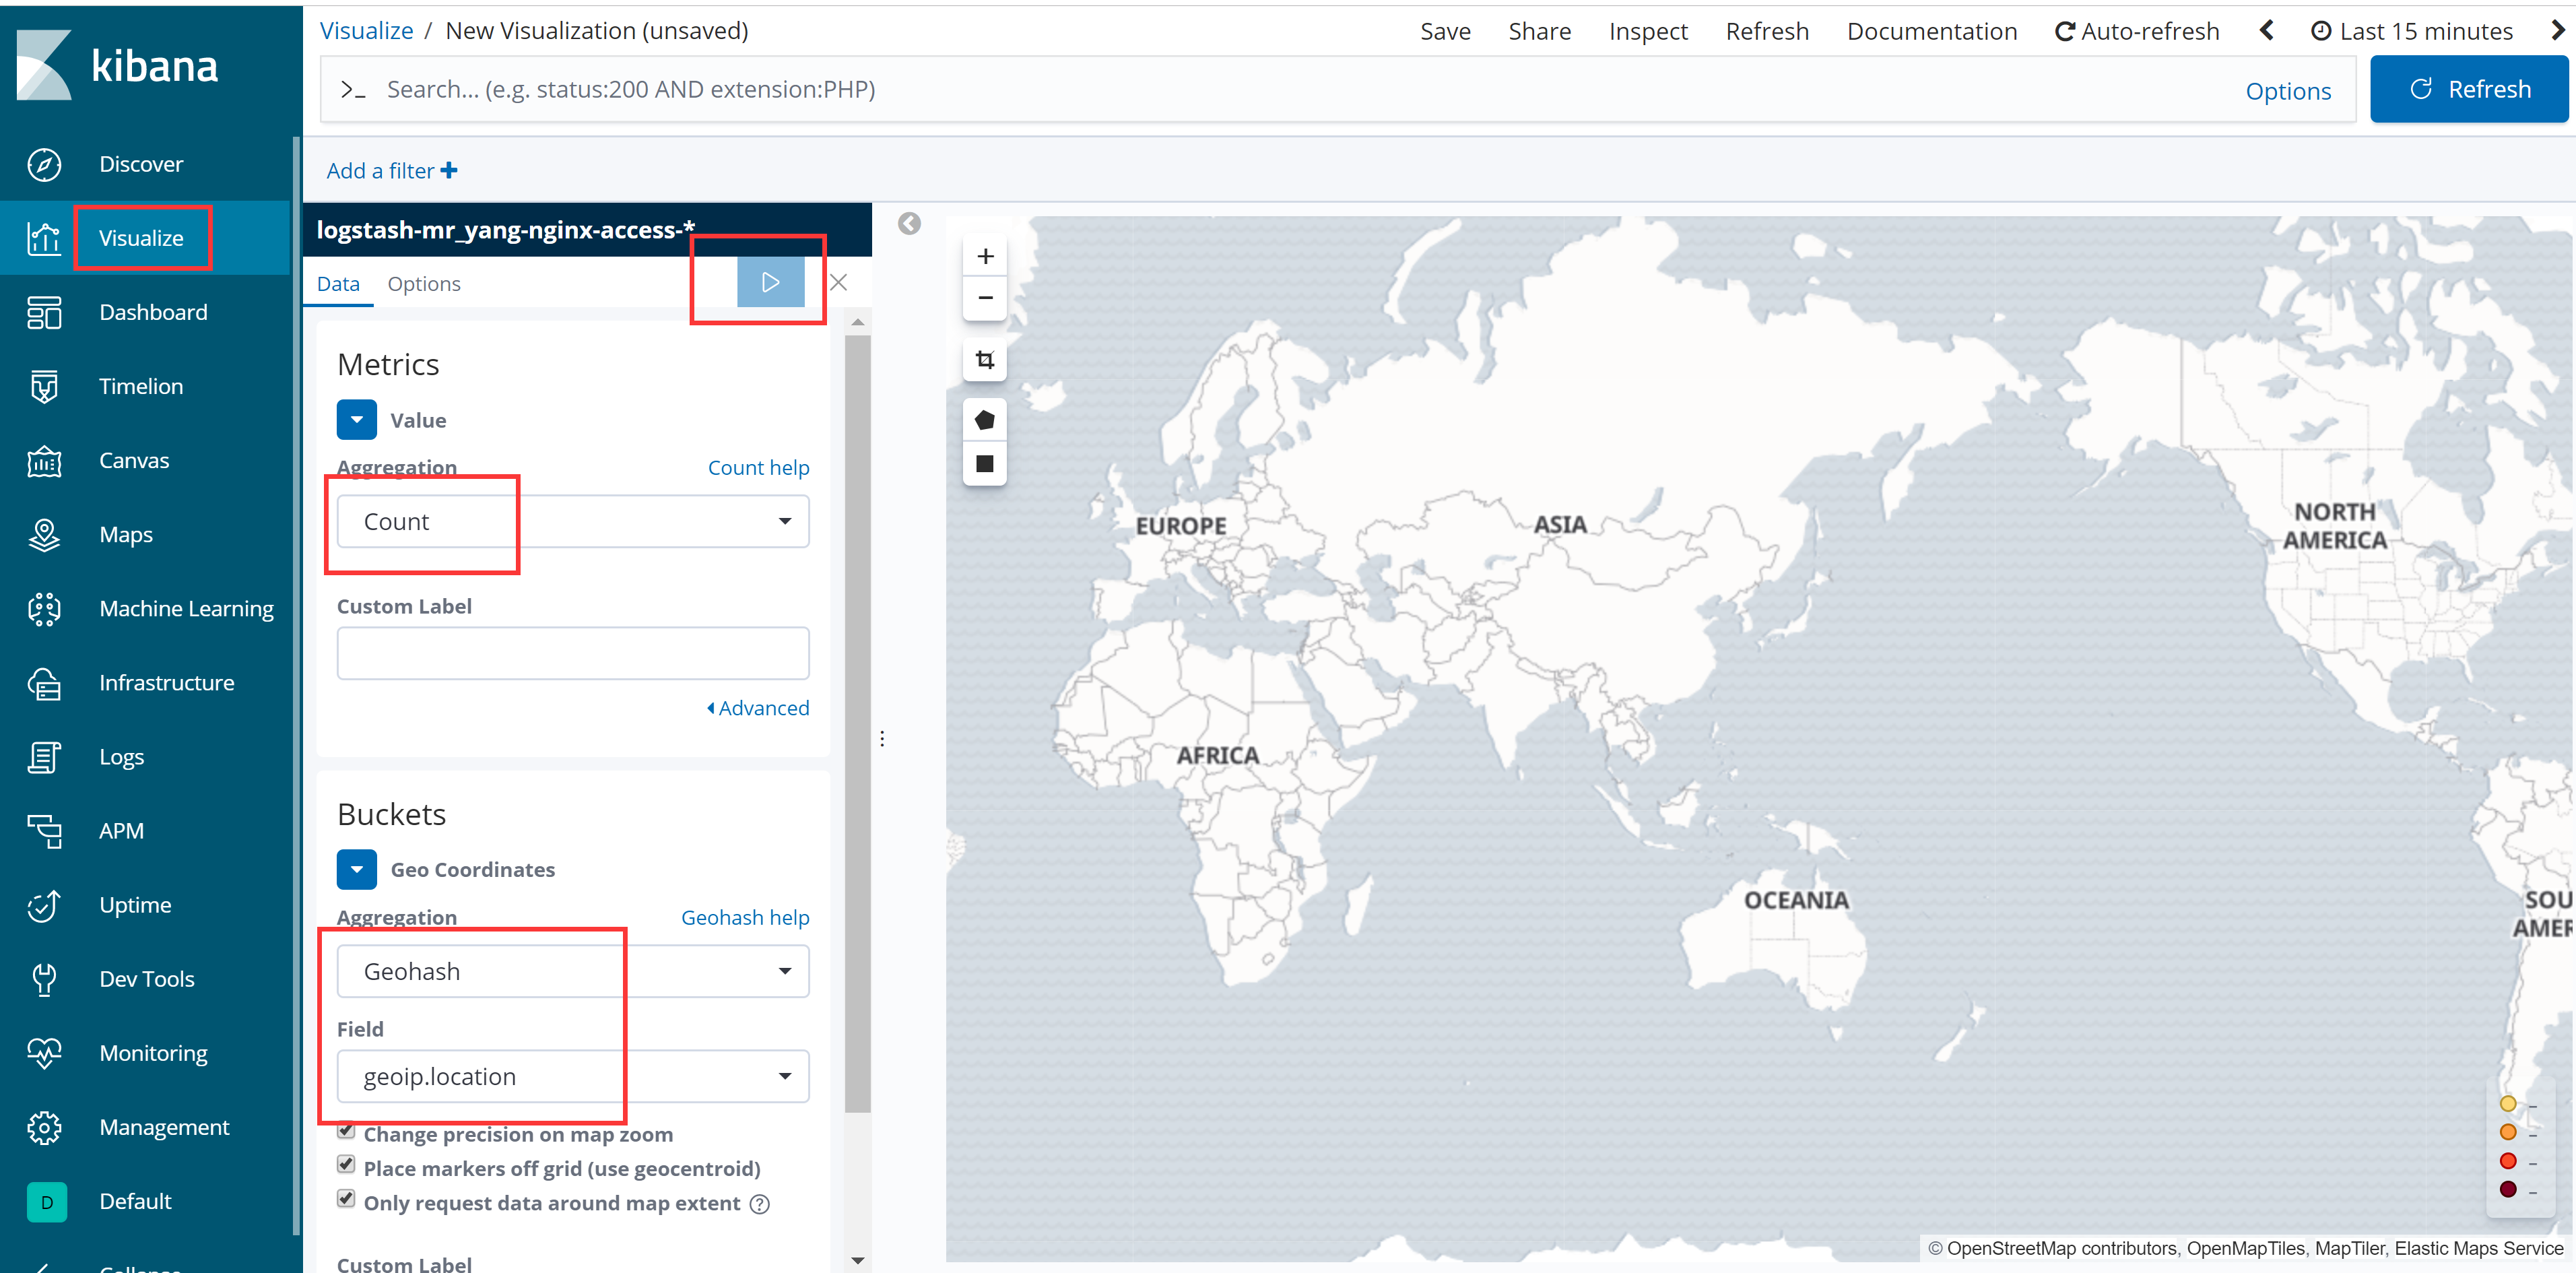
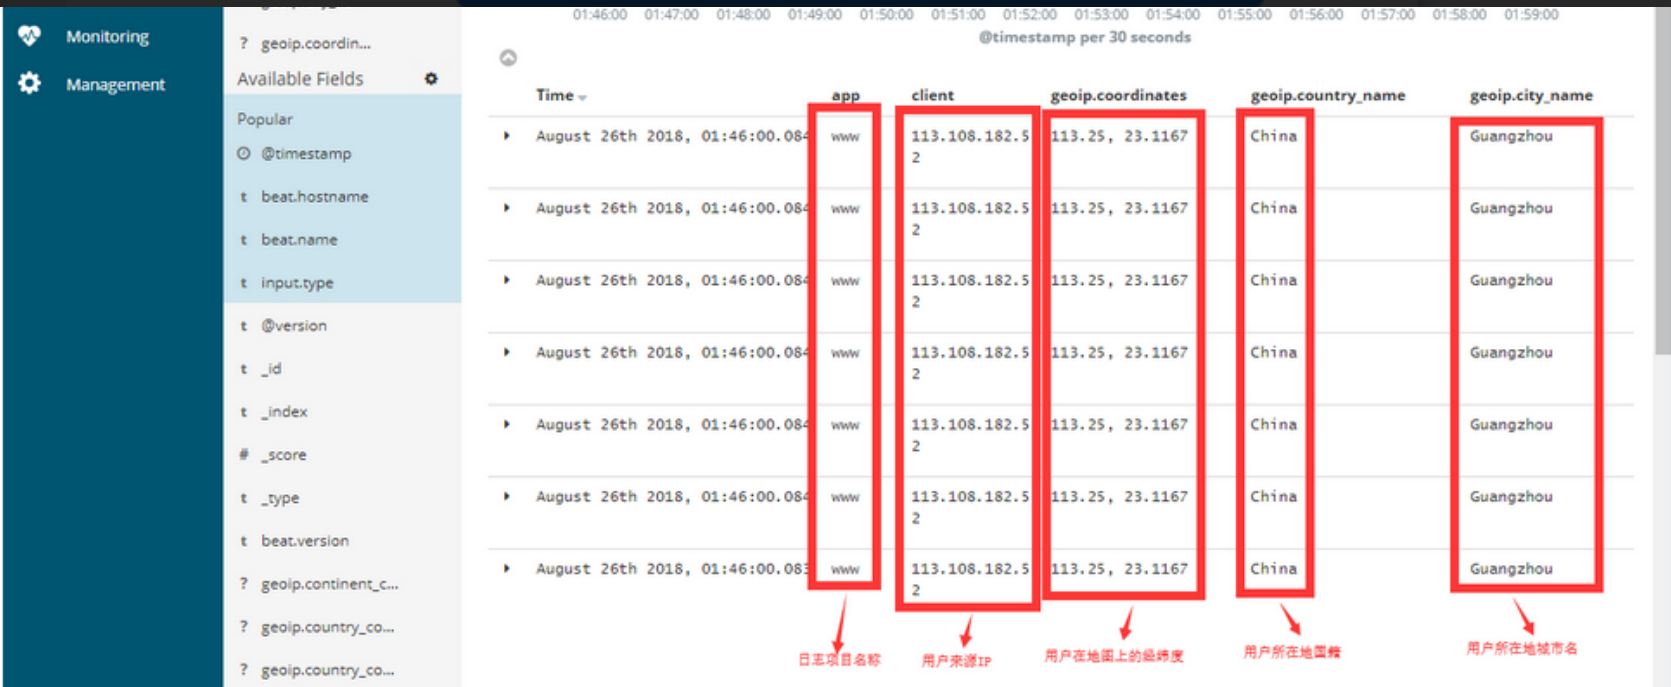
6.3.4 用户地理位置分布