zoukankan      html  css  js  c++  java
  • Echarts 系列之饼图的相关配置

    本文主要针对饼图进行相关的自定义配置。

    饼图常用配置如下:

    名称效果
    name 图标名称
    type 指明图形的类型'pie','line'等
    hoverAnimation 鼠标hover是否需要动画
    radius 饼图的半径,数组的第一项是内半径,第二项是外半径
    center 饼图的中心(圆心)坐标,数组的第一项是横坐标,第二项是纵坐标。
    label 饼图图形上的文本标签,可用于说明图形的一些数据信息
    labelLine 标签的视觉引导线样式
    data 渲染数据

    1、实现labelLine与图表的分离

    思路:同圆心,不同半径两个饼图叠加的方式实现,半径较小的只显示图,不显示引导线与label,半径较大的不显示图,只显示引导线与label,这样就可以形成分离状态。
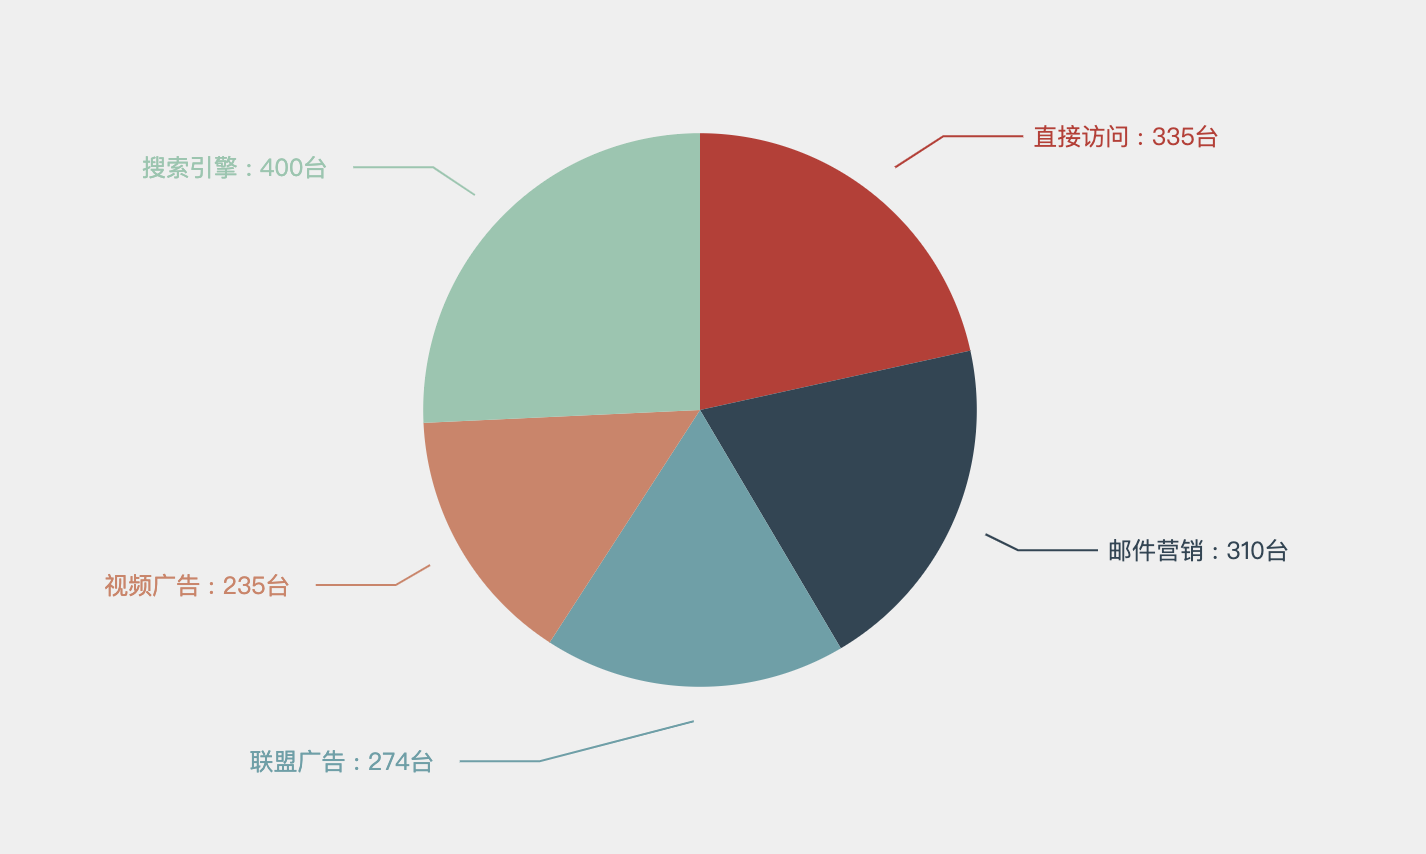
     实现代码如下:

     series: [{
                //半径
                radius: ['0%', '40%'],
                type: 'pie',
                label: {
                   //不显示文字
                    show: false
                },
                 labelLine: {
                    //不显示引导线
                    show: false
                },
                data: [
                    {value: 335, name: '直接访问'},
                    {value: 310, name: '邮件营销'},
                    {value: 274, name: '联盟广告'},
                    {value: 235, name: '视频广告'},
                    {value: 400, name: '搜索引擎'}
                ]
            },
            {
                radius: ['0', '45%'],
                type: 'pie',
                //文字样式显示
                label: {
                     normal:{
                        show: true,
                        formatter:'{b} : {c}台  ',
                    }
                },
                //引导线样式设置
                labelLine: {
                    smooth: 0,
                    length: 20,
                    length2: 40
                },
                itemStyle: {
                    //不显示饼图
                    opacity:0,
                },
                data: [
                    {value: 335, name: '直接访问'},
                    {value: 310, name: '邮件营销'},
                    {value: 274, name: '联盟广告'},
                    {value: 235, name: '视频广告'},
                    {value: 400, name: '搜索引擎'}
                ]
    
            }
        ]            

    2、实现label 在labelLine(引导线)上,且label自定义样式

    • hover时label、labelLine颜色改变
    • lable自定义颜色、位于labelLine上方
    • 饼图内边框与外边框设置

    重点属性:label 中的 formatter属性


    字符串模板 模板变量有:

    • {a}:系列名。
    • {b}:数据名,  即name。
    • {c}:数据值,即value。
    • {d}:百分比,  即数据所占的比例。

    拿下面的栗子说明一下:

    //{a|...} {b|...} 用于区分,区分的名字可以自定义,我这里直接使用了a、b、c;
    formatter: '{a|{c}} {c|台} {b|{b}} ',
    通过上面的格式可以通过rich分别对label设置样式,'
    '可以实现换行的效果,如果想让label位于labelLine上可以使用'
    
    '.
    rich: { 
           //value样式 a: { color:
    '#f3c773', //字体粗细 fontWeight: 'bold', //字体大小 fontSize: 45, //设置行高,如果上下挨的比较紧不美观时 lineHeight: 35, //水平方向:对其方向 align: 'center', //垂直方向 :对齐方式。这里因为同一行的字体大小不一致,小字体会向上显得不美观; verticalAlign: 'bottom', },
    //name样式 b: { color:
    '#e05932', fontWeight: 'bold', fontSize: 18, lineHeight: 40, align: 'center', },
              //小字体:台 c: { color:
    '#f3c773', fontWeight: 'bold', fontSize: 14, align: 'center', verticalAlign: 'bottom', }, }, //label偏离引导线时设置分别为:上、右、下、左; padding: [0, -90, 50, -90], },

    样式一:

     实现代码如下:

     series: [
            {
              name: '设备分布',
              type: 'pie',
              radius: ['55%', '85%'],
              center: ['50%', '50%'],
             // 饼图各部分颜色,部分数大于颜色数,就会循环使用这些颜色
              color: [
                'rgba(0,104,210,0.2)',
                'rgba(0,104,210,0.4)',
                'rgba(0,104,210,0.6)',
                'rgba(0,104,210,0.8)',
                'rgba(0,104,210,1)',
              ],
             // 如果要使用formatter属性 ,name 为数据项名称,value 为数据项值
              data:[
                    {value: 1, name: '桥西区'},
                    {value: 1, name: '宝安区'},
                    {value: 1, name: '福田区'},
                    ],
              //这里等一下单独说明
              label: {
                normal: {
                  show: false,
                  color: '#e05932',
                  formatter: '{a|{c}} {c|台} 
      {b|{b}} 
    
    ',
                  rich: {
                    a: {
                      color: '#f3c773',
                      fontWeight: 'bold',
                      fontSize: 45,
                      lineHeight: 35,
                      align: 'center',
                      verticalAlign: 'bottom',
                    },
                    b: {
                      color: '#e05932',
                      fontWeight: 'bold',
                      fontSize: 18,
                      lineHeight: 40,
                      align: 'center',
                    },
                    c: {
                      color: '#f3c773',
                      fontWeight: 'bold',
                      fontSize: 14,
                      align: 'center',
                      verticalAlign: 'bottom',
                    },
                  },
                  padding: [0, -90, 50, -90],
                },
              },
              labelLine: {
                show: false,
                //引导线颜色渐变
                lineStyle: {
                  color: {
                    type: 'linear',
                    colorStops: [
                      {
                        offset: 0,
                        color: 'rgb(56,27,18)',
                      },
                      {
                        offset: 0.5,
                        color: 'rgb(224,89,50)',
                      },
                      {
                        offset: 1,
                        color: 'rgb(56,27,18)',
                      },
                    ],
                  },
                  shadowColor: 'rgba(0, 0, 0, 0.5)',
                  shadowBlur: 10,
                   2,
                },
                smooth: 0,
                //第一条引导线长度
                length: 30,
                //第二条引导线长度
                length2: 100,
              },
              itemStyle: {
                shadowBlur: 200,
                shadowColor: 'rgba(0, 0, 0, 0.5)',
              },
              emphasis: {
                label: {
                  //hover时显示引导线
                  show: true,
                },
                labelLine: {
                  //hover时显示引导线
                  show: true,
                },
                itemStyle: {
                 //hover时改变 饼图部分颜色(这里是渐变)
                  color: new echarts.graphic.LinearGradient(0.2, 1, 0.2, 0, [
                    { offset: 0, color: 'rgba(243,199,115,0.7)' },
                    { offset: 0.7, color: 'rgba(200,140,82,0.7)' },
                    { offset: 1, color: 'rgba(167,87,42,0.7)' },
                  ]),
                },
              },
    
              animationType: 'scale',
              animationEasing: 'elasticOut',
              animationDelay(idx) {
                return Math.random() * 200;
              },
            },
            {
              type: 'pie',
              //内边框
              radius: ['54.2%', '55%'],
              center: ['50%', '50%'],
              // 鼠标移入变大
              hoverAnimation: false, 
              //整圆
              data: [100],
              label: {
                show: false,
              },
            },
            {
              type: 'pie',
              //外边框
              radius: ['84.2%', '85%'],
              hoverAnimation: false,
              center: ['50%', '50%'],
              data: [100],
              label: {
                show: false,
              },
            },
          ],        

    样式二:
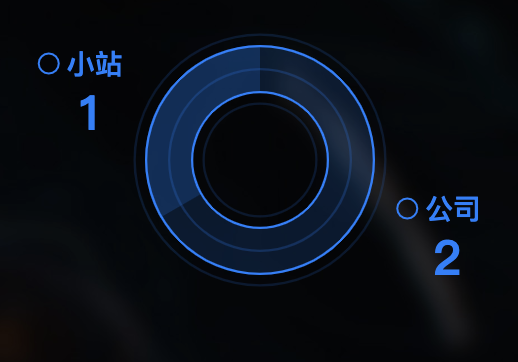
    实现代码如下:

    label: {
                normal: {
                  show: true,
                  formatter: ' {c|} {a|{b}} 
      {b|{c}}',
                  rich: {
                    a: {
                      color: '#157dff',
                      fontWeight: 'bold',
                      fontSize: 14,
                      lineHeight: 25,
                      align: 'center',
                    },
                    b: {
                      color: '#157dff',
                      fontWeight: 'bold',
                      fontSize: 24,
                      align: 'center',
                    },
                    //自定义圆圈,类似于css画圆
                    c: {
                      height: 10,
                       10,
                      lineHeight: 10,
                      borderWidth: 1,
                      borderColor: '#157dff',
                      borderRadius: 10,
                    },
                  },
                 //有时label 会偏离饼图,不太美观,这个属性可以调整一下
                  padding: [0, -15],
                },

    echarts的配置很多,功能也很强大。希望这篇随笔能帮到大家,也是我自己学习的积累~

  • 相关阅读:
    Spring Boot 使用 Dom4j XStream 操作 Xml
    Spring Boot 使用 JAX-WS 调用 WebService 服务
    Spring Boot 使用 CXF 调用 WebService 服务
    Spring Boot 开发 WebService 服务
    Spring Boot 中使用 HttpClient 进行 POST GET PUT DELETE
    Spring Boot Ftp Client 客户端示例支持断点续传
    Spring Boot 发送邮件
    Spring Boot 定时任务 Quartz 使用教程
    Spring Boot 缓存应用 Memcached 入门教程
    ThreadLocal,Java中特殊的线程绑定机制
  • 原文地址:https://www.cnblogs.com/yy136/p/12844443.html
Copyright © 2011-2022 走看看