zoukankan      html  css  js  c++  java
  • Echarts 系列之折线图、柱状图相关配置

    本文主要介绍折线图、柱状图的自定义样式相关配置。

    1、柱状图实现背景柱子
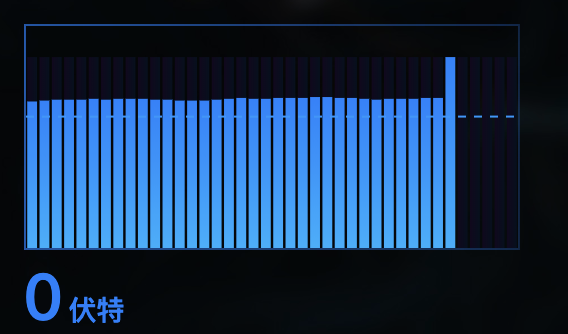
    代码实现如下:

    series: [
            {
              type: 'bar',
              tooltip: {
                show: false,
              },
              itemStyle: {
                //背景渐变
                normal: {
                  color: {
                    type: 'linear',
                    colorStops: [
                      { offset: 0, color: 'rgba(18,7,30,1)' },
                      { offset: 1, color: 'rgba(5, 16, 30, 1)' },
                    ],
                  },
                },
              },
              silent: true,
              //柱子做背景的时候有用
              barGap: '-100%',
              //高度可根据自己的实际情况制定
              data:[],
            },
            {
              name: 'title',
              type: 'bar',
              itemStyle: { 
               //柱图渐变
                normal: {
                  color: new echarts.graphic.LinearGradient(0, 0, 0, 1, [
                    { offset: 0, color: '#1580ff' },
                    { offset: 0.5, color: '#1596ff' },
                    { offset: 1, color: '#15afff' },
                  ]),
                },
              },
              //自己的真是数据
              data:[],
            },
          ],

    2、自定义标线

    名称 效果
    symbol 标线两端的标记类型
    label 标线的文本
    lineStyle 标线的样式:颜色、类型、宽度等设置
    data 标线的数据,具体可查看官网
      markLine: {
              silent: true,
              data: [
              //数据的平均值作为基线
                {
                  type: 'average',
                },
              ],
             //标线的两端不设置标志
             symbol: ['none', 'none'],
      },

    注意:如果加入配置后未出现标线,检查一下是否引入 标线的配置!!

    3、折线图渐变
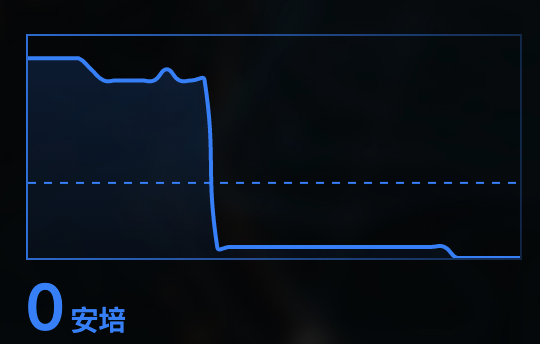
    名称效果
    itemStyle 图形样式(3.0内部必须加入normal)
    areaStyle 区域填充样式。

    实现代码如下:

    series: [
            {
              name: 'XXX',
              //默认颜色
              color: ['#157dff'],
              //数据自定义,我这里只是变量
              data:values,
              type: 'line',
             //不加标记点
              symbol: 'none',
              //曲线平滑
              smooth: true,
              //区域渐变
              areaStyle: {
                normal: {
                  color: new echarts.graphic.LinearGradient(0, 0, 0, 1, [
                    {
                      offset: 0,
                      color: 'rgba(0,104,210,0.3)',
                    },
                    {
                      offset: 1,
                      color: 'rgba(0,104,210,0.1)',
                    },
                  ]),
                },
              },
            },
          ],

    4、图标充满整个容器,加上好看的边框(如:上图)。

    //容器
    <div className={styles['chart-left-one']} ref={this.chartLeftOneRef}/><div>
    //图表铺满整个容器
    grid: {
      left: '0',
      right: '0',
      top: '0',
      bottom: '0',
      height: 'auto',
    },
    xAxis: {
      type: 'category',
      boundaryGap: false,
      //不显示X轴
      show: false,
      data: keys,
    },
    yAxis: {
      type: 'value',
      //不显示Y轴
      show: false,
    },
     .chart-left-one {
              width: 100%;
              height: 70%;//容器宽高自定义
              //容器加边框
              border: 1px solid;
              //边框样式
              border-image: linear-gradient(
                  -90deg,
                  rgba(21, 125, 255, 0.2),
                  rgba(21, 125, 255, 0.9)
                )
                30 30;
      }    

     (完)

  • 相关阅读:
    将才和帅才之的区别
    百胜集团XX:BPM实现业务流程全过程无缝链接(案例)
    心、肝、脾、肺、肾五脏解说+ 五脏六腑的作用
    人体的五行属性
    易经卦的通例
    《孙子兵法》中的企业领导艺术和方法
    五行盘谱
    大容量高并发性服务器组的技术解析
    中华哲学的领导艺术
    如何在WINDOW环境下搭建ActivateMQ和zookeeper集群环境
  • 原文地址:https://www.cnblogs.com/yy136/p/12883954.html
Copyright © 2011-2022 走看看