propertiesPie() {
      if (this.Properties.length > 0) {
        _document.getElementById("properties").innerHTML =
          '<div id="propertiesPie" style="100%;height:100%;"></div>';
        let series = this.Properties;
        let myChart = echarts.init(_document.getElementById("propertiesPie"));

        let option = {
          title: [],
          color: ["#bf61d4", "#03a9f4", "#2fc25b", "#fbc02d"],
          tooltip: {
            trigger: "item",
            formatter: "{a} <br/>{b} : {c} ({d}%)"
          },
          series: []
        };

        for (let i = 0; i < series.length; i++) {
          option.title[i] = {
            text: "{pp|" + series[i].text + "}",
            left: (i + 1) * 19 - 4 + "%",
            y: "10%",
            textStyle: {
              fontSize: 15,
              rich: {
                pp: {
                  fontWeight: "bold",
                  fontSize: 15,
                   "9",
                  align: "center"
                }
              }
            },
            // textAlign:"left",
            subtext: "{pp|" + series[i].count + "}",
            itemGap: 200,
            subtextStyle: {
              fontSize: 15,
              color: "black",
              verticalAlign: "bottom",
              rich: {
                pp: {
                  fontSize: 15,
                  fontWeight: "bold",
                   "9",
                  align: "center"
                }
              }
            }
          };
          option.series[i] = {
            name: "党员分布",
            type: "pie",
            center: [(i + 1) * 19 + "%", "50%"],
            radius: [40, 55],
            // x: i * 20 + '%', // for funnel
            label: {
              normal: {
                formatter: function(params) {
                  return params.percent + "%";
                }
              }
            },
            labelLine: {
              show: false
            },
            data: [
              {
                name: series[i].text,
                value: series[i].count,
                label: {
                  normal: {
                    position: "center",
                    fontSize: 15,
                    fontWeight: "bold"
                  }
                }
              },
              {
                name: "",
                value: series[i].total - series[i].count,
                label: {
                  normal: {
                    show: false
                  }
                },
                itemStyle: {
                  normal: {
                    color: "#ccc"
                  }
                }
              }
            ]
          };
        }
        myChart.setOption(option);
      } else {
        var html = '<div class="nodata"><img src=' + require("../../../../assets/images/nodata.png") + "></div>";
        _document.getElementById("properties").innerHTML = html;
        _document.getElementById('properties').removeAttribute('_echarts_instance_'); //echarts_instance_不能创建多个实例,所以需删除。否则无法显示有数据的界面。
} },
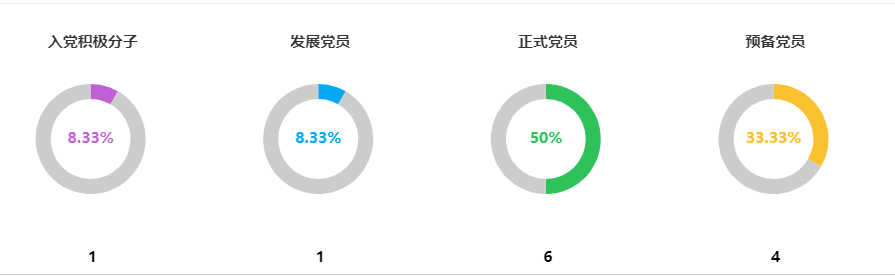
如图: