http://blog.itpub.net/28916011/viewspace-1971933/
percona监控mysql的几张图形解释
最近,我仔细研究了一下percona监控mysql的几张图的含义。
Com_XXX表示每个XXX语句执行的次数如:
Com_select 执行select操作的次数,一次查询只累计加1
Com_update 执行update操作的次数
Com_insert 执行insert操作的次数,对批量插入只算一次。
Com_delete 执行delete操作的次数
只针对于InnoDB存储引擎的操作次数:

Innodb_rows_deleted 从InnoDB表删除的行数。
Innodb_rows_inserted 插入到InnoDB表的行数。
Innodb_rows_read 从InnoDB表读取的行数。
Innodb_rows_updated InnoDB表内更新的行数。
上图数据来源于: show global status like '%innodb_row%'InnoDB semaphore

The InnoDB Semaphores graph shows information on InnoDB semaphore activity: the number of spin rounds, spin
waits, and OS waits. You might see these graphs spike during times of high concurrency or contention. These graphs
basically indicate different types of activity involved in obtaining row locks or mutexes, which are causes of poor
scaling in some cases.
上面数据来源于:
mysql> show engine innodb status G;
SEMAPHORES(信号量)
OS WAIT ARRAY INFO: reservation count 6428579
OS WAIT ARRAY INFO: signal count 6391102
Mutex spin waits 10807638, rounds 51362184, OS waits 1135246
RW-shared spins 5183147, rounds 154424701, OS waits 5133668
RW-excl spins 187041, rounds 4866289, OS waits 132629
Spin rounds per wait: 4.75 mutex, 29.79 RW-shared, 26.02 RW-excl
czxin注释:"spin waits" 和 "spin rounds" 的数量。相较于系统等待,自旋锁是低成本的等待;不过它是一个活跃的等待,会浪费一些cpu资源。因此如果看到大量的自旋等待和自旋轮转,则很显然它浪费 了很多cpu资源。浪费cpu时间和无谓的上下文切换之间可以用 innodb_sync_spin_loops 来平衡。
reservation count" 和 "signal count" 显示了 innodb 使用内部同步阵列的活跃程度 - 时间片(slot)分配以及线程信号使用同步阵列的频繁程度。这些统计信息可以用于表示 innodb 回退到系统等待的频率。还有关于系统等待的直接相关信息,可以看到"OS Waits"的互斥信号灯(mutexes),以及读写锁。这些信息中显示了互斥锁和共享锁。系统等待和 "保留(reservation)" 不完全一样,在回退到用 sync_array 的复杂等待模式前,innodb 会尝试 "输出(yield)" 到系统,希望下一次调度时间对象里命名线程已经释放了。系统等待相对较慢,如果每秒发生了上万次系统等待,则可能会有问题。另一个观察方法是查看系统状态 中的上下文(context)交换频率。
锁资源
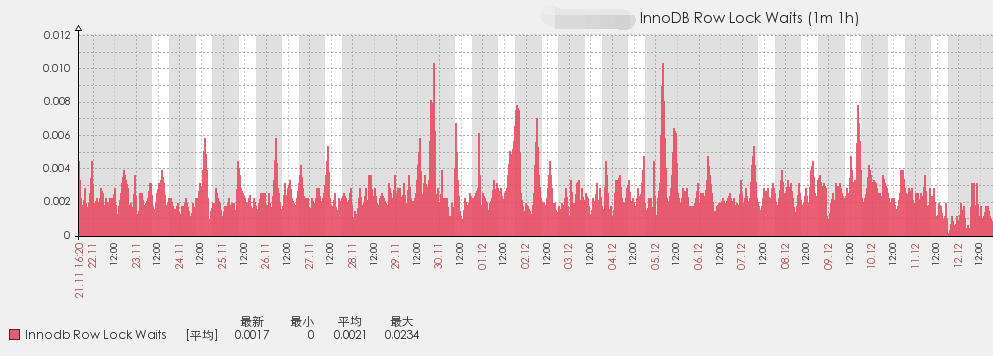
上图表示行锁的等待。
innodb_lock_wait 指的是不能立即获取行锁而需要等待的次数/每秒。
上图的数据来源于show global status like 'innodb_lock_wait'
MySQL table locks

上图表示的是表级锁的等待
Table_locks_immediate 指的是能够立即获得表级锁的次数/每秒,
Table_locks_waited指的是不能立即获取表级锁而需要等待的次数/每秒。
上图数据来源于show global status like '%table_lock%'
Innodb table in use
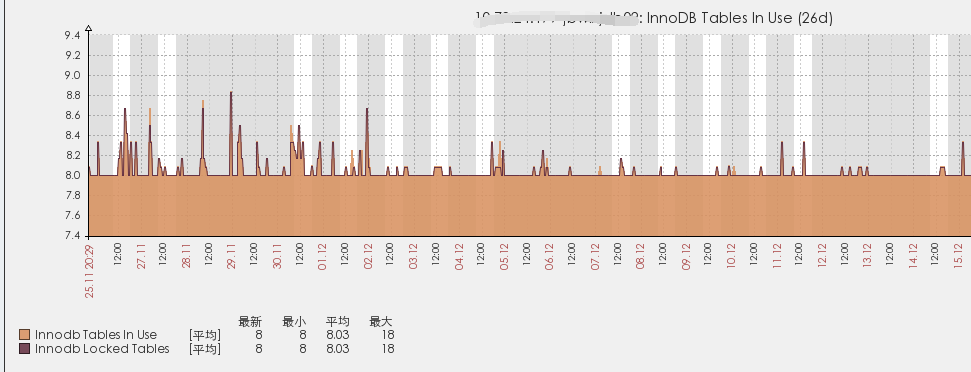
The InnoDB Tables In Use graph shows how many tables InnoDB has in use and how many are locked. If there are
spikes in these graphs, you’ll probably also see spikes in LOCK WAIT and other signs of contention amongst queries.
spikes in these graphs, you’ll probably also see spikes in LOCK WAIT and other signs of contention amongst queries.
上面的innodb tables in use和innodb locked tables两个参数值来自于show engine innodb status G;搜索 table即可找到。注意这两个值不是每秒的值,而是真实值。