Debugging a SQL Server query with WinDbg
In my last blog posting I gave you a general introduction to WinDbg, and told you how you can attach the debugger to SQL Server. In today’s blog posting, we will go into a little more detail, and I will show you the steps you need to live debug a SQL Server query with WinDbg. Sound interesting to you? Let’s start!
Imagine you have a simple SQL query in front of you, and you want to debug that specific query within WinDbg. Sounds like a trivial task, but as soon as you start thinking about it, various questions arise:
- How can I identify the correct worker thread within WinDbg, on which my specific query is executed?
- Where within sqlservr.exe should I set a breakpoint?
Let’s concentrate on both questions in a little bit more detail.
Identifying the correct worker thread
When you execute a query within SQL Server, you have by default no idea which thread that query runs on. Fortunately SQL Server provides us with column os_thread_id in the DMVsys.dm_os_threads. That’s the ID of the OS thread that executes a specific query. Unfortunately you need to join between multiple tables to get from sys.dm_exec_requestsdown to sys.dm_os_threads. Let’s have a look at the following query.
|
1
2
3
4
5
6
7
|
SELECT R.Session_Id, Th.os_thread_id FROM sys.dm_exec_requests R
JOIN sys.dm_exec_sessions S ON R.session_id = S.session_id
JOIN sys.dm_os_tasks T ON R.task_address = T.task_address
JOIN sys.dm_os_workers W ON T.worker_address = W.worker_address
JOIN sys.dm_os_threads Th ON W.thread_address = Th.thread_address
WHERE S.is_user_process = 1
GO
|
~~[tid]s
The place holder value tid is the actual OS thread ID – as a hex value. Therefore you have to convert the value of the column os_thread_id from sys.dm_os_threads to a hex value, and use it with the above mentioned command. When your OS thread ID is 4910, you would use the following WinDbg command to switch to the correct thread:
~~[132E]s
sys.dm_os_threads only shows you the OS thread ID for your query, when your query is running. Therefore the next question arises: how can I get the *current* OS thread ID for an executing query? I’m using here a simple trick here: in the first step I’m running a simple WAITFOR DELAYcommand (e.g. 1 minute), and afterwards I’m running the actual query. If you use this approach, you have to make sure to submit both T-SQL queries to SQL Server within 1 batch. Otherwise the SQL OS scheduler may put the WAITFORstatement and your actual query on 2 different threads! Let’s have a look at the actual code:
|
1
2
3
4
5
6
7
8
9
10
|
WAITFOR DELAY '00:01:00'
SELECT
soh.*,
d.*
FROM Sales.SalesOrderHeader soh
INNER JOIN Sales.SalesOrderDetail d ON soh.SalesOrderID = d.SalesOrderID
WHERE soh.SalesOrderID = 71832
AND d.SalesOrderDetailID = 111793
GO
|
During the wait interval you have to perform the following actions:
- Retrieve in a different session the OS thread ID for your (waiting) query from sys.dm_os_threads
- Convert the OS thread ID to a hex value
- Break sqlservr.exe with CTRL + BREAK
- Switch to the correct OS thread with the command ~~[tid]s
- Set a breakpoint on the specific thread
- Continue the execution of sqlservr.exe
- Wait until the breakpoint is reached
You have to perform all these actions within the delay that you are causing with the WAITFOR DELAY statement. If you take longer, that approach will not work reliably. Therefore I sugest that you wait a little bit longer in the beginning with the WAITFOR DELAY statement, until you have some experience with that approach.
Setting a “good” breakpoint within sqlservr.exe
You have now retrieved the OS thread ID fromsys.dm_os_threads, and you have suspended the execution ofsqlservr.exe with WinDbg. In the next step you have to set a breakpoint within sqlservr.exe, so that you can debug and single-step through your query. But what is a good break point? It depends ;-). Every operator in an execution plan is implemented as a separate C++ class, which contains different functions. One well-known function is GetRow, which returns one row to the upstream iterator in the execution. My approach is the following one: trying to set a breakpoint in one of the left-most iterators in the execution plan. As far as I have seen from my experiments, every SELECT query starts with a function call tosqlmin!CQueryScan::GetRow.
Setting a breakpoint on that specific class and function should work very well for the beginning. Of course it will take you a very long time (when single-stepping through the code) until you hit interesting parts of the SQL Server Engine, like the B-Tree Manager, or the Latching/Spinlocking implementation. But for the first few experiments you should be fine with a breakpoint on that specific function. You have to make sure to set the breakpoint on the correct thread because you just want to debug your specific query, and nothing else! Setting a breakpoint on a specific thread and symbol name is done with the bm command:
~tid bm sqlmin!CQueryScan::GetRow
But you have to be aware here that you don’t have to supply the OS thread ID. The bm command expects the thread number, which is just a zero-based number. When you switch on the correct OS thread with ~~[132E]s, you will see the thread number in the left bottom part of WinDbg.

When WinDbg reports a thread number like 47, you can set a breakpoint with the following command at the functionsqlmin!CQueryScan::GetRow on the correct thread:
~47 bm sqlmin!CQueryScan::GetRow
After setting the breakpoint, you can continue the execution of sqlservr.exe by using the F5 key. And after a few seconds (depending on the specified delay at the WAITFOR statement) WinDbg should break the execution at the specific breakpoint:
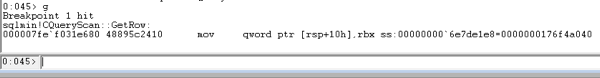
And now the real fun begins: you can explore the current call-stack with the k command, you can single-step through the assembly code, seeing how other functions are called. Your choices are endless, and only limited by your imagination.
Summary
I hope that with today’s blog posting I haven given you a more detailed look into how you can successfully set your first break point within sqlservr.exe to debug a specific query. Over the next weeks and months I’m trying to blog more details on how you can troubleshoot SQL Server with WinDbg. Stay tuned for more fun with WinDbg!
Thanks for reading
-Klaus