百度 Echarts 的使用
一、Echarts 简介
官方网站:http://echarts.baidu.com/
下载地址:http://echarts.baidu.com/download.html
使用文档:http://echarts.baidu.com/tutorial.html#5%20%E5%88%86%E9%92%9F%E4%B8%8A%E6%89%8B%20ECharts
官方示例:http://echarts.baidu.com/examples.html
二、Echarts 在 jsp 中的使用(柱状图)
1、引入 echarts.js 文件
2、jsp 页面代码
 1 <%@ page language="java" contentType="text/html; charset=UTF-8"
 2     pageEncoding="UTF-8"%>
 3 <!DOCTYPE html>
 4 <html>
 5 <head>
 6 <meta http-equiv="Content-Type" content="text/html; charset=UTF-8">
 7 <script type="text/javascript"
 8     src="${pageContext.request.contextPath}/js/echarts.js"></script>
 9 <title>柱状图</title>
10 <style type="text/css">
11 /* 设置 div 居中 */
12 div {
13     margin: 0 auto;
14 }
15
16 marquee {
17     color: red;
18     font-size: 30px;
19 }
20 </style>
21 </head>
22 <body>
23     <marquee>柱状图</marquee>
24     <div id="chart" style=" 500px; height: 400px"></div>
25 </body>
26 <script type="text/javascript">
27     /* 获取 echart 要防止的 div */
28     var dom = document.getElementById('chart');
29     /* 初始化echarts实例 */
30     var myChart = echarts.init(dom);
31     /* x 轴的数据 */
32     var xAxisData = [ 'Mon', 'Tue', 'Wed', 'Thu', 'Fri', 'Sat', 'Sun' ];
33     /* y 轴的数据 */
34     var yAxisData = [ 10, 52, 200, 334, 390, 330, 220 ];
35
36     // 指定图表的配置项和数据
37     var option = {
38         title : {
39             text : '柱状图',
40             left : 'center'
41         },
42         toolbox : {
43             feature : {
44                 /* 数据试图 */
45                 dataView : {
46                     readOnly : false,
47                 },
48                 /* 还原图表*/
49                 restore : {},
50                 /* 保存为图片 */
51                 saveAsImage : {}
52             }
53         },
54         color : [ '#3398DB' ],
55         tooltip : {
56             trigger : 'axis',
57             axisPointer : { // 坐标轴指示器,坐标轴触发有效
58                 type : 'shadow' // 默认为直线,可选为:'line' | 'shadow'
59             }
60         },
61         grid : {
62             left : '3%',//条形图左边的预留
63             right : '10%',//条形图右边的预留
64             bottom : '10%',//条形图底部的预留
65             containLabel : true
66         },
67         xAxis : [ {
68             type : 'category',
69             name:"星期",
70             data : xAxisData,//给 x 坐标赋值
71             axisTick : {
72                 alignWithLabel : true
73             }
74         } ],
75         yAxis : [ {
76             name:"数值",
77             type : 'value'
78         } ],
79         series : [ {
80             name : '数值',
81             type : 'bar',
82             barWidth : '50%',//设置条的宽度,如果为 100% 就是条形图
83             data : yAxisData
84         //给 y 坐标赋值
85         } ]
86     };
87     // 使用刚指定的配置项和数据显示图表。
88     if (option && typeof option === "object") {
89         myChart.setOption(option, true);
90     }
91 </script>
92 </html>
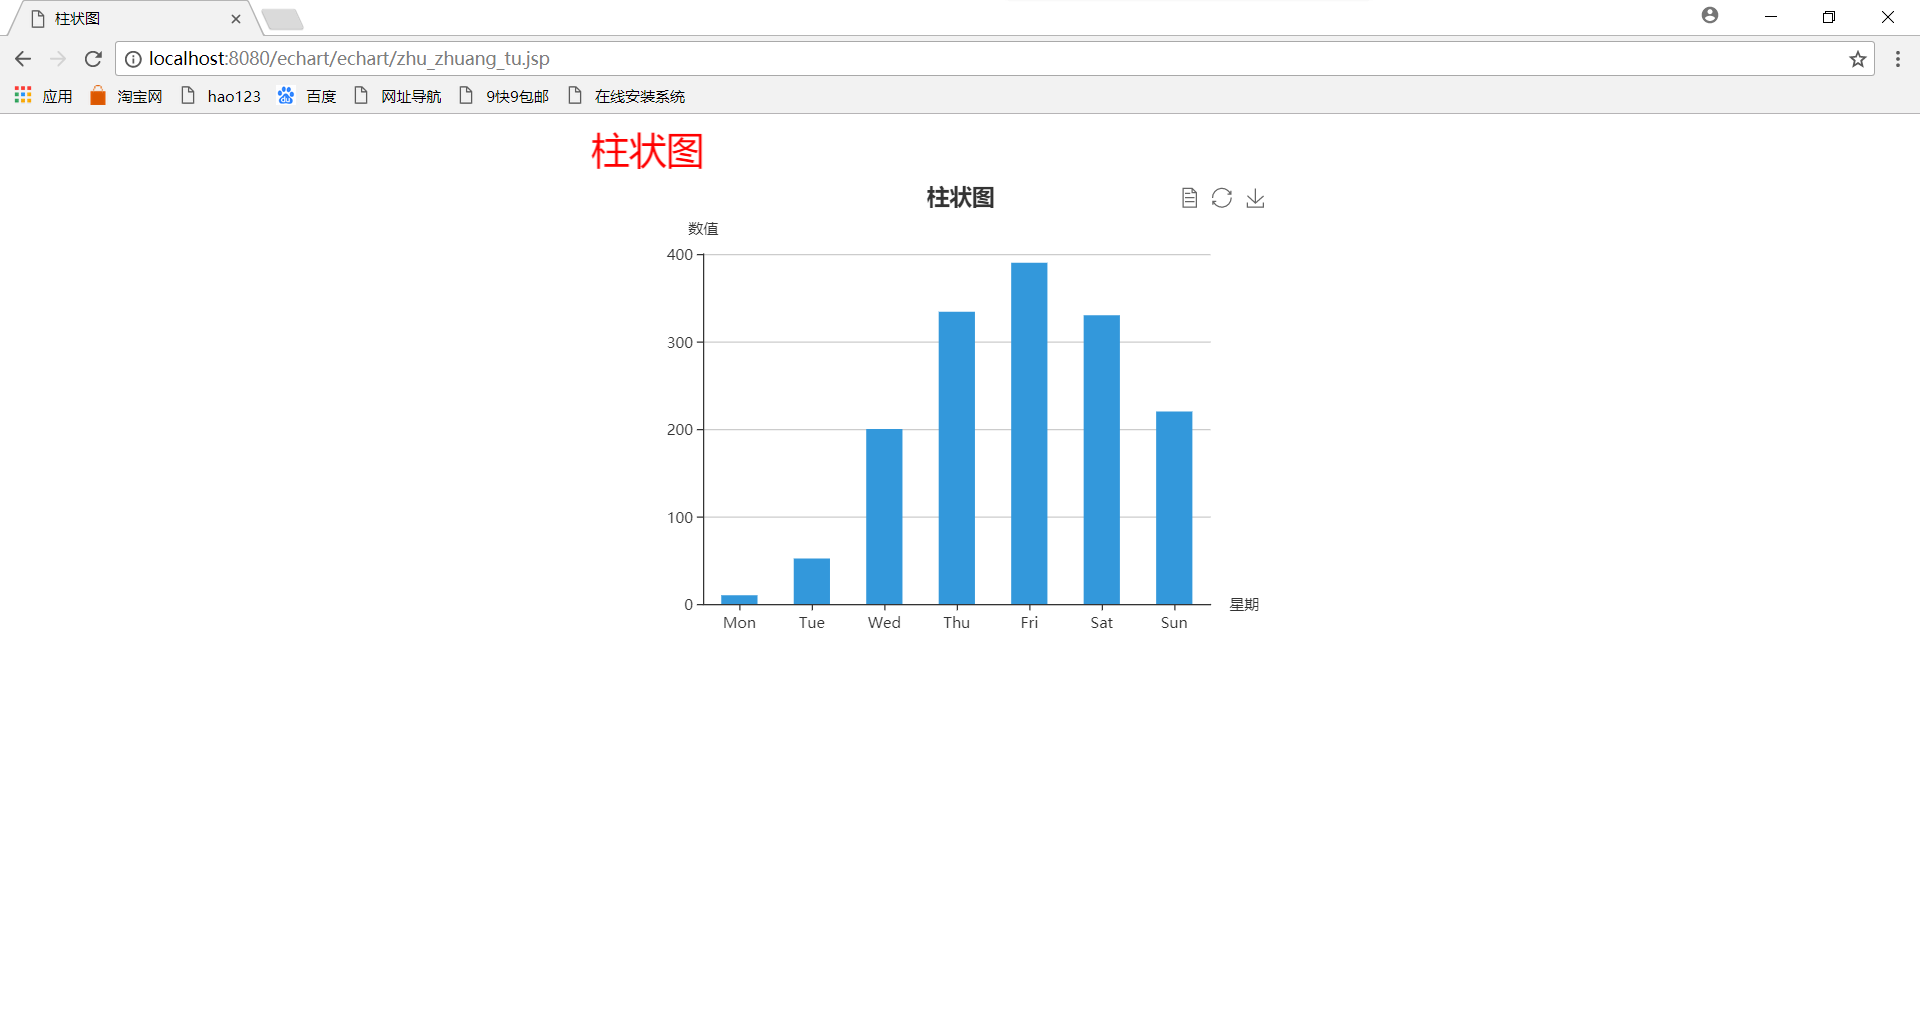
3、效果图