# -*- coding:utf-8 -*-
"""
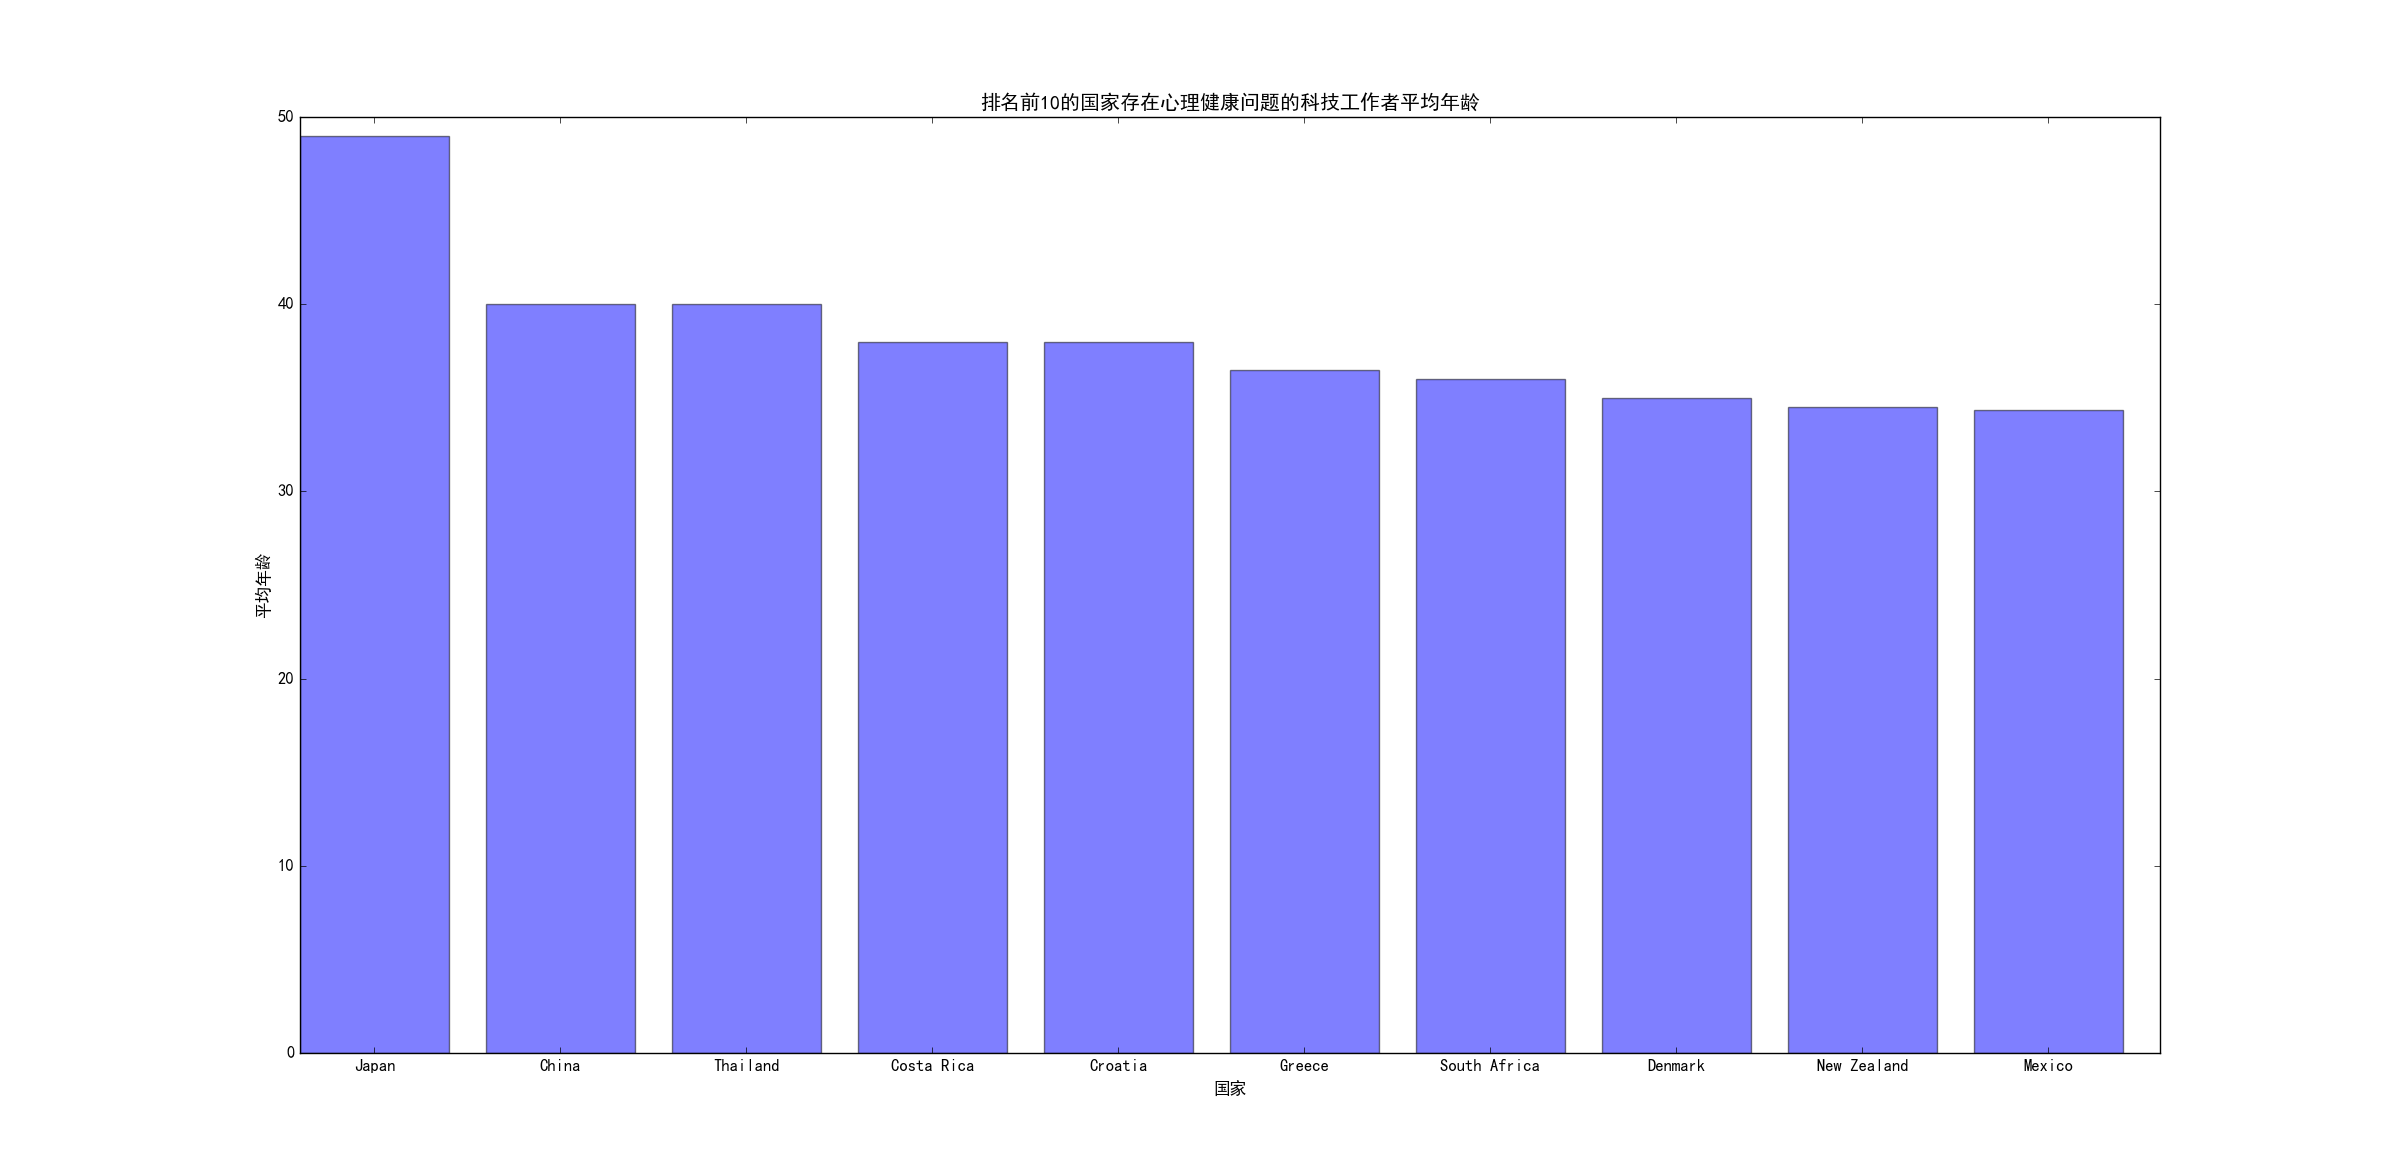
统计每个国家存在心理健康问题的平均年龄
"""
import csv
import matplotlib.pyplot as plt
import numpy as np
import matplotlib
data_depth = "./data/survey.csv"
dict = {}
result = {}
matplotlib.use('qt4agg')#指定默认字体
matplotlib.rcParams['font.sans-serif']=['SimHei']
matplotlib.rcParams['font.family']='sans-serif'
with open(data_depth,'r',newline='') as data:
rows = csv.reader(data)
for i,row in enumerate(rows):
if i == 0:
continue
country = row[3]
age = row[1]
if country not in dict:
dict[country] = [0,0]
dict[country][0] = dict[country][0] + int(row[1])
dict[country][1] = dict[country][1] + 1
for key in dict:
result[key] = dict[key][0] / dict[key][1]
sorted_result = sorted(result.items(),key=lambda asd:asd[1],reverse=True)
del sorted_result[0]
print(sorted_result)
x_data = []
for i in sorted_result:
x_data.append(i[0])
y_data =[]
for i in sorted_result:
y_data.append(i[1])
print(sorted_result.__len__())
fig = plt.figure()
ax = fig.add_subplot(1,1,1)
ax.bar(np.arange(10),y_data[:10],color='b',alpha = 0.5)
ax.set_xticks(np.arange(10)+0.4)
ax.set_xticklabels(x_data[:10])
ax.set_xlabel('国家')
ax.set_ylabel('平均年龄')
ax.set_title("排名前10的国家存在心理健康问题的科技工作者平均年龄")
plt.show()