zoukankan      html  css  js  c++  java
  • echarts学习之----动态排序柱状图

    直接上代码:

    <template>
        <div id="chart-test2" :style="{ height: '500px','1000px'}"></div>
    </template>
    
    <script>
        export default {
            data() {
                return {
                    testOption2: {
                        backgroundColor: '', //设置背景色透明
                        xAxis: {
                            max: 'dataMax',
                        },
                        yAxis: {
                            type: 'category',
                            data: ['苹果', '香蕉', '火龙果', '西瓜', '猕猴桃', '哈密瓜', '黄瓜', '西红柿', '水蜜桃', '橘子'],
                            inverse: true,
                            animationDuration: 300,
                            animationDurationUpdate: 300,
                            max: 10
                        },
                        series: [{
                            realtimeSort: true,
                            name: 'X',
                            type: 'bar',
                            data: [],
                            label: {
                                show: true,
                                position: 'right',
                                valueAnimation: true
                            }
                        }],
                        legend: {
                            show: true
                        },
                        animationDuration: 0,
                        animationDurationUpdate: 3000,
                        animationEasing: 'linear',
                        animationEasingUpdate: 'linear'
                    },
                };
            },
            components: {},
            mounted() {
                //测试二
                let chartTest2 = this.$echarts.init(document.getElementById("chart-test2"), 'dark');
                //初始化数据
                let test2_Data = [];
                for (let i = 0; i < 10; ++i) {
                    test2_Data.push(Math.round(Math.random() * 200));
                }
                this.testOption2.series[0].data = test2_Data //初始化数据
                chartTest2.setOption(this.testOption2) //初始化图表
    
                let that = this;
                setTimeout(function() {
                    that.getData();
                }, 0);
                setInterval(function() {
                    that.getData();
                }, 3000);
            },
            methods: {
                //模拟获取数据
                getData() {
                    let chartTest2 = this.$echarts.init(document.getElementById("chart-test2"), 'dark');
                    var data = this.testOption2.series[0].data;
                    for (var i = 0; i < data.length; ++i) {
                        if (Math.random() > 0.9) {
                            data[i] += Math.round(Math.random() * 2000);
                        } else {
                            data[i] += Math.round(Math.random() * 200);
                        }
                    }
                    this.testOption2.series[0].data = data
                    chartTest2.setOption(this.testOption2); //得到数据后重新渲染图表
                }
            }
        }
    </script>
    
    <style>
    
    </style>

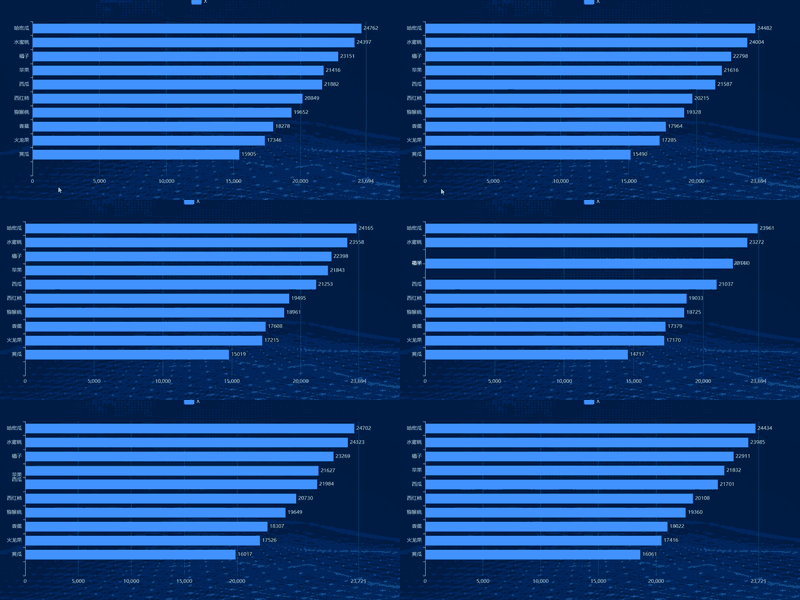
    效果:
  • 相关阅读:
    区块链价值
    区块链路线图
    Hyperledger Fabric Orderer节点启动
    使用 Docker 部署 Grafana + Prometheus 监控 MySQL 数据库
    CentOS 7.x 安装 Docker-Compose
    关于 Abp 替换了 DryIoc 框架之后的问题
    [Abp 源码分析]十七、ASP.NET Core 集成
    使用 DryIoc 替换 Abp 的 DI 框架
    《CLR Via C#》读书笔记:27.计算限制的异步操作
    《CLR Via C#》读书笔记:26.线程基础
  • 原文地址:https://www.cnblogs.com/zhaoyingzhen/p/15133233.html
Copyright © 2011-2022 走看看