1、Elastic Stack
数据搜索、分析和可视化工具
中文网: https://elkguide.elasticsearch.cn/beats/metric.html
Elasticsearch:分布式搜索和分析引擎,具有高可伸缩、高可靠和易管理等特点。基于 Apache Lucene 构建,能对大容量的数据进行接近实时的存储、搜索和分析操作。通常被用作某些应用的基础搜索引擎,使其具有复杂的搜索功能;
Logstash:数据收集引擎。它支持动态的从各种数据源搜集数据,并对数据进行过滤、分析、丰富、统一格式等操作,然后存储到用户指定的位置;
Kibana:数据分析和可视化平台。通常与 Elasticsearch 配合使用,对其中数据进行搜索、分析和以统计图表的方式展示;
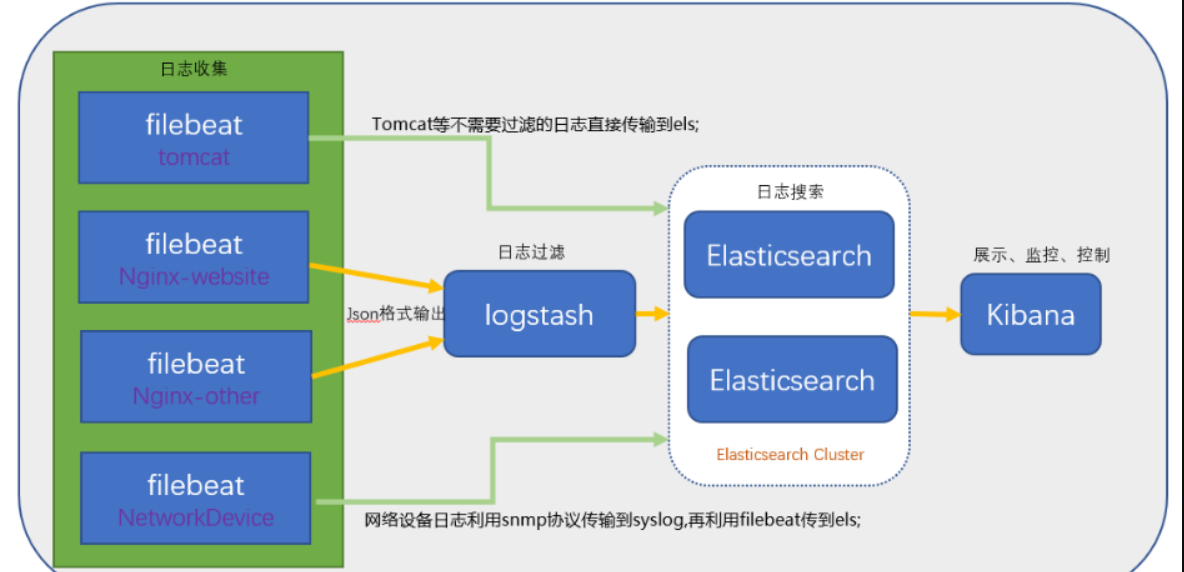
Filebeat:ELK 协议栈的新成员,一个轻量级开源日志文件数据搜集器,基于 Logstash-Forwarder 源代码开发,是对它的替代。在需要采集日志数据的 server 上安装 Filebeat,并指定日志目录或日志文件后,Filebeat 就能读取数据,迅速发送到 Logstash 进行解析,亦或直接发送到 Elasticsearch 进行集中式存储和分析。
架构模式:
测试硬件
| 节点 | 部署详情 |
|---|---|
| 192.168.199.128 [2 2G] | es、kibana、cerebro |
| 192.168.199.129 [1 2G] | es、logstash、filebeat |
| 192.168.199.130 [1 2G] | es、metricbeat |
2、elasticserch
2.1 前提条件
- elasticsearch不能使用 root 用户启动,所以需要创建一个新用户,并将其添加到 root 组
useradd elk -g root
- 给新用户【elk】服务文件操作权限
chown -R elk /docker/elk/es
- 最后切换都 elk 用户,启动es集群
$ su elk
$ docker-compose up -d
2.2 基本api
1. 查看es集群 节点信息:http://192.168.199.128:9200/_cat/nodes
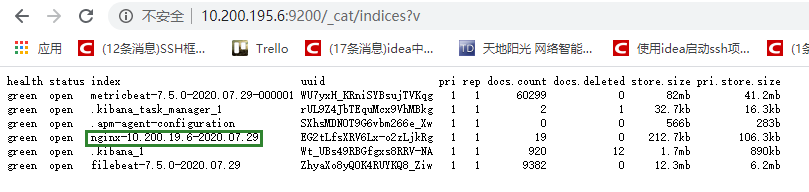
2. 查看es中索引: http://192.168.199.128:9200/_cat/indices?v
3. 集群状态:http://192.168.199.128:9200/_cluster/health?pretty
4. 节点状态:http://192.168.199.128:9200/_nodes/process?pretty
5. 分片状态:http://192.168.199.128:9200/_cat/shards
6. 索引分片存储信息:http://192.168.199.128:9200/index/_shard_stores?pretty
7. 索引状态:http://192.168.199.128:9200/index/_stats?pretty
8. 索引元数据:http://192.168.199.128:9200/index?pretty
2.3 es集群部署
- es_master (elasticsearch.yml)
# 集群名称
cluster.name: es-cluster

# 节点名称
node.name: es_master
# 是否可以成为master节点
node.master: true
# 是否允许该节点存储数据,默认开启
node.data: false
bootstrap.memory_lock: true

# 针对单机部署多节点
network.host: 0.0.0.0
network.publish_host: 192.168.199.128
# 集群发现(自己不需要发现自己)
discovery.seed_hosts: ["192.168.199.129:9300","192.168.199.130:9300"]
discovery.zen.minimum_master_nodes: 2
# 手动指定可以成为 mater 的所有节点的 name 或者 ip,这些配置将会在第一次选举中进行计算
cluster.initial_master_nodes: ["es_master"]


http.port: 9200
# 增加如下配置,用于集群内各机器间通信:es多节点协调的端口号
transport.tcp.port: 9300
# 支持跨域访问
http.cors.enabled: true
http.cors.allow-origin: "*"

# 安全认证
# xpack.security.enabled: false
#http.cors.allow-headers: "Authorization"
- es_slave1 (elasticsearch.yml)
# 集群名称
cluster.name: es-cluster

# 节点名称
node.name: es_slave1
# 是否可以成为master节点
node.master: true
# 是否允许该节点存储数据,默认开启
node.data: true
bootstrap.memory_lock: true

# 针对单机部署多节点
network.host: 0.0.0.0
network.publish_host: 192.168.199.129
# 集群发现(自己不需要发现自己)
discovery.seed_hosts: ["192.168.199.128:9300","192.168.199.130:9300"]
discovery.zen.minimum_master_nodes: 2
# 手动指定可以成为 mater 的所有节点的 name 或者 ip,这些配置将会在第一次选举中进行计算
cluster.initial_master_nodes: ["es_master"]


http.port: 9200
# 增加如下配置,用于集群内各机器间通信:es多节点协调的端口号
transport.tcp.port: 9300
# 支持跨域访问
http.cors.enabled: true
http.cors.allow-origin: "*"

# 安全认证
# xpack.security.enabled: false
#http.cors.allow-headers: "Authorization"
- es_slave2 (elasticsearch.yml)
# 集群名称
cluster.name: es-cluster

# 节点名称
node.name: es_slave2
# 是否可以成为master节点
node.master: true
# 是否允许该节点存储数据,默认开启
node.data: true
bootstrap.memory_lock: true

# 针对单机部署多节点
network.host: 0.0.0.0
network.publish_host: 192.168.199.130
# 集群发现(自己不需要发现自己)
discovery.seed_hosts: ["192.168.199.128:9300","192.168.199.129:9300"]
discovery.zen.minimum_master_nodes: 2
# 手动指定可以成为 mater 的所有节点的 name 或者 ip,这些配置将会在第一次选举中进行计算
cluster.initial_master_nodes: ["es_master"]


http.port: 9200
# 增加如下配置,用于集群内各机器间通信:es多节点协调的端口号
transport.tcp.port: 9300
# 支持跨域访问
http.cors.enabled: true
http.cors.allow-origin: "*"

# 安全认证
# xpack.security.enabled: false
#http.cors.allow-headers: "Authorization"
2.4 docker-compose.yml
192.168.199.128
version: "3"
services:
  elasticsearch:
    image: elasticsearch:7.5.0
    container_name: elasticsearch
    environment:
      - "ES_JAVA_OPTS=-Xms256m -Xmx256m"
      - TZ=Asia/Shanghai
    restart: always
    volumes:
      - ./es/config/elasticsearch.yml:/usr/share/elasticsearch/config/elasticsearch.yml
      - ./es/data:/usr/share/elasticsearch/data:rw
      - ./es/logs:/usr/share/elasticsearch/logs:rw
    ulimits:
      memlock:
        soft: -1
        hard: -1
    ports:
      - "9200:9200"
      - "9300:9300"
    networks:
      - elk

  cerebro:
    image: lmenezes/cerebro
    container_name: cerebro
    ports:
      - "9000:9000"
    command:
      - -Dhosts.0.host=http://elasticsearch:9200
    depends_on:
      - elasticsearch
    networks:
      - elk

  kibana:
    image: kibana:7.5.0
    container_name: kibana
    environment:
      - "ES_JAVA_OPTS=-Xms256m -Xmx256m"
      - TZ=Asia/Shanghai
    volumes:
      - ./kibana/kibana.yml:/usr/share/kibana/config/kibana.yml
    ports:
       - "5601:5601"
    depends_on:
      - elasticsearch
    networks:
      - elk


  nginx:
    image: nginx
    container_name: nginx
    volumes:
      # - ./nginx/config/nginx.conf:/etc/nginx/nginx.conf
      # - ./nginx/html:/usr/share/nginx/html
      - ./nginx/logs:/var/log/nginx
    ports:
       - "80:80"
    networks:
      - elk

networks:
  elk:
    driver: bridge
2.5 报错解决
1. seccomp unavailable 错误
解决方法:elasticsearch.yml 配置
bootstrap.memory_lock: false
#bootstrap.systemcallfilter: false

2. max file descriptors [4096] for elasticsearch process likely too low, increase to at least [65536]
解决方法:修改 /etc/security/limits.conf,配置:
elasticsearch soft nofile 65535          #软限   此处elasticsearch为启动用户
elasticsearch hard nofile 65535        #硬限

3. max virtual memory areas vm.maxmapcount [65530] is too low
解决方法:修改 /etc/sysctl.conf,添加 :
vm.max_map_count=262144
然后 sysctl -p 生效

4. the default discovery settings are unsuitable...., last least one of [....] must be configured
解决方法:elasticsearch.yml 开启配置:
node.name: node-1
cluster.initialmasternodes: ["es01"]*
3、logstash
3.1 安装
3.2 配置
- logstash-filebeat.conf
input {
    beats {
        # 端口
        port => "5044"
    }
}
filter {
	mutate {
		split => {"message"=>"|"}
	}
    mutate {
		add_field => {
			"userId" => "%{[message][1]}"
			"visit" => "%{[message][2]}"
			"date" => "%{[message][3]}"
		}
	}
	mutate {
		convert => {
			"userId" => "integer"
			"visit" => "string"
			"date" => "string"
		}
	}

	date {
		match => ["message","UNIX_MS"]
		target => "@timestamp"
	}
	ruby {
		code => "event.set('timestamp', event.get('@timestamp').time.localtime + 8*60*60)"
	}
	ruby {
		code => "event.set('@timestamp',event.get('timestamp'))"
	}


}
output {
    elasticsearch {
        hosts => ["192.168.199.128:9200","192.168.199.129:9200","192.168.199.130:9200"]
    }
}
- logstash.yml
http.host: "0.0.0.0"
xpack.monitoring.elasticsearch.hosts: [ "http://192.168.199.128:9200" ]
- docker-compose.yml [192.168.199.129]
version: "3"
services:
  elasticsearch:
    image: docker.elastic.co/elasticsearch/elasticsearch:7.5.0
    container_name: elasticsearch
    environment:
      - "ES_JAVA_OPTS=-Xms256m -Xmx256m"
      - TZ=Asia/Shanghai
    restart: always
    volumes:
      - ./es/config/elasticsearch.yml:/usr/share/elasticsearch/config/elasticsearch.yml
      - ./es/data:/usr/share/elasticsearch/data:rw
      - ./es/logs:/usr/share/elasticsearch/logs:rw
    ulimits:
      memlock:
        soft: -1
        hard: -1
    ports:
      - "9200:9200"
      - "9300:9300"
    networks:
      - elk

  logstash:
    container_name: logstash
    image: logstash:7.5.0
    command: logstash -f ./conf/logstash-filebeat.conf
    restart: always
    environment:
      - TZ=Asia/Shanghai
    volumes:
      # 映射到容器中
      - ./logstash/logstash.yml:/usr/share/logstash/config/logstash.yml
      - ./logstash/logstash-filebeat.conf:/usr/share/logstash/conf/logstash-filebeat.conf
    # environment:
      # - elasticsearch.hosts=http://192.168.199.128:9200
    ports:
      - "5044:5044"
      - "9600:9600"
    networks:
      - elk

networks:
  elk:
    driver: bridge
3.3 支持的输入
- file: 从文件系统读取文件。
- syslog: 监听syslog消息的514端口并根据RFC3164格式进行解析。
- redis: 使用redis channels和redis lists 从redis server读取数据。 Redis通常用作Logstash的“代理”,将Logstash事件排队。
- beats: 处理beats发送的事件
3.4 过滤器
过滤器是Logstash管道中的中间处理设备。 您可以将过滤器与条件组合,以便在事件满足特定条件时对其执行操作。 一些有用的过滤包括:
- grok: 解析并构造任意文本。 Grok是目前Logstash中将非结构化日志数据解析为结构化和可查询内容的最佳方式。 Logstash内置120种模式。
- mutate: 对事件字段执行常规转换。 您可以重命名,删除,替换和修改事件中的字段。
- drop: 完全删除事件,例如调试事件。
- clone: 制作事件的副本,可添加或删除字段。
- geoip: 添加有关IP地址地理位置的信息 (可对应为Kibana中的图表)
3.5 输出
输出是Logstash管道的最后阶段。 事件可以通过多个输出,但是一旦所有输出处理完成,事件就完成了它的执行。 一些常用的输出包括:
-
elasticsearch: 将事件数据发送到Elasticsearch。
-
file: 将事件数据写入磁盘上的文件。
-
graphite: 将事件数据发送到graphite,这是一种用于存储和绘制指标的流行开源工具。
http://graphite.readthedocs.io/en/latest/
-
statsd: 将事件数据发送到statsd,这是一种“侦听统计信息,如计数器和定时器,通过UDP发送并将聚合发送到一个或多个可插入后端服务”的服务。
3.6 编解码器
编解码器基本上是流过滤器,可以作为输入或输出的一部分。 使用编解码器可以轻松地将消息传输与序列化过程分开。 流行的编解码器包括json,msgpack和plain(text)。
- json: 以JSON格式编码或解码数据。
- multiline: 将多行文本事件(如java异常和堆栈跟踪消息)合并到一个事件中
3.7 插件合集
3.7.1 input
有一些比较有用的配置项,可以用来指定 FileWatch 库的行为:
- discover_interval
logstash 每隔多久去检查一次被监听的 path 下是否有新文件。默认值是 15 秒。
- exclude
不想被监听的文件可以排除出去,这里跟 path 一样支持 glob 展开。
- close_older
一个已经监听中的文件,如果超过这个值的时间内没有更新内容,就关闭监听它的文件句柄。默认是 3600 秒,即一小时。
- 注意
1> FileWatch 只支持文件的绝对路径,而且会不自动递归目录。所以有需要的话,请用数组方式都写明具体哪些文件。

2> LogStash::Inputs::File 只是在进程运行的注册阶段初始化一个 FileWatch 对象。所以它不能支持类似 fluentd 那样的 `path => "/path/to/%{+yyyy/MM/dd/hh}.log"` 写法。达到相同目的,你只能写成 `path => "/path/to/*/*/*/*.log"`。FileWatch 模块提供了一个稍微简单一点的写法:`/path/to/**/*.log`,用 `**` 来缩写表示递归全部子目录

3> 在单个 input/file 中监听的文件数量太多的话,每次启动扫描构建监听队列会消耗较多的时间。给使用者的感觉好像读取不到一样,这是正常现象
4、kibana
4.1 kibana.yml
server.port: 5601
server.host: "0.0.0.0"
server.name: "192.168.199.128"

# The URLs of the Elasticsearch instances to use for all your queries.
elasticsearch.hosts: ["http://elasticsearch:9200"]

# When this setting's value is true Kibana uses the hostname specified in the server.host
# setting. When the value of this setting is false, Kibana uses the hostname of the host
# that connects to this Kibana instance.
#elasticsearch.preserveHost: true

# Kibana uses an index in Elasticsearch to store saved searches, visualizations and
# dashboards. Kibana creates a new index if the index doesn't already exist.
#kibana.index: ".kibana"

# The default application to load.
#kibana.defaultAppId: "home"

# If your Elasticsearch is protected with basic authentication, these settings provide
# the username and password that the Kibana server uses to perform maintenance on the Kibana
# index at startup. Your Kibana users still need to authenticate with Elasticsearch, which
# is proxied through the Kibana server.
#elasticsearch.username: "kibana"
#elasticsearch.password: "pass"

# Enables SSL and paths to the PEM-format SSL certificate and SSL key files, respectively.
# These settings enable SSL for outgoing requests from the Kibana server to the browser.
#server.ssl.enabled: false
#server.ssl.certificate: /path/to/your/server.crt
#server.ssl.key: /path/to/your/server.key

# Optional settings that provide the paths to the PEM-format SSL certificate and key files.
# These files validate that your Elasticsearch backend uses the same key files.
#elasticsearch.ssl.certificate: /path/to/your/client.crt
#elasticsearch.ssl.key: /path/to/your/client.key

# Optional setting that enables you to specify a path to the PEM file for the certificate
# authority for your Elasticsearch instance.
#elasticsearch.ssl.certificateAuthorities: [ "/path/to/your/CA.pem" ]

# To disregard the validity of SSL certificates, change this setting's value to 'none'.
#elasticsearch.ssl.verificationMode: full

# Time in milliseconds to wait for Elasticsearch to respond to pings. Defaults to the value of
# the elasticsearch.requestTimeout setting.
#elasticsearch.pingTimeout: 1500

# Time in milliseconds to wait for responses from the back end or Elasticsearch. This value
# must be a positive integer.
#elasticsearch.requestTimeout: 30000

# List of Kibana client-side headers to send to Elasticsearch. To send *no* client-side
# headers, set this value to [] (an empty list).
#elasticsearch.requestHeadersWhitelist: [ authorization ]

# Header names and values that are sent to Elasticsearch. Any custom headers cannot be overwritten
# by client-side headers, regardless of the elasticsearch.requestHeadersWhitelist configuration.
#elasticsearch.customHeaders: {}

# Time in milliseconds for Elasticsearch to wait for responses from shards. Set to 0 to disable.
#elasticsearch.shardTimeout: 30000

# Time in milliseconds to wait for Elasticsearch at Kibana startup before retrying.
#elasticsearch.startupTimeout: 5000

# Logs queries sent to Elasticsearch. Requires logging.verbose set to true.
#elasticsearch.logQueries: false

# Specifies the path where Kibana creates the process ID file.
#pid.file: /var/run/kibana.pid

# Enables you specify a file where Kibana stores log output.
#logging.dest: stdout

# Set the value of this setting to true to suppress all logging output.
#logging.silent: false

# Set the value of this setting to true to suppress all logging output other than error messages.
#logging.quiet: false

# Set the value of this setting to true to log all events, including system usage information
# and all requests.
#logging.verbose: false

# Set the interval in milliseconds to sample system and process performance
# metrics. Minimum is 100ms. Defaults to 5000.
#ops.interval: 5000

# Specifies locale to be used for all localizable strings, dates and number formats.
# Supported languages are the following: English - en , by default , Chinese - zh-CN .
#i18n.locale: "en"
i18n.locale: "zh-CN"
5、filebeat
注意事项:
关于filebeat插件的使用,如果使用rpm、tar压缩包方式 安装的话,直接配置好filebeat.yml就可以正常收集日志,但是当使用docker-compose编排部署filebeat时,需要***将日志挂载到容器中***(否则收集不到)
举个栗子:
filebeat.yml
(paths: 指向的是容器内的地址路径)
filebeat.inputs:
- type: log
  enabled: true
  paths:
    - /usr/share/filebeat/logs/demo/*.log

  fields:
    filetype: demo
  fields_under_root: true


- type: log
  enabled: true
  paths:
    # 指定需要收集的日志文件的路径(容器内的文件路径,所以我们需要挂载)
    - /usr/share/filebeat/logs/app/*.log
  fields:
    filetype: app
  fields_under_root: true


setup.template.settings:
  index.number_of_shards: 2

#====================Preocessors=====================
# processors: # 注意这几行,表示的是删除日志中的ecs这一项
  # - drop_fields:
      # fields: ["tags","host","input","ecs","log","agent"]

# ----------------------------- Logstash output --------------------------------
output.logstash:
  # The Logstash hosts
  hosts: ["logstash:5044"]


  #----------------------------- elasticsearch output --------------------------------
# output.elasticsearch:
  # # The Logstash hosts
  # hosts: ["10.200.195.6:9200"]
docker-compose.yml => filebeat部分配置
  filebeat:
    # 容器名称
    container_name: filebeat
    # 主机名称
    # hostname: filebeat
    # 镜像
    image: docker.elastic.co/beats/filebeat:7.5.0
    # 重启机制
    restart: always
    # 持久化挂载
    volumes:
      - ./filebeat/config/filebeat.yml:/usr/share/filebeat/filebeat.yml
      # 将主机的日志挂载到容器中
      - /mydata/elk/logs/:/usr/share/filebeat/logs/demo
      - /elk/logs/:/usr/share/filebeat/logs/app
      - ./filebeat/data:/usr/share/filebeat/data
    depends_on:
      - es6
      - logstash
      - kibana
    links:
      - logstash
    networks:
      - elk
logstash-filebeat.conf
input {
    beats {
        # 端口
        port => "5044"
    }
}
filter {
 if [filetype] == "app" {
   mutate{
        remove_field => ["host"]
        remove_field => ["agent"]
        remove_field => ["ecs"]
        remove_field => ["tags"]
        remove_field => ["fields"]
        remove_field => ["@version"]
        remove_field => ["@timestamp"]
        remove_field => ["input"]
        remove_field => ["log"]
    }
 }

}
output {
    if [filetype] == "app" {
       elasticsearch {
			hosts => ["10.200.195.11:9200","10.200.195.12:9200"]
			index => "app-%{+YYYY.MM.dd}"
	   }
	   stdout { codec => rubydebug }
	}
	if [filetype] == "demo" {
		elasticsearch {
			hosts => ["10.200.195.11:9200","10.200.195.12:9200"]
			index => "demo-%{+YYYY.MM.dd}"
		}
	}
}
6、metricbeat
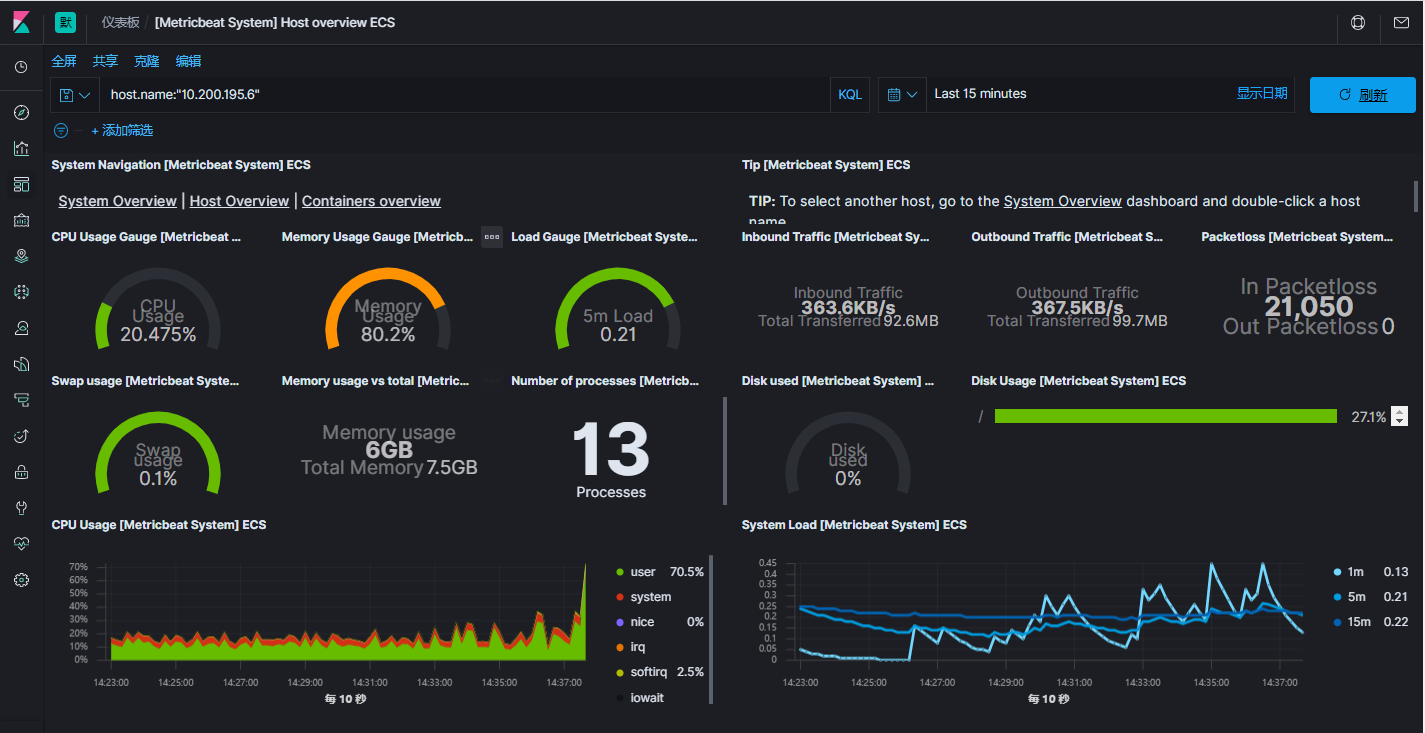
Metricbeat是一个轻量级代理,在服务器上安装,以定期从操作系统和服务器上运行的服务收集指标。 Metricbeat获取它收集的指标和统计信息,并将它们发送到指定的输出,例如Elasticsearch或Logstash。
支持的服务包括:
可以获取系统级的 CPU 使用率、内存、文件系统、磁盘 IO 和网络 IO 统计数据,还可针对系统上的每个进程获得与 top 命令类似的统计数据
Metricbeat 提供多种内部模块,这些模块可从多项服务(诸如 Apache、Jolokia、NGINX、MongoDB、MySQL、PostgreSQL、Prometheus 等等)中收集指标。安装简单,完全零依赖性。只需在配置文件中启用您所需的模块即可。
metricbeat主要是收集系统性能指标的(推荐rpm方式)
-
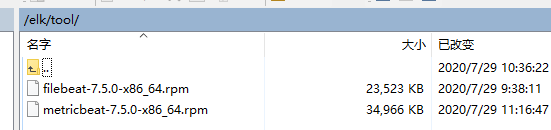
安装metricbeat
metricbeat配置文件路径: /etc/metricbeat
启动文件路径 : /usr/share/metricbeat
rpm -ivh metricbeat-7.5.0-x86_64.rpm
- 启动程序
systemctl start metricbeat
- 配置开机启动
systemctl enable metricbeat
6.1、metricbeat.yml
可以直接输出到elasticsearch中,也可以输出到logstash进行过滤筛选
metricbeat.config.modules:
  path: ${path.config}/modules.d/*.yml
  reload.enabled: false

setup.template.settings:
  index.number_of_shards: 2
  index.codec: best_compression

setup.dashboards.enabled: true

# 主要设置这个
setup.kibana:
  host: "10.200.195.6:5601"

# 主要设置这个
output.elasticsearch:
  hosts: ["10.200.195.6:9200"]

processors:
  - add_host_metadata: ~
  - add_cloud_metadata: ~
  - add_docker_metadata: ~
  - add_kubernetes_metadata: ~
6.2 、安装kibana仪表盘
- mac、deb、 rpm (本次使用这种)
metricbeat setup --dashboards
- docker
docker run docker.elastic.co/beats/metricbeat:7.5.0 setup --dashboards
- docker-compose(会一直安装仪表盘–问题)
version: "3"
services:
  metricbeat:
    image: metricbeat:7.5.0
    container_name: metricbeat
    command: setup --dashboards # 启动后执行得安装kibana仪表盘命令
    environment:
      - "ES_JAVA_OPTS=-Xms256m -Xmx256m"
      - TZ=Asia/Shanghai
    restart: always
    volumes:
      - ./metricbeat/config/metricbeat.yml:/usr/share/metricbeat/config/metricbeat.yml
    networks:
      - elk
- deb、rpm硬编码的方式启动(参考)
metricbeat setup -e
  -E output.logstash.enabled=false
  -E output.elasticsearch.hosts=['localhost:9200']
  -E output.elasticsearch.username=metricbeat_internal
  -E output.elasticsearch.password=YOUR_PASSWORD
  -E setup.kibana.host=localhost:5601
6.3、 配置kibana
当前问题 : 局域网其他机器访问性能仪表盘时 部分不显示问题
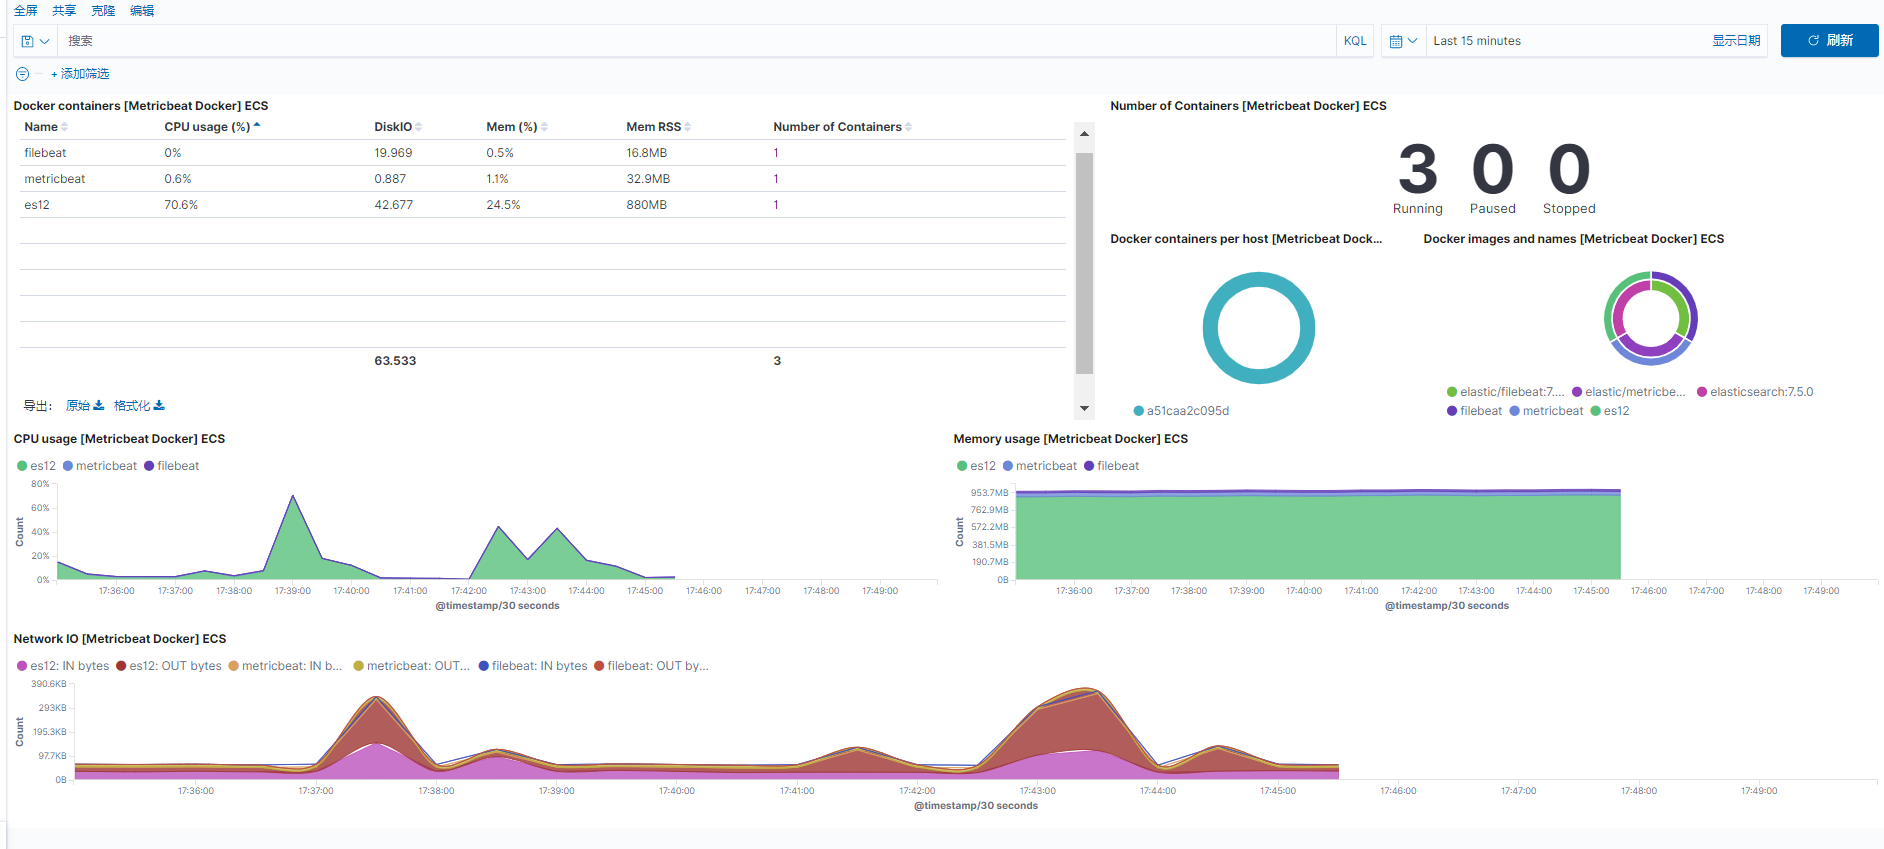
6.4、docker-compose启动
在 modules.d 中的 system.yml 加上下面配置 (先开启docker模块)
- module: docker
  metricsets: ["container", "cpu", "diskio", "healthcheck", "info", "memory", "network"]
  hosts: ["unix:///var/run/docker.sock"]
  enabled: true
  period: 10s
docker-compose.yml部分配置
  metricbeat:
    # 容器名称
    container_name: metricbeat
    # 主机名称
    # hostname: filebeat
    # 镜像
    image: elastic/metricbeat:7.5.0
    command: -system.hostfs=/hostfs -e
    # 重启机制
    restart: always
    # 持久化挂载
    volumes:
      - ./metricbeat/config/metricbeat.yml:/usr/share/metricbeat/metricbeat.yml
      - /var/run/docker.sock:/var/run/docker.sock:ro
      - /proc:/hostfs/proc:ro
      - /sys/fs/cgroup:/hostfs/sys/fs/cgroup:ro
      - /:/hostfs:ro
      - ./metricbeat/modules.d:/usr/share/metricbeat/modules.d:ro
      -  /usr/share/zoneinfo/Asia/Shanghai:/etc/localtime:ro
    # user: "root"
    networks:
      - elk
7、filebeat收集nginx日志
7.1 filebeat收集nginx日志
- filebeat.yml 配置
- type: log
  enabled: true
  paths:
    - /elk/logs/*.log
# 配置nginx日志收集 并以json格式展示
- type: log
  enabled: true
  json.keys_under_root: true  #json格式收集
  json.overwrite_keys: true   #json格式收集
  paths:
    - /elk/nginx/logs/access.log
  fields:
    log_topics: "nginx-10.200.196.5" # 设置日志标题
# 发送给logstash处理
output.logstash:
  hosts: ["10.200.195.6:5044"]
7.2 nginx.conf 配置
log_format access_json_log  '{"@timestamp":"$time_local",'
                                  '"http_host":"$http_host",'
                                  '"clinetip":"$remote_addr",'
                                  '"request":"$request",'
                                  '"status":"$status",'
                                  '"size":"$body_bytes_sent",'
                                  '"upstream_addr":"$upstream_addr",'
                                  '"upstream_status":"$upstream_status",'
                                  '"upstream_response_time":"$upstream_response_time",'
                                  '"request_time":"$request_time",'
                                  '"http_referer":"$http_referer",'
                                  '"http_user_agent":"$http_user_agent",'
                                  '"http_x_forwarded_for":"$http_x_forwarded_for"}';

    access_log  /var/log/nginx/access.log  access_json_log;
7.3 logstash-nginx.conf 配置
input {
    beats {
        # 端口
        port => "5044"
    }
}
filter {
    grok {
        match => { "message" => "%{COMBINEDAPACHELOG}"}
    }
    geoip {
        source => "clientip"
    }
}
output {
  if[fields][log_topics]=="nginx-10.200.196.5"{   #判断是否是filebeat配置设置的fields字段,是则发送到es
    elasticsearch {
     hosts => ["elasticsearch:9200","es2:9200","es3:9200"]
     index=>"nginx-10.200.19.6-%{+YYYY.MM.dd}"   #设置索引名字
    }
  }else{
     elasticsearch {
	   hosts => ["elasticsearch:9200","es2:9200","es3:9200"]
	   index => "%{[@metadata][beat]}-%{[@metadata][version]}-%{+YYYY.MM.dd}"
    }
  }
}
7.4 注意
nginx 的日志里含有中文的话,会将中文转为 Unicode 编码,如果不转的话,加入 escape=json 参数就可以了
log_format access_json_log escape=json '{ "@timestamp": "$time_iso8601", ' --------
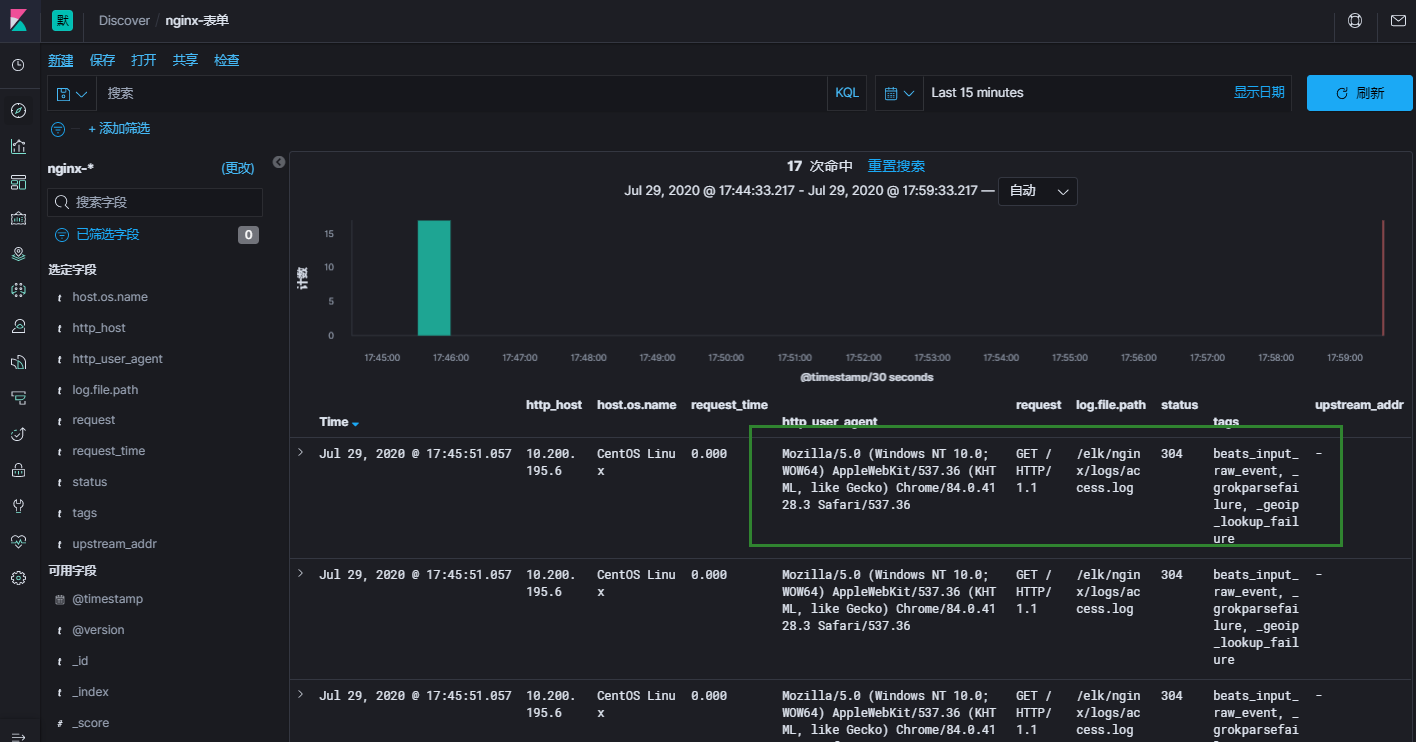
7.5 kibana展示
8、docker容器网络
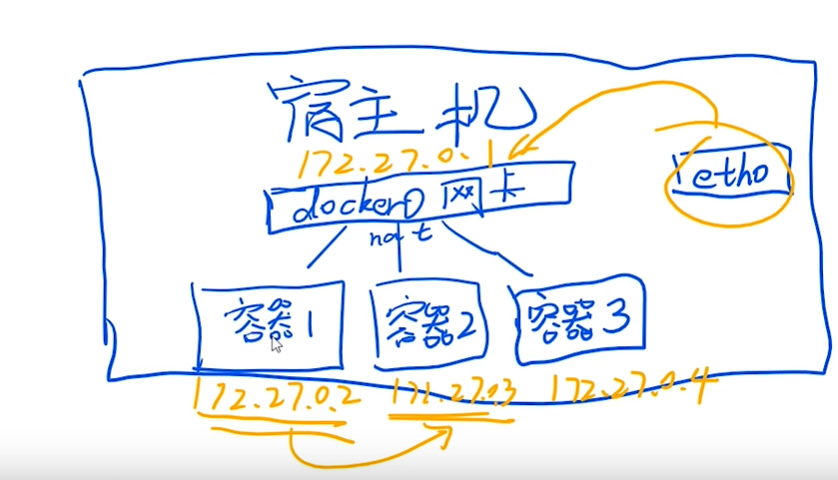
宿主机安装docker后会生成一张docker0网卡,ip大概是172.27.0.1,然后创建得容器就开始分配ip,
容器1:172.27.0.2
容器2:172.27.0.3
。。。
容器之间 同一网段 通过ip进行通信
容器和宿主机 之间通信 通过docker0网卡进行转发 路由过去(即通过ip+port的方式通信)
9、docker 常用命令
- 打包本地镜像
docker save [IMAGE_ID] > /to/path/XXX.tar xxx:latest
- 加载解压镜像
docker load < /to/path/XXX.tar
- 修改镜像名字
docker tag [IMAGE_ID] [REPOSITORY]:[TAG]
# 示例
docker tag 44fa464082cd logstash:7.5.0
- 启动docker-compose.yml
docker-compose up -d
- 关闭容器并清楚容器内容
docker-compose down