 1 import networkx as nx
 2 import numpy as np
 3 import pandas as pd
 4 %matplotlib notebook
 5
 6 # Instantiate the graph
 7 G1 = nx.Graph()
 8 # add node/edge pairs
 9 G1.add_edges_from([(0, 1),
10                    (0, 2),
11                    (0, 3),
12                    (0, 5),
13                    (1, 3),
14                    (1, 6),
15                    (3, 4),
16                    (4, 5),
17                    (4, 7),
18                    (5, 8),
19                    (8, 9)])
20
21 # draw the network G1
22 nx.draw_networkx(G1)

邻接表
G_adjlist.txt is the adjaceny list representation of G1.
It can be read as follows:
0 1 2 3 5→→ node0is adjacent to nodes1, 2, 3, 51 3 6→→ node1is (also) adjacent to nodes3, 62→→ node2is (also) adjacent to no new nodes3 4→→ node3is (also) adjacent to node4
and so on. Note that adjacencies are only accounted for once (e.g. node 2 is adjacent to node 0, but node 0 is not listed in node 2's row, because that edge has already been accounted for in node 0's row).
1 !cat G_adjlist.txt
0 1 2 3 5
1 3 6
2
3 4
4 5 7
5 8
6
7
8 9
9
1 G2 = nx.read_adjlist('G_adjlist.txt', nodetype=int)
2 G2.edges()
[(0, 1),
 (0, 2),
 (0, 3),
 (0, 5),
 (1, 3),
 (1, 6),
 (3, 4),
 (5, 4),
 (5, 8),
 (4, 7),
 (8, 9)]


邻接矩阵
 1 G_mat = np.array([[0, 1, 1, 1, 0, 1, 0, 0, 0, 0],
 2                   [1, 0, 0, 1, 0, 0, 1, 0, 0, 0],
 3                   [1, 0, 0, 0, 0, 0, 0, 0, 0, 0],
 4                   [1, 1, 0, 0, 1, 0, 0, 0, 0, 0],
 5                   [0, 0, 0, 1, 0, 1, 0, 1, 0, 0],
 6                   [1, 0, 0, 0, 1, 0, 0, 0, 1, 0],
 7                   [0, 1, 0, 0, 0, 0, 0, 0, 0, 0],
 8                   [0, 0, 0, 0, 1, 0, 0, 0, 0, 0],
 9                   [0, 0, 0, 0, 0, 1, 0, 0, 0, 1],
10                   [0, 0, 0, 0, 0, 0, 0, 0, 1, 0]])
11 G_mat
array([[0, 1, 1, 1, 0, 1, 0, 0, 0, 0],
       [1, 0, 0, 1, 0, 0, 1, 0, 0, 0],
       [1, 0, 0, 0, 0, 0, 0, 0, 0, 0],
       [1, 1, 0, 0, 1, 0, 0, 0, 0, 0],
       [0, 0, 0, 1, 0, 1, 0, 1, 0, 0],
       [1, 0, 0, 0, 1, 0, 0, 0, 1, 0],
       [0, 1, 0, 0, 0, 0, 0, 0, 0, 0],
       [0, 0, 0, 0, 1, 0, 0, 0, 0, 0],
       [0, 0, 0, 0, 0, 1, 0, 0, 0, 1],
       [0, 0, 0, 0, 0, 0, 0, 0, 1, 0]])
1 G3 = nx.Graph(G_mat)
2 G3.edges()
[(0, 1),
 (0, 2),
 (0, 3),
 (0, 5),
 (1, 3),
 (1, 6),
 (3, 4),
 (4, 5),
 (4, 7),
 (5, 8),
 (8, 9)]


带权重得边
1 !cat G_edgelist.txt
0 1 4
0 2 3
0 3 2
0 5 6
1 3 2
1 6 5
3 4 3
4 5 1
4 7 2
5 8 6
8 9 1
1 G4 = nx.read_edgelist('G_edgelist.txt', data=[('Weight', int)])
2
3 G4.edges(data=True)
[('0', '1', {'Weight': 4}),
 ('0', '2', {'Weight': 3}),
 ('0', '3', {'Weight': 2}),
 ('0', '5', {'Weight': 6}),
 ('1', '3', {'Weight': 2}),
 ('1', '6', {'Weight': 5}),
 ('3', '4', {'Weight': 3}),
 ('5', '4', {'Weight': 1}),
 ('5', '8', {'Weight': 6}),
 ('4', '7', {'Weight': 2}),
 ('8', '9', {'Weight': 1})]
Pandas数据格式
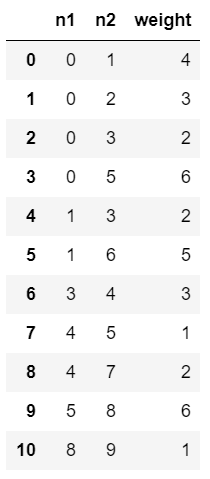
1 G_df = pd.read_csv('G_edgelist.txt', delim_whitespace=True,
2                    header=None, names=['n1', 'n2', 'weight'])
3 G_df
1 G5 = nx.from_pandas_dataframe(G_df, 'n1', 'n2', edge_attr='weight')
2 G5.edges(data=True)
[(0, 1, {'weight': 4}),
 (0, 2, {'weight': 3}),
 (0, 3, {'weight': 2}),
 (0, 5, {'weight': 6}),
 (1, 3, {'weight': 2}),
 (1, 6, {'weight': 5}),
 (3, 4, {'weight': 3}),
 (5, 4, {'weight': 1}),
 (5, 8, {'weight': 6}),
 (4, 7, {'weight': 2}),
 (8, 9, {'weight': 1})]

棋子模型
1 !head -5 chess_graph.txt
1 2 0	885635999.999997
1 3 0	885635999.999997
1 4 0	885635999.999997
1 5 1	885635999.999997
1 6 0	885635999.999997
每个节点都是棋手,每条边代表一个游戏。 具有传出边缘的第一列对应于白色棋子,具有传入边缘的第二列对应于黑色棋子。
第三栏,边缘的重量,对应于游戏的结果。 1的权重表示白赢,0表示平局,-1表示黑赢。
第四列对应于游戏进行时的大致时间戳。
我们可以使用read_edgelist读取国际象棋图,并告诉它使用nx.MultiDiGraph创建图。
1 chess = nx.read_edgelist('chess_graph.txt', data=[('outcome', int), ('timestamp', float)],
2                          create_using=nx.MultiDiGraph())
1 chess.is_directed(), chess.is_multigraph()
(True, True)
1 chess.edges(data=True)
[('1', '2', {'outcome': 0, 'timestamp': 885635999.999997}),
 ('1', '3', {'outcome': 0, 'timestamp': 885635999.999997}),
 ('1', '4', {'outcome': 0, 'timestamp': 885635999.999997}),
 ('1', '5', {'outcome': 1, 'timestamp': 885635999.999997}),
 ('1', '6', {'outcome': 0, 'timestamp': 885635999.999997}),
 ('1', '807', {'outcome': 0, 'timestamp': 896148000.000003}),
 ('1', '454', {'outcome': 0, 'timestamp': 896148000.000003}),
 ('1', '827', {'outcome': 0, 'timestamp': 901403999.999997}),
....
('38', '40', {'outcome': 1, 'timestamp': 885635999.999997}),
 ('38', '41', {'outcome': -1, 'timestamp': 885635999.999997}),
 ('38', '3101', {'outcome': -1, 'timestamp': 985500000.0}),
 ('38', '84', {'outcome': -1, 'timestamp': 985500000.0}),
 ('38', '3104', {'outcome': 1, 'timestamp': 985500000.0}),
 ...]
看看每个节点的程度,我们可以看到每个人玩过多少游戏。 一个字典被返回,每个键是玩家,每个值是玩的游戏数量。
1 games_played = chess.degree()
2 games_played
{'1': 48,
 '2': 112,
 '3': 85,
 '4': 12,
 '5': 18,
 '6': 95,
 '7': 9,
 '8': 20,
 '9': 142,
...
'995': 18,
 '996': 8,
 '997': 45,
 '998': 10,
 '999': 22,
 '1000': 7,
 ...}
#Using list comprehension, we can find which player played the most games.

1 max_value = max(games_played.values())
2 max_key, = [i for i in games_played.keys() if games_played[i] == max_value]
3
4 print('player {}
{} games'.format(max_key, max_value))
player 461
280 games
1 #Let's use pandas to find out which players won the most games. First let's convert our graph to a DataFrame.
2 df = pd.DataFrame(chess.edges(data=True), columns=['white', 'black', 'outcome'])
3 df.head()

1 #Next we can use a lambda to pull out the outcome from the attributes dictionary.
2 df['outcome'] = df['outcome'].map(lambda x: x['outcome'])
3 df.head()

为了统计玩家用白色棋子赢得的次数,我们找到结果为'1'的行,由白色玩家分组,并且求和。
为了统计玩家用黑色棋子赢回的次数,我们找到结果为'-1'的行,黑人玩家分组,求和,乘以-1。
对于那些只能以黑色或白色进行游戏的玩家,我们可以将它们加在一起,填充值为0。
1 won_as_white = df[df['outcome']==1].groupby('white').sum()
2 won_as_black = -df[df['outcome']==-1].groupby('black').sum()
3 win_count = won_as_white.add(won_as_black, fill_value=0)
4 win_count.head()

1 #Using nlargest we find that player 330 won the most games at 109.
2 win_count.nlargest(5, 'outcome')
