Go 自带了测试框架和工具,在 testing 包中,以便完成单元测试(T 类型)和性能测试(B 类型)。一般测试代码放在
*_test.go文件中,与被测代码放于同一个包中。
单元测试
测试函数名称格式是:Test[^a-z],即以 Test 开头,跟上非小写字母开头的字符串。每个测试函数都接受一个testing.T 类型参数,用于输出信息或中断测试。
测试方法有:
- Fail: 标记失败,但继续执行当前测试函数
- FailNow: 失败,立即终止当前测试函数执行
- Log: 输出错误信息
- Error: Fail + Log
- Fatal: FailNow + Log
- Skip: 跳过当前函数,通常用于未完成的测试用例
测试代码:
// filename: add_test.go

package test
import (
    "testing"
)

func Add(a, b int) int {
    return a + b
}

func TestAdd1(t *testing.T) {
    if Add(2, 3) != 5 {
         t.Error("result is wrong!")
    } else {
         t.Log("result is right")
    }
}

func TestAdd2(t *testing.T) {
    if Add(2, 3) != 6 {
         t.Fatal("result is wrong!")
    } else {
         t.Log("result is right")
    }
}
运行以下命令,自动搜集所有的测试文件(*_test.go),提取全部测试函数。
$ go test
输出:
--- FAIL: TestAdd2 (0.00s)
    add_test.go:20: result is wrong!
FAIL
exit status 1
FAIL    _/Users/golang_learning/testTB  0.006s
输出结果包括:出错的测试函数名称,执行时长和错误信息
go test 还有以下参数:
- -v:显示所有测试函数运行细节
$ go test -v
输出:
=== RUN   TestAdd1
--- PASS: TestAdd1 (0.00s)
    add_test.go:14: result is right
=== RUN   TestAdd2
--- FAIL: TestAdd2 (0.00s)
    add_test.go:20: result is wrong!
FAIL
exit status 1
FAIL    _/Users/golang_learning/testTB  0.007s
- -run regex:指定要执行的测试函数
$ go test -run TestAdd2
输出:
--- FAIL: TestAdd2 (0.00s)
    add_test.go:20: result is wrong!
FAIL
exit status 1
FAIL    _/Users/golang_learning/testTB  0.006s
性能测试
性能测试函数以 Benchmark 开头,参数类型是 testing.B,可与 Test 函数放在同个文件中。默认情况下,go test 不执行 Benchmark 测试,必须用-bench <pattern>指定性能测试函数。
测试代码:
// filename: add_test.go
package test
import (
    "testing"
)

func Add(a, b int) int {
    return a + b
}

func Benchmark(b *testing.B) {
    for i := 0; i < b.N; i++ { // b.N,测试循环次数
        Add(4, 5)
    }
}
执行命令测试:
$ go test -bench=.
输出:
goos: darwin
goarch: amd64
Benchmark-4     2000000000           0.35 ns/op
PASS
ok      _/Users/golang_learning/testTB  0.753s
B 类型也有以下参数:
- benchmem:输出内存分配统计
- benchtime:指定测试时间
- cpu:指定 GOMAXPROCS
- timeout:超时限制
$ go test -v -bench=. -cpu=8 -benchtime="3s" -timeout="5s" -benchmem
输出:
goos: darwin
goarch: amd64
Benchmark-8     5000000000           0.34 ns/op        0 B/op          0 allocs/op
PASS
ok      _/Users/golang_learning/testTB  1.766s
- Benchmark-8:-cpu 参数指定,-8 表示 8 个 CPU 线程执行
- 5000000000:表示总共执行了 5000000000 次
- 0.34 ns/op:表示每次执行耗时 0.34 纳秒
- 0 B/op:表示每次执行分配的内存(字节)
- 0 allocs/op:表示每次执行分配了多少次对象
pprof
go tools 继承了 pprof,以便进行性能测试并找出瓶颈。
测试数据文件生成有两种方法:命令行和代码
命令行生成测试数据文件
$ go test -bench=. -cpuprofile cpu.out
输出:
goos: darwin
goarch: amd64
Benchmark-4     2000000000           0.35 ns/op
PASS
ok      _/Users/golang_learning/testTB  0.911s
$ ls
输出:(上一条命令生成cpu.out和testTB.test)
add_test.go     cpu.out     testTB.test
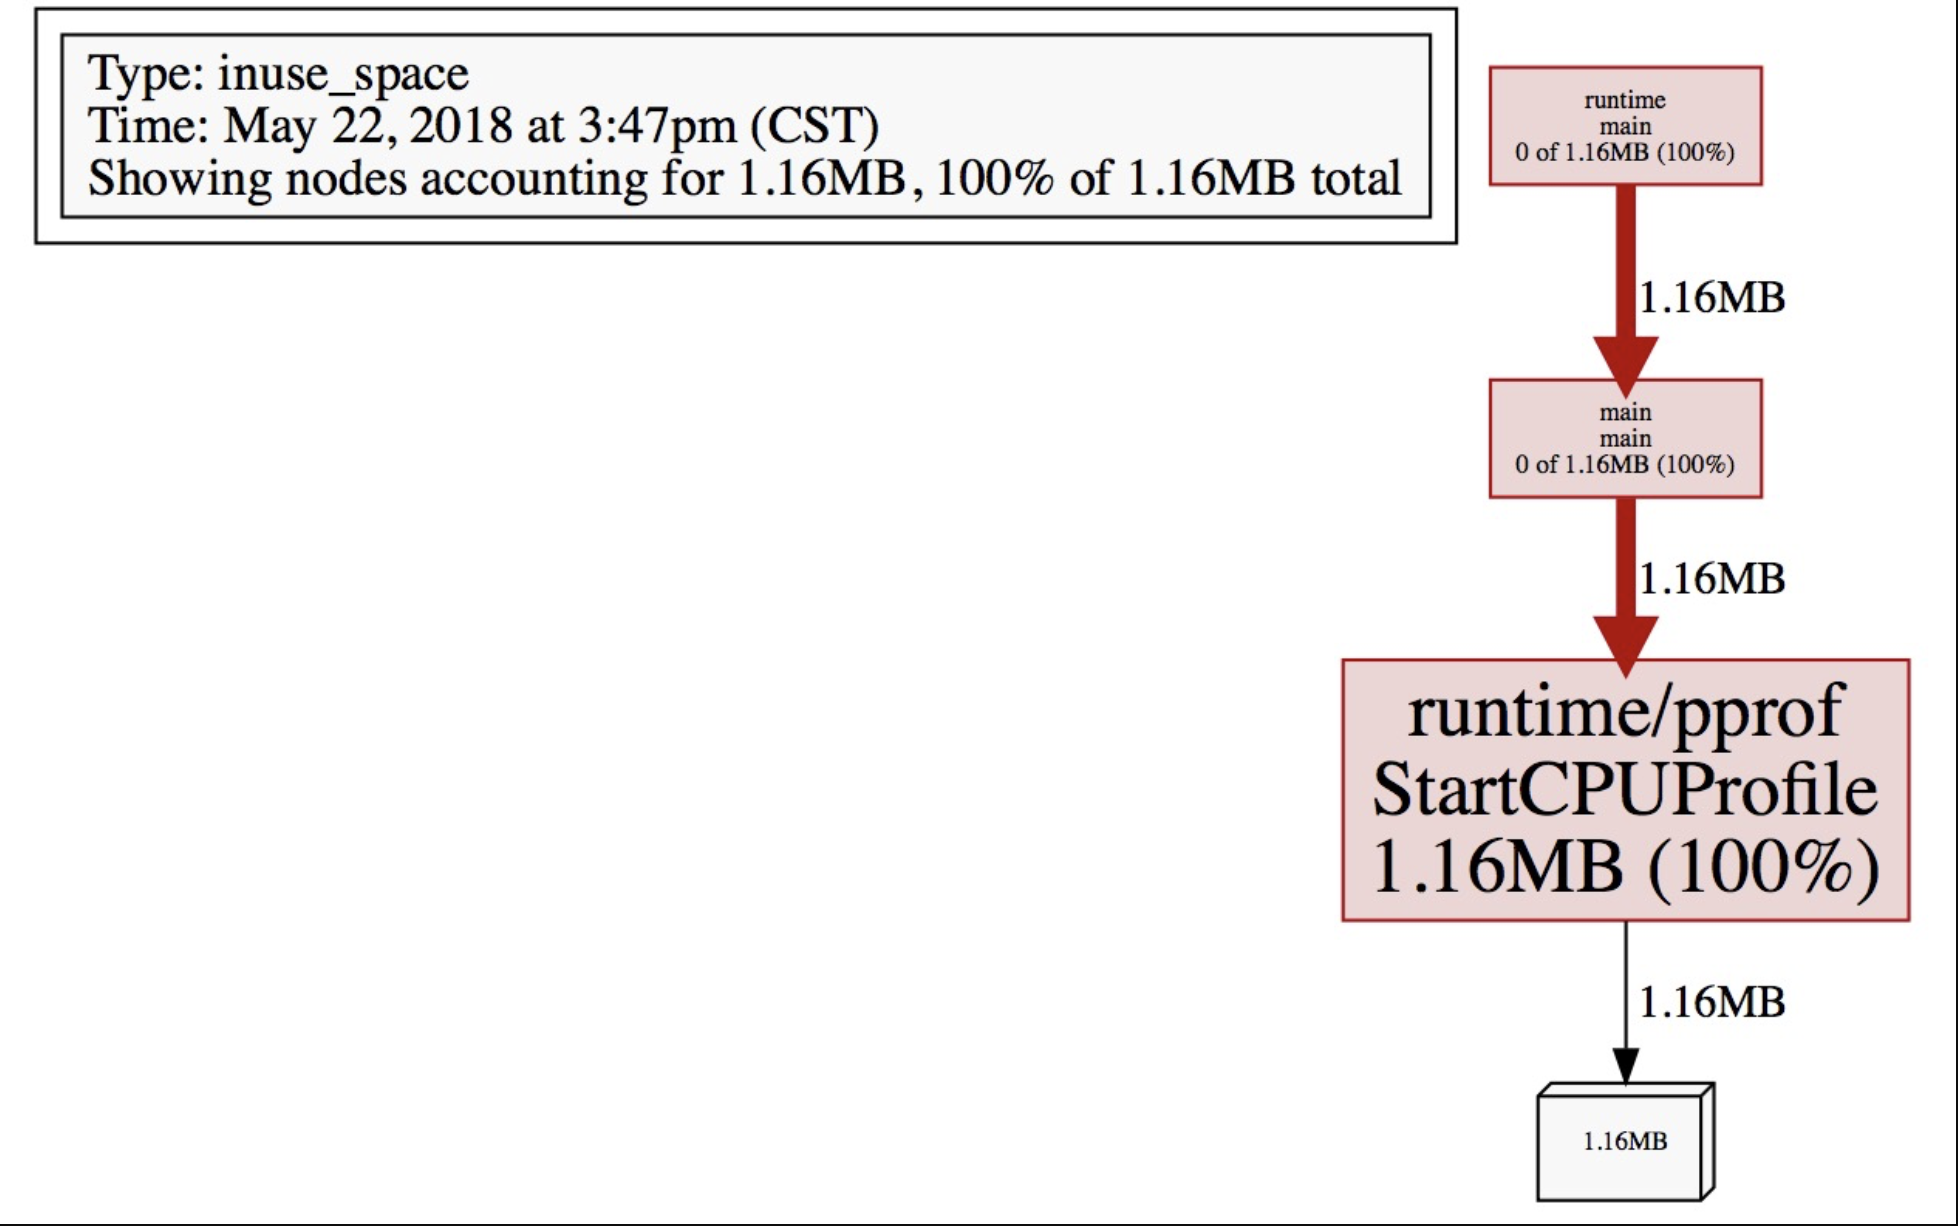
用命令行分析
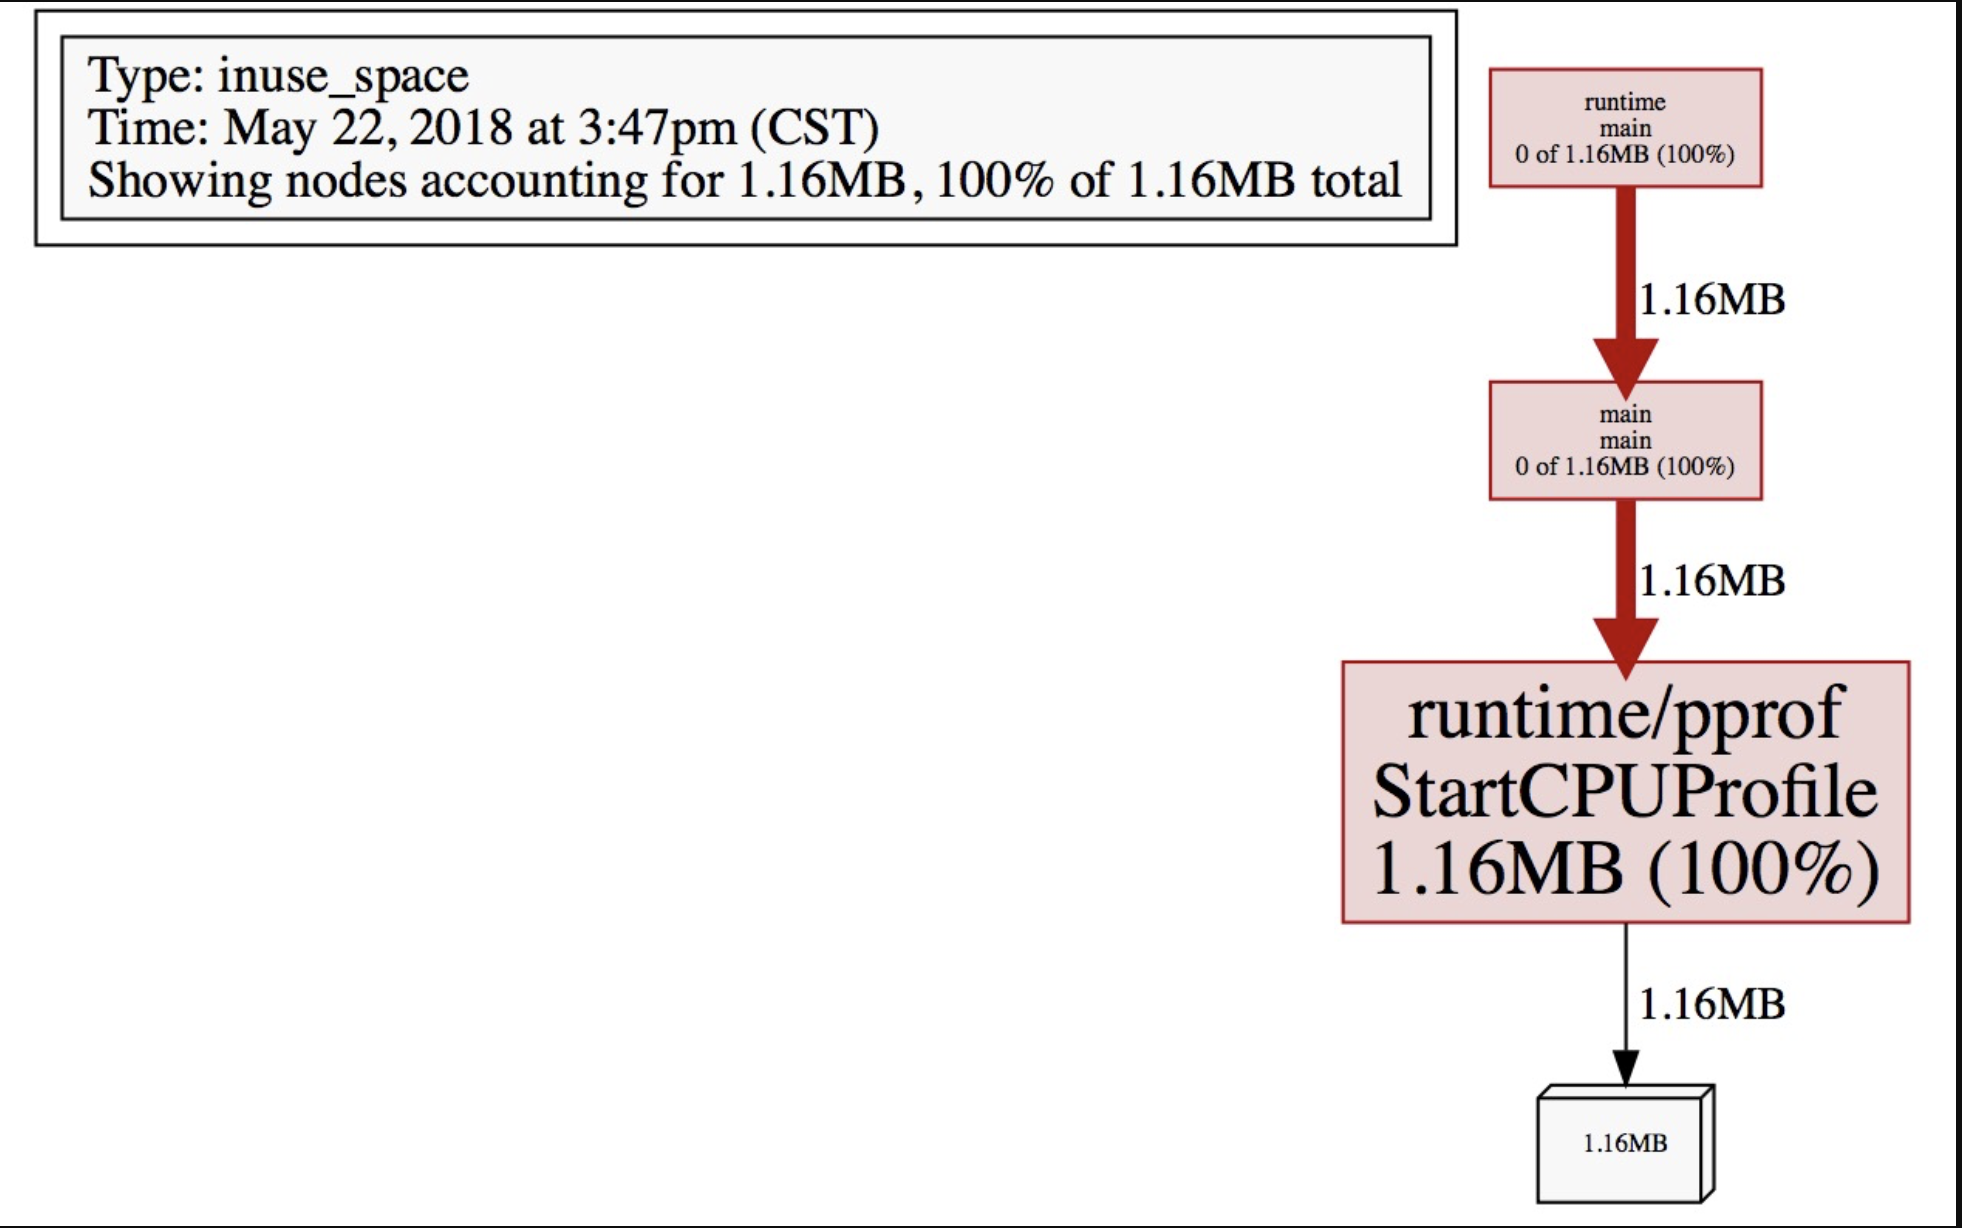
$ go tool pprof -text mem.out
输出:
Main binary filename not available.
Type: inuse_space
Time: May 22, 2018 at 3:36pm (CST)
Showing nodes accounting for 1.16MB, 100% of 1.16MB total
      flat  flat%   sum%        cum   cum%
    1.16MB   100%   100%     1.16MB   100%  runtime/pprof.StartCPUProfile
         0     0%   100%     1.16MB   100%  main.main
         0     0%   100%     1.16MB   100%  runtime.main
pprof 交互模式分析
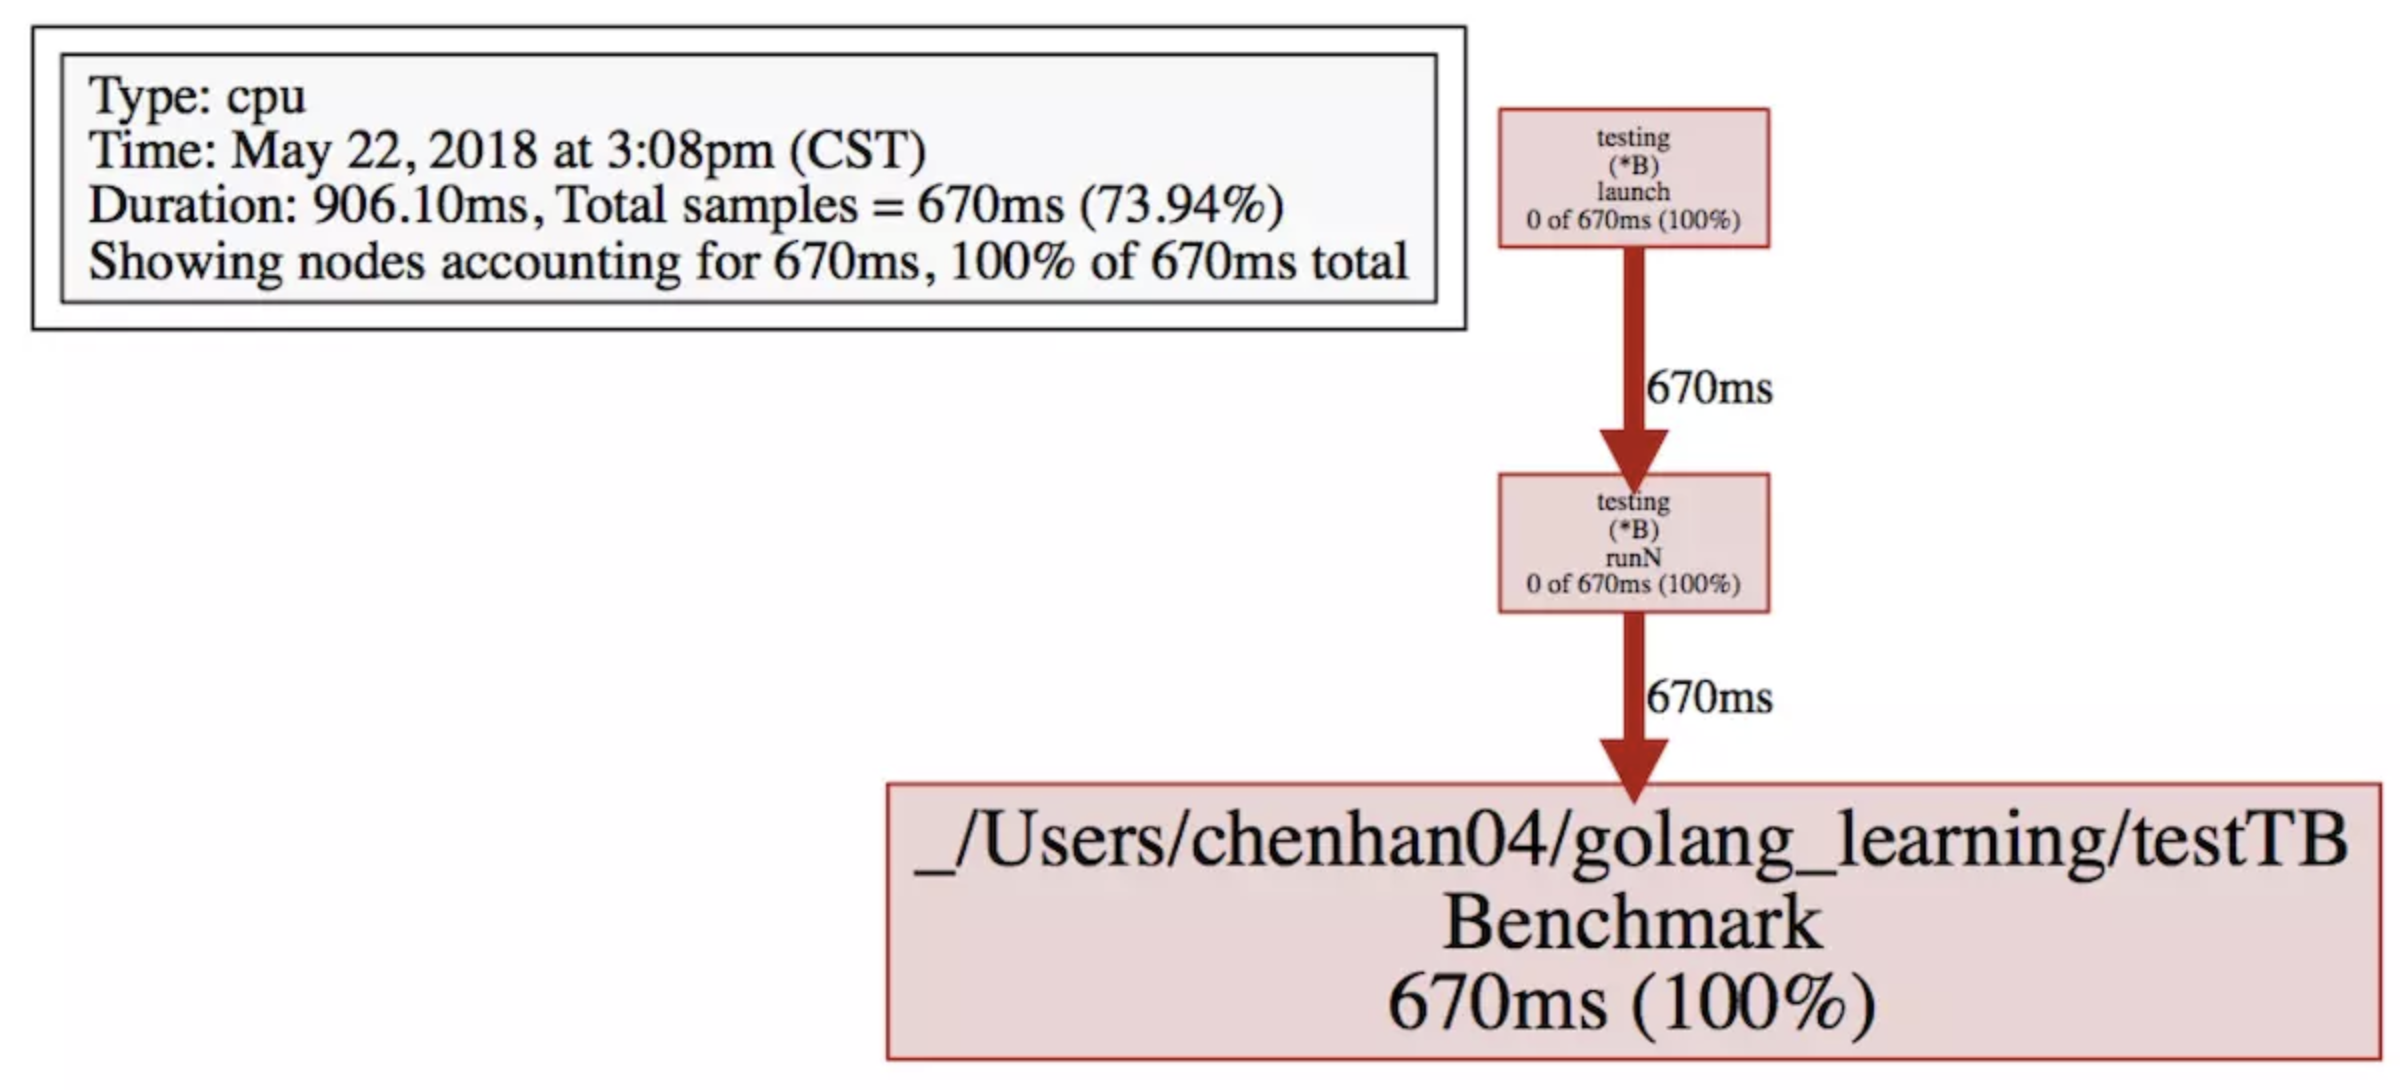
$ go tool pprof testTB.test cpu.out
输出:
File: testTB.test
Type: cpu
Time: May 22, 2018 at 3:08pm (CST)
Duration: 906.10ms, Total samples = 670ms (73.94%)
Entering interactive mode (type "help" for commands, "o" for options)
(pprof) top
输出:
Showing nodes accounting for 670ms, 100% of 670ms total
      flat  flat%   sum%        cum   cum%
     670ms   100%   100%      670ms   100%  _/Users/golang_learning/testTB.Benchmark
         0     0%   100%      670ms   100%  testing.(*B).launch
         0     0%   100%      670ms   100%  testing.(*B).runN
(pprof) quit
以上性能指标含义:
- 函数本地采样数量(不包含其调用的其他函数)
- 函数本地采样数量所占百分比
- 前几个函数(包括当前函数)本地采样总和所占百分比
- 函数(包括其调用的函数)采样总数量
- 函数采样总数量所占百分比
pprof 交互模式命令:
- top、top10: 显示前几条信息;
- web:以 svg 文件展示。
pdf 或者 svg 分析
$ go tool pprof -svg cpu.out > cpu.svg
$ go tool pprof -pdf cpu.out > cpu.pdf
$ ls(以上命令生成cpu.pdf和cpu.svg文件)
add_test.go   cpu.out    cpu.pdf        cpu.svg     testTB.test
打开 cpu.pdf 或者 cpu.svg 文件
代码生成测试数据文件
用 runtime/pprof 包生成 cpu 和 mem 文件
// filename: pprof.go
package main
import (
    "os"
    "runtime/pprof"
)

func main() {
    w, _ := os.Create("cpu.out")
    defer w.Close()
    pprof.StartCPUProfile(w)
    defer pprof.StopCPUProfile()

    w2, _ := os.Create("mem.out")
    defer w2.Close()
    defer pprof.WriteHeapProfile(w2)

    Sum(3, 5)

}

func Sum(a, b int) int {
    return a + b
}
编译并执行以上文件
$ go build pprof.go
$ ./pprof
$ ls(./pprof命令生成cpu.out和mem.out文件)
cpu.out     mem.out     pprof       pprof.go
生成 pdf 文件
$ go tool pprof -pdf cpu.out > cpu.pdf
$ go tool pprof -pdf mem.out > mem.pdf
net/http/pprof
若是测量 http server 的性能,则需要使用 net/http/pprof 包。只需要在源文件中加入代码
import (
    _ "net/http/pprof"
)
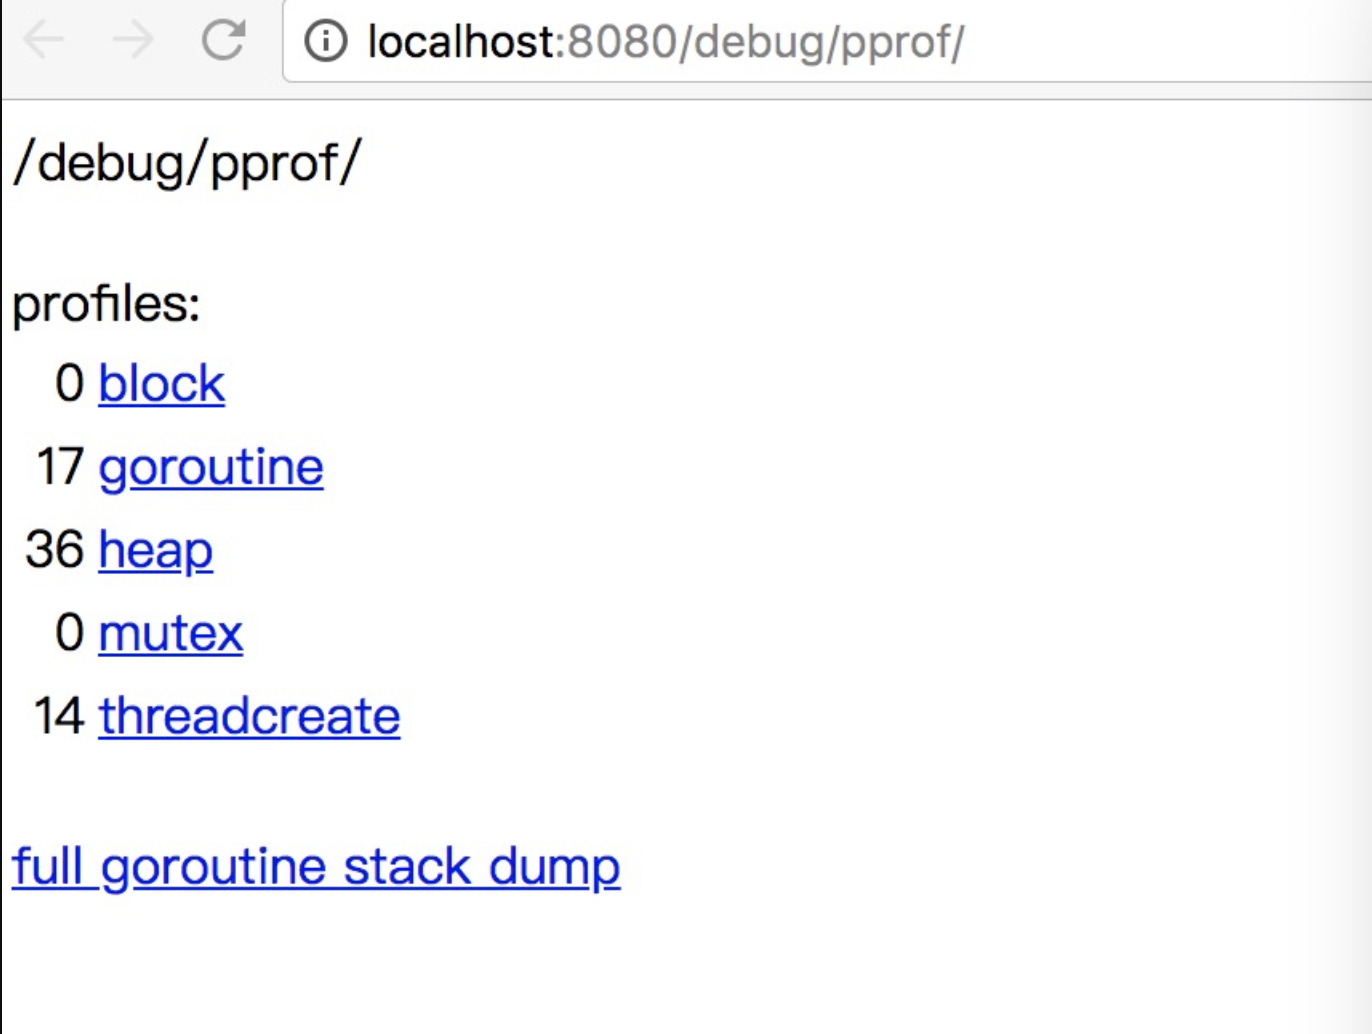
cpu 分析
启动 http server,然后在浏览器中访问链接:http://localhost:[port]/debug/pprof/就能看到 prof 信息了:
若要生成 CPU 状态分析图,可使用以下命令:
$ go tool pprof http://localhost:port/debug/pprof/profile
就会进入 30 秒的 profile 收集时间,在这段事件内向服务器连续发送多次请求,尽量让 cpu 占用性能产生数据。
$ go tool pprof http://localhost:8080/debug/pprof/profile
输出:
Fetching profile over HTTP from http://localhost:8080/debug/pprof/profile
// 这里会阻塞30s收集profile,在这段时间应多发请求
Saved profile in /Users/pprof/pprof.samples.cpu.002.pb.gz
Type: cpu
Time: May 22, 2018 at 7:16pm (CST)
Duration: 30s, Total samples = 330ms ( 1.10%)
Entering interactive mode (type "help" for commands, "o" for options)
(pprof) top10
输出:(前10条信息)
Showing nodes accounting for 330ms, 100% of 330ms total
Showing top 10 nodes out of 39
      flat  flat%   sum%        cum   cum%
     100ms 30.30% 30.30%      100ms 30.30%  runtime.mach_semaphore_signal
      60ms 18.18% 48.48%       60ms 18.18%  runtime.mach_semaphore_timedwait
      60ms 18.18% 66.67%       60ms 18.18%  runtime.mach_semaphore_wait
      ... ...
(pprof) web
// 在浏览器中以svg文件的方式展示cpu占用图
内存分析
启动服务器,访问链接http://localhost:port/debug/pprof/heap,就会自动下载 heap 文件,调用以下命令,进入 pprof 交互模式
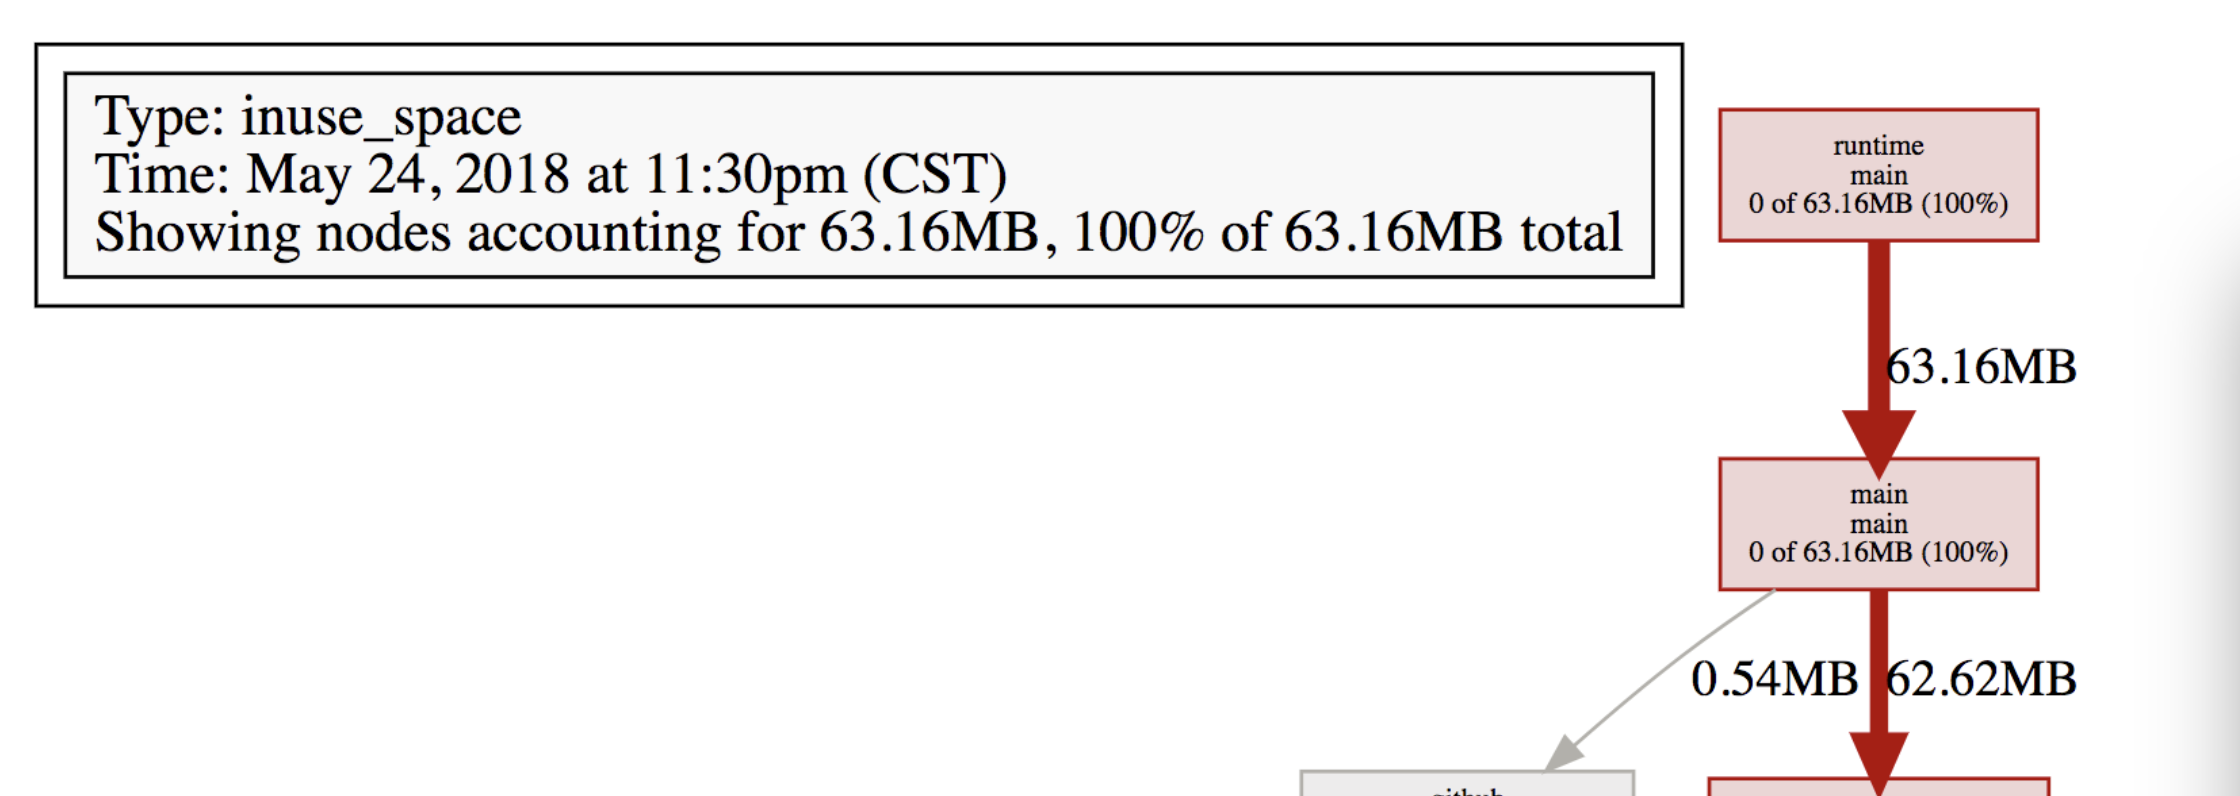
$ go tool pprof heap
Main binary filename not available.
Type: inuse_space
Time: May 24, 2018 at 11:30pm (CST)
Entering interactive mode (type "help" for commands, "o" for options)
(pprof) top5
Showing nodes accounting for 62.02MB, 98.20% of 63.16MB total
Showing top 5 nodes out of 26
      flat  flat%   sum%        cum   cum%
   21.67MB 34.31% 34.31%    21.67MB 34.31%  bytes.makeSlice
   20.50MB 32.46% 66.77%    20.50MB 32.46%  reflect.unsafe_New
      15MB 23.75% 90.52%       15MB 23.75%  github.com/golang/protobuf/proto.(*word32Slice).Append
    2.85MB  4.51% 95.03%     2.85MB  4.51%  github.com/golang/protobuf/proto.(*structPointerSlice).Append
       2MB  3.17% 98.20%        2MB  3.17%  github.com/golang/protobuf/proto.word32_Set
(pprof) web