一、Weave Scope:
Weave Scope 容器地图
创建 Kubernetes 集群并部署容器化应用只是第一步。一旦集群运行起来,我们需要确保一起正常,所有必要组件就位并各司其职,有足够的资源满足应用的需求。Kubernetes 是一个复杂系统,运维团队需要有一套工具帮助他们获知集群的实时状态,并为故障排查提供及时和准确的数据支持。
Weave Scope 是 Docker 和 Kubernetes 可视化监控工具。Scope 提供了至上而下的集群基础设施和应用的完整视图,用户可以轻松对分布式的容器化应用进行实时监控和问题诊断。
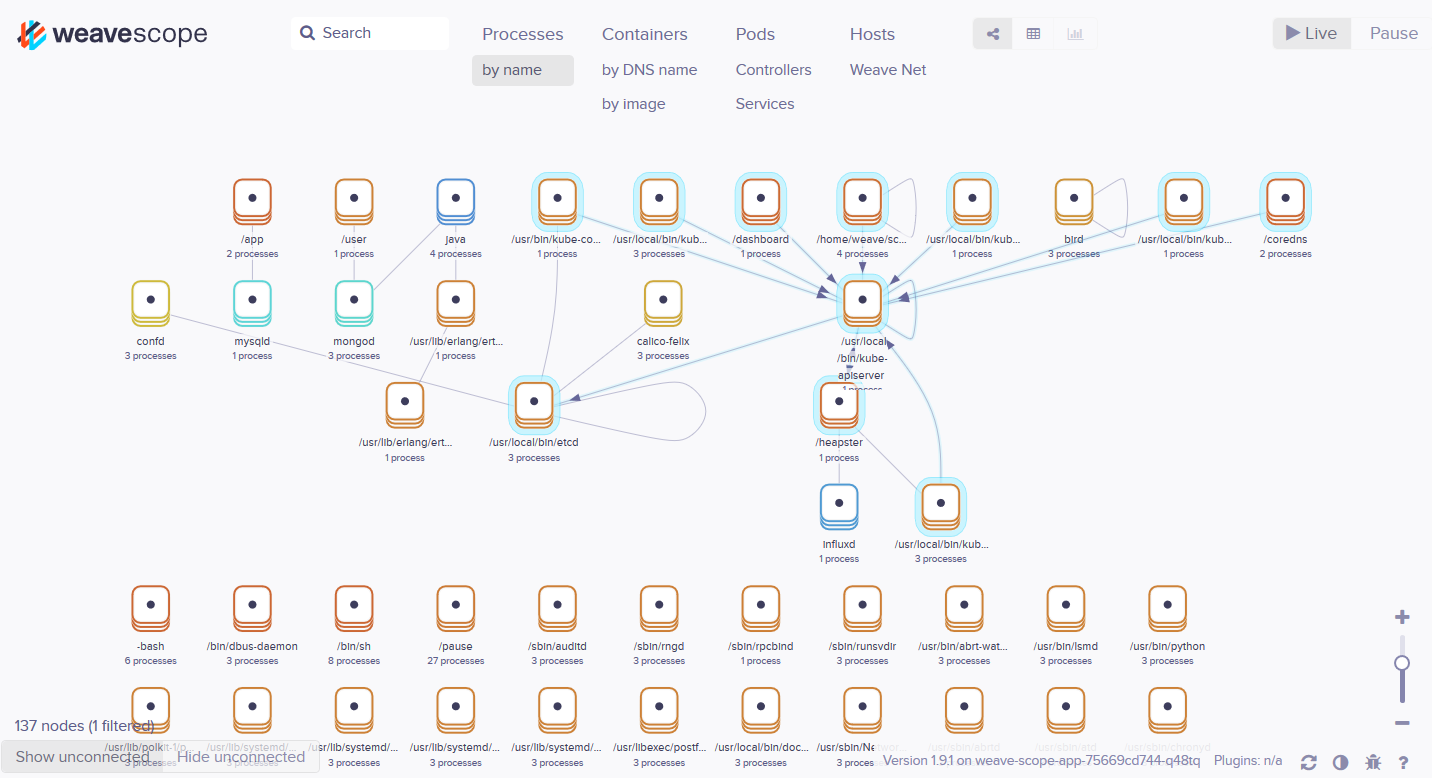
Weave Scope 的最大特点是会自动生成一张 Docker 容器地图,让我们能够直观地理解、监控和控制容器。千言万语不及一张图,先感受一下。
Weave Scope部署
安装 Scope 的方法很简单,执行如下命令:
#kubectl apply -f scope.yaml
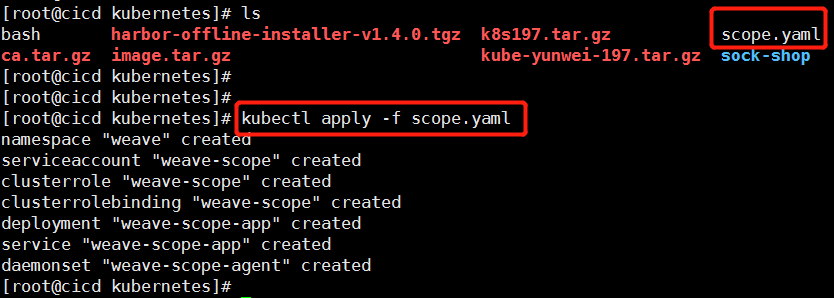
部署成功后,有如下相关组件:

-
DaemonSet weave-scope-agent,集群每个节点上都会运行的 scope agent 程序,负责收集数据。
-
Deployment weave-scope-app,scope 应用,从 agent 获取数据,通过 Web UI 展示并与用户交互。
-
Service weave-scope-app,默认是 ClusterIP 类型,为了方便已通过 kubectl edit 修改为 NodePort。
使用weavescope
登陆weavescope
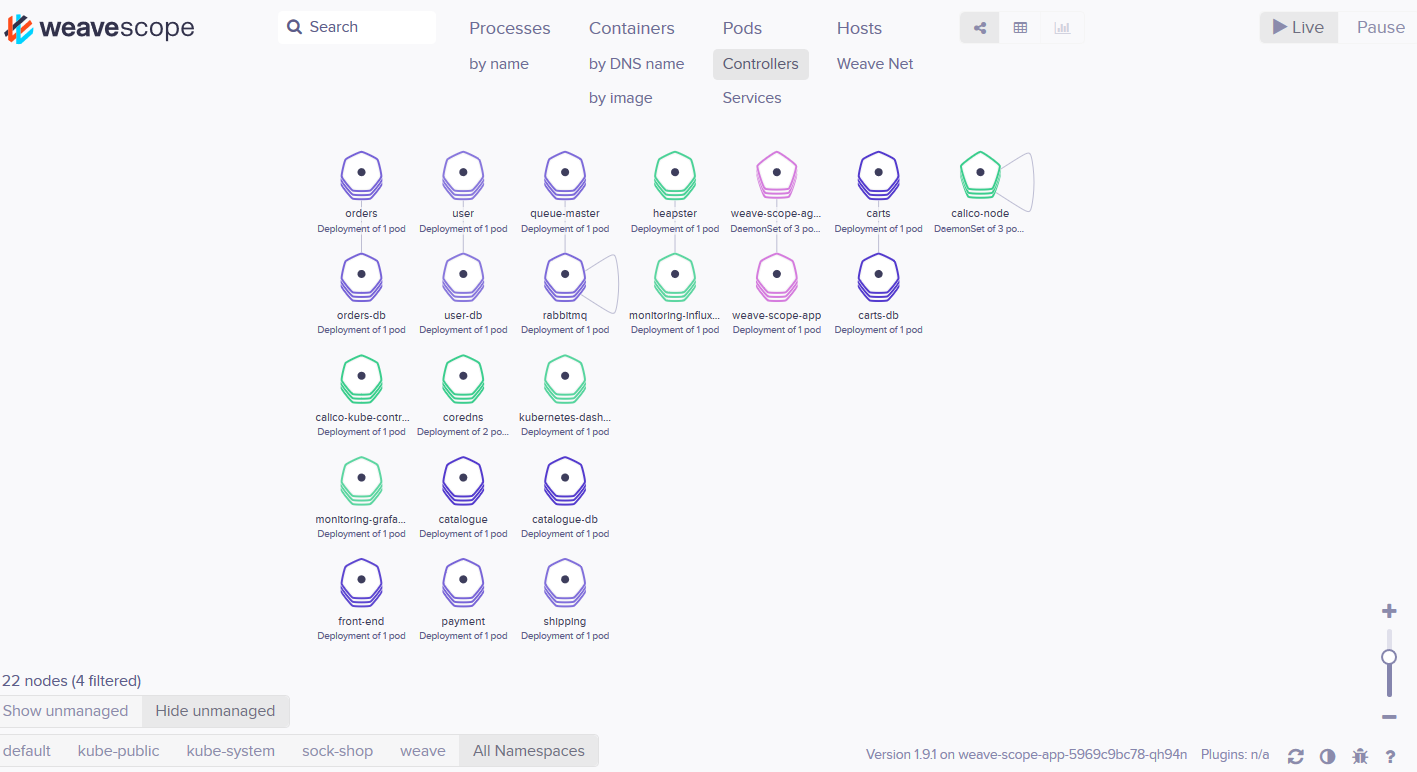
浏览器访问 http://ip:28125/,Scope 默认显示当前所有的Controller(Deployment、DaemonSet 等)。
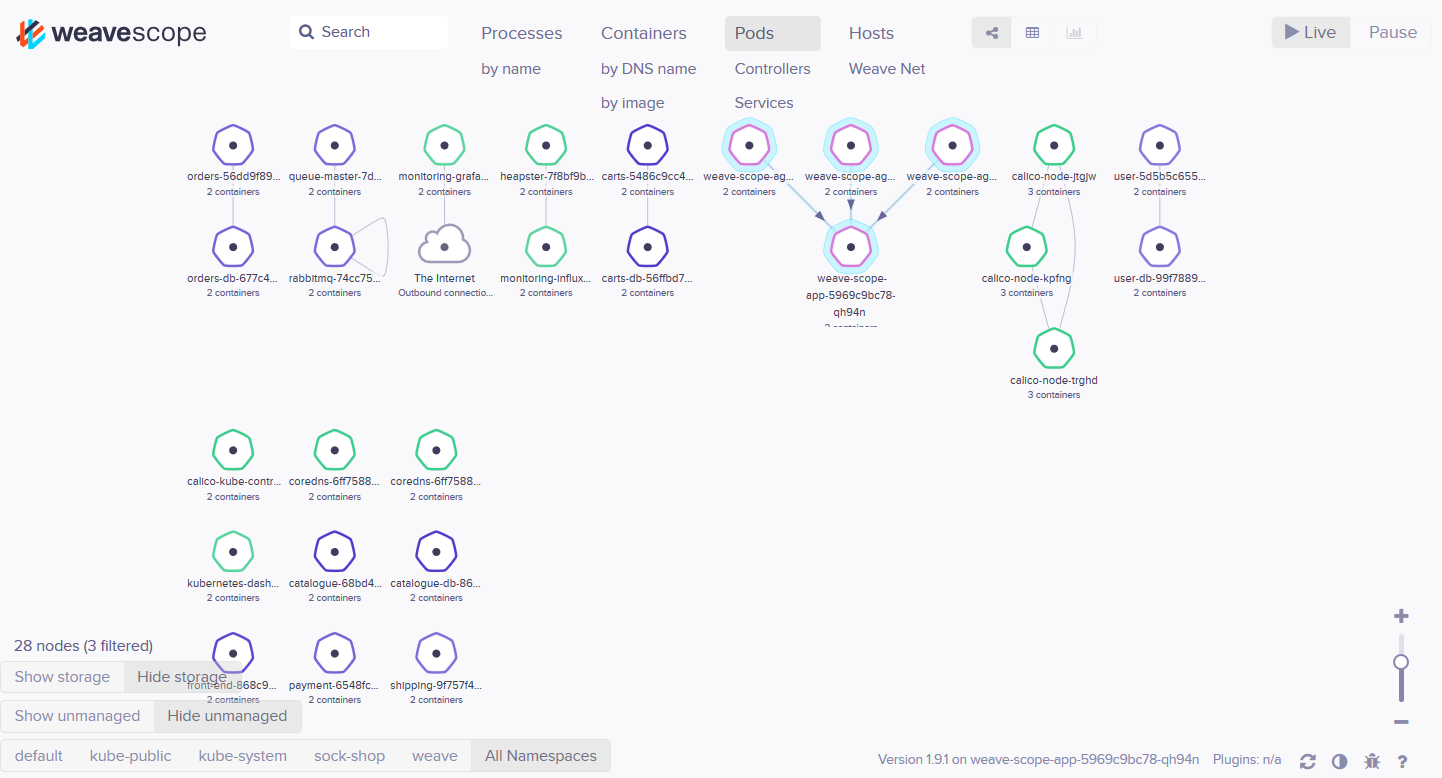
拓扑结构
Scope 会自动构建应用和集群的逻辑拓扑。比如点击顶部 PODS,会显示所有 Pod 以及 Pod 之间的依赖关系。
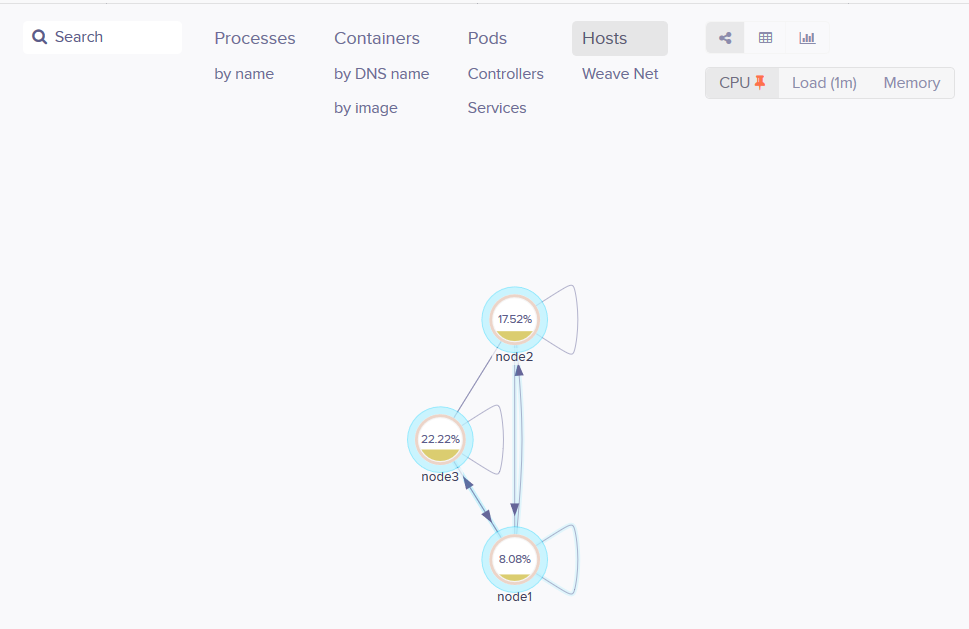
点击 HOSTS,会显示各个节点之间的关系。
实时资源监控
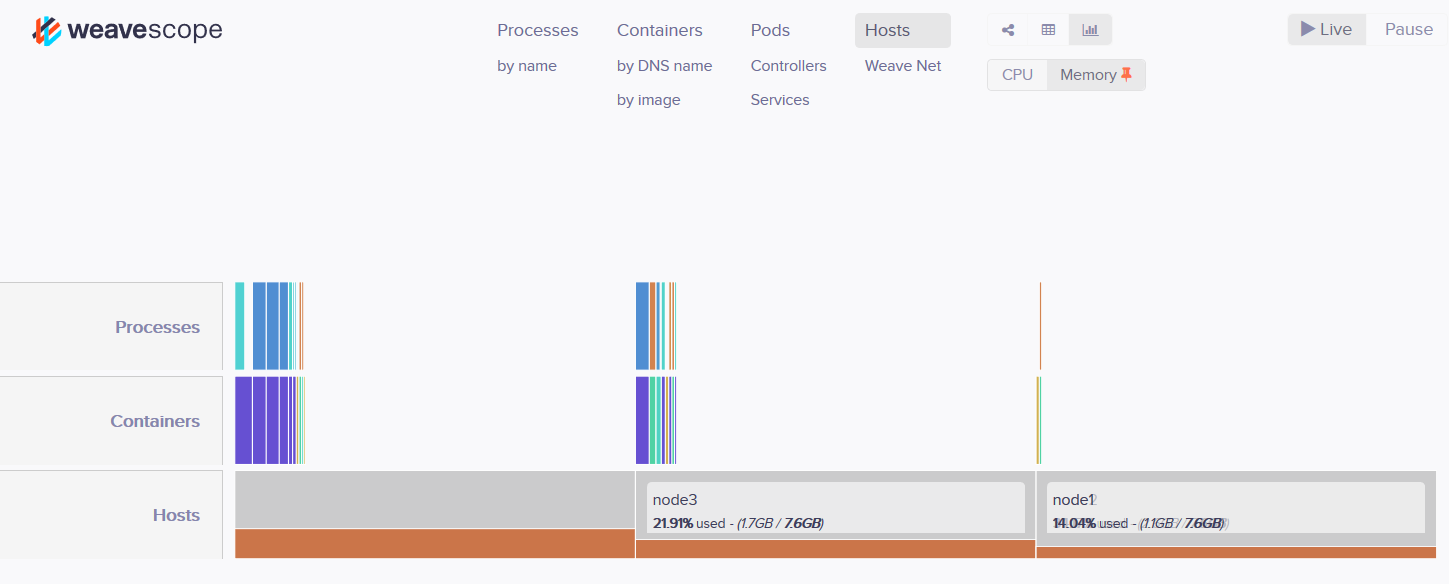
可以在 Scope 中查看资源的 CPU 和内存使用情况。
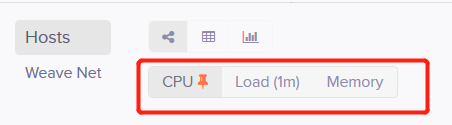
支持图,表,柱状图显示

在线操作
Scope 还提供了便捷的在线操作功能,比如选中某个 Host,点击 >_ 按钮可以直接在浏览器中打开节点的命令行终端:

点击 Deployment 的 + 可以执行 Scale Up 操作:

可以 attach、restart、stop 容器,以及直接在 Scope 中排查问题:

详细信息包括这么几部分:
Status:CPU、内存的实时使用情况以及历史曲线。
INFO:容器 image、启动命令、状态、网络等信息。
以下几项需拉动滚动条查看。

PROCESSES:容器中运行的进程。
ENVIRONMENT VARIABLES:环境变量。
DOCKER LABELS:容器启动命令。
IMAGE:镜像详细信息。
在容器信息的上面还有一排操作按钮。

attach 到容器启动进程,相当于执行 docker container attach
打开shell,相当于执行docker container exec
重启容器,相当于执行 docker container restart
暂停容器,相当于执行 docker container pause
关闭容器,相当于执行 docker container stop
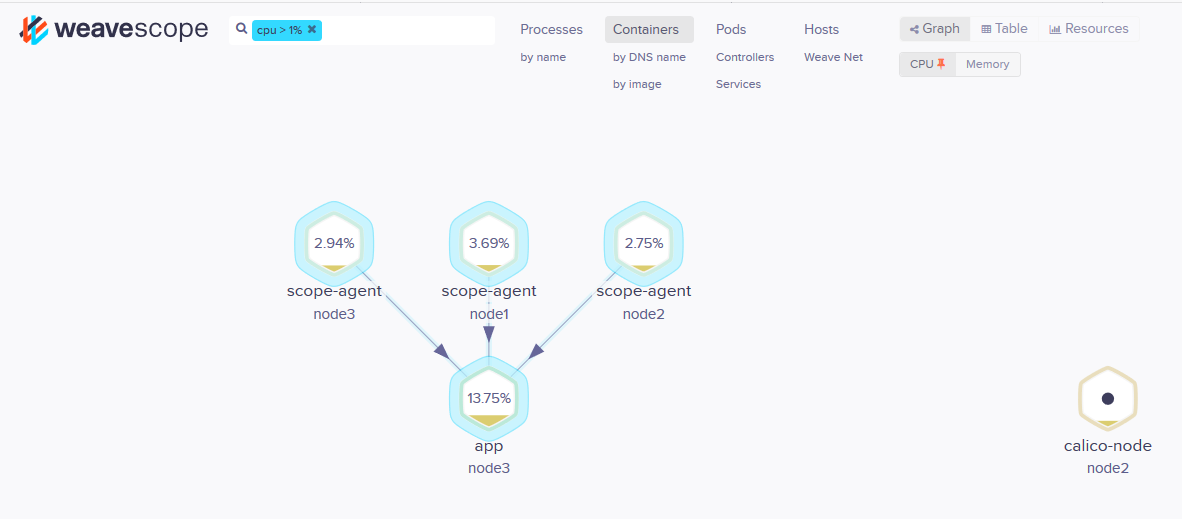
强大的搜索功能
Scope 支持关键字搜索和定位资源。
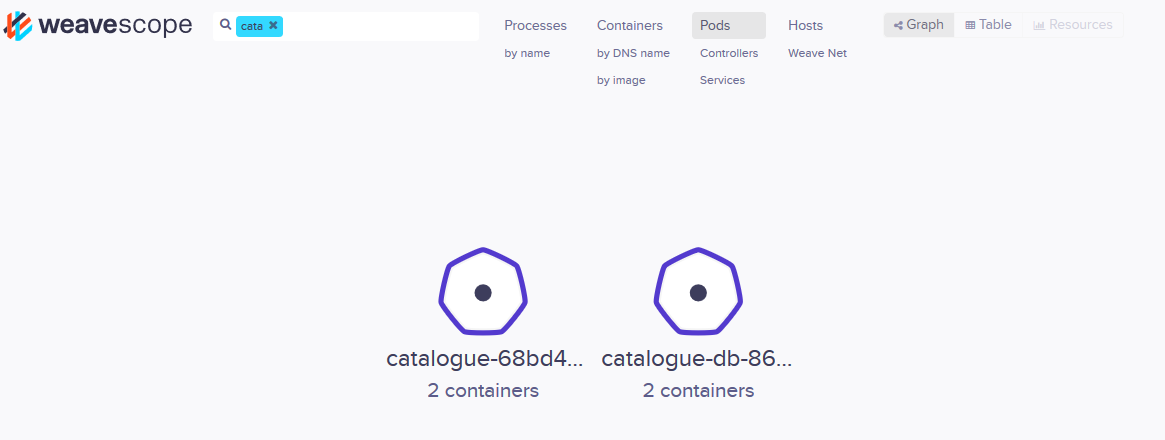
还可以进行条件搜索,比如查找和定位 cpu > 1% 的 Containers 。
Weave Scope 界面极其友好,操作简洁流畅,更多功能留给大家去探索。

二、用 Heapster 监控集群:
Heapster介绍
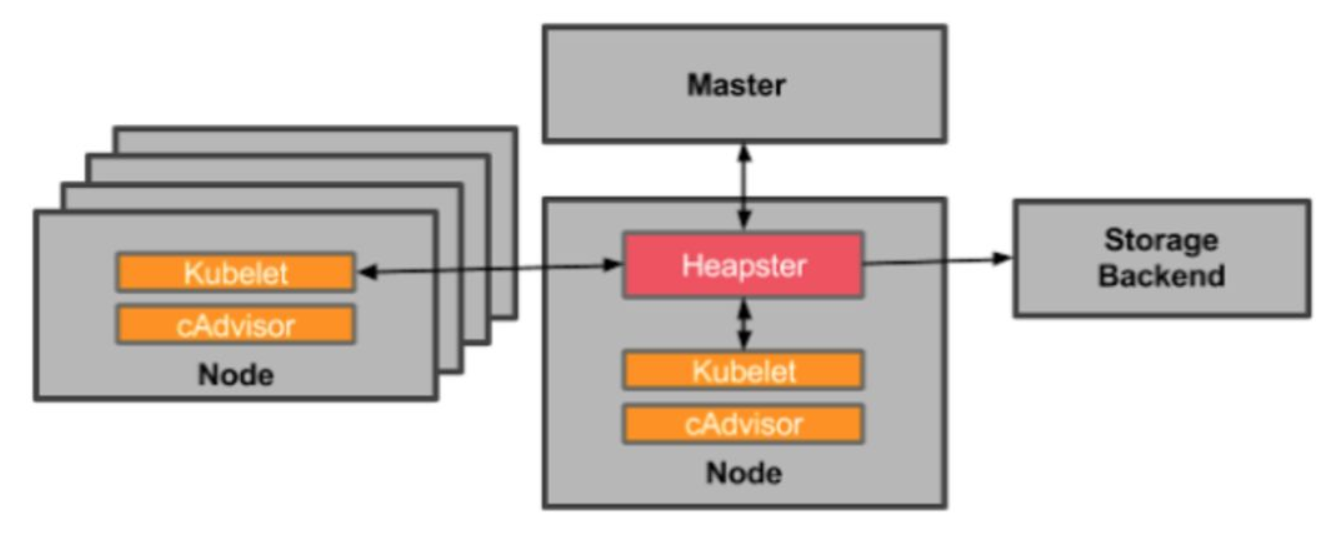
Heapster 是 Kubernetes 原生的集群监控方案。Heapster 以 Pod 的形式运行,它会自动发现集群节点、从节点上的 Kubelet 获取监控数据。Kubelet 则是从节点上的 cAdvisor 收集数据。
Heapster 将数据按照 Pod 进行分组,将它们存储到预先配置的 backend 并进行可视化展示。Heapster 当前支持的 backend 有 InfluxDB(通过 Grafana 展示),Google Cloud Monitoring 等。Heapster 的整体架构如下图所示:
Heapster 本身是一个 Kubernetes 应用,部署方法很简单,之前章节中我们实践了由 Heapster、InfluxDB 和 Grafana 组成的监控方案。Kubelet 和 cAdvisor 是 Kubernetes 的自带组件,无需额外部署。