图像缩放
图像缩放主要是调用resize()函数实现,result = cv2.resize(src, dsize[, result[.fx, fy[,interpolation]]]) 其中src表示原始图像,dsize表示缩放大小, fx,fy也可以表示缩放大小倍数,他们两个设置一个即可实现图像缩放。
eg: result = cv2.resize(src, (160, 60)) | result = cv2.resize(src, None, fx=0.5, fy=0.5)
代码如下:
import cv2
def test16():
    src = cv2.imread("rose.jpg")
    # 图像缩放,设置的dsize是列数为200, 行数为100
    result = cv2.resize(src, (200, 100))
    print(result.shape)   # (100, 200, 3)
    cv2.imshow("demo1", src)
    cv2.imshow("demo2", result)
    if cv2.waitKey(0) == 27:
        cv2.destroyWindow("demo1")
        cv2.destroyWindow("demo2")

test16()
效果如下:

也可以获取原始图像像素再乘以缩放系数进行图像转换
代码如下:
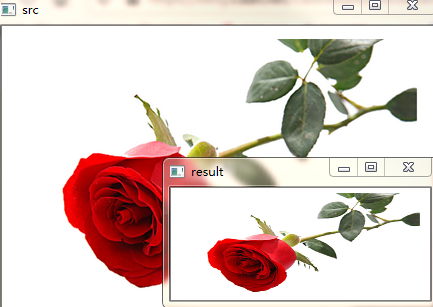
import cv2
def test17():
    src = cv2.imread("rose.jpg")
    rows, cols = src.shape[:2]

    # 图像缩放dsize(列,行)
    result = cv2.resize(src, (int(cols*0.6), int(rows*0.4)))
    cv2.imshow("src", src)
    cv2.imshow("result", result)
    cv2.waitKey(0)
    cv2.destroyAllWindows()
test17()
效果如下:
(fx,fy)缩放倍数的方法对图像进行放大或缩小
代码如下:
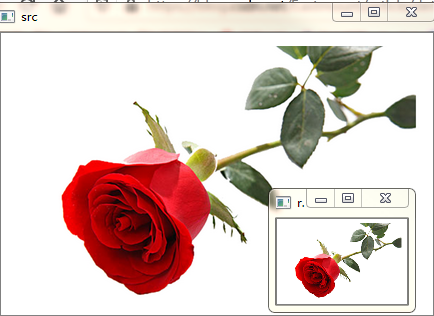
import cv2

def test18():
    src = cv2.imread("rose.jpg")

    # 图像缩放
    result = cv2.resize(src, None, fx=0.3, fy=0.3)
    cv2.imshow("src", src)
    cv2.imshow("result", result)
    cv2.waitKey(0)
    cv2.destroyAllWindows()

test18()
效果如下:
图像旋转
图像旋转主要调用getRotationMatrix2D()函数和warpAffine()函数实现,绕图像的中心旋转,具体如下:
M = cv2.getRotationMatrix2D((cols/2, rows/2), 30, 1)
参数分别为:旋转中心、旋转度数、scale
rotated = cv2.warpAffine(src, M, (cols, rows))
参数分别为:原始图像、旋转参数、原始图像宽高
代码如下:
import cv2
def test19():
    src= cv2.imread("rose.jpg")
    rows, cols, channel = src.shape
    # 绕中心旋转
    # 参数:旋转中心,旋转度数,scale
    M = cv2.getRotationMatrix2D((cols/2, rows/2), 30, 1)
    # 参数: 原始图像,旋转参数, 元素图像高度
    rotated = cv2.warpAffine(src, M, (cols, rows))
    # 显示旋转后的图像
    cv2.imshow("demo1", rotated)
    cv2.waitKey(0)
    cv2.destroyAllWindows()

test19()
效果如下:

备注: 参数中的旋转度数设置为正数时表示逆时针旋转,为负数时表示顺时针旋转
图像翻转
图像翻转在OpenCV中调用函数flip()实现,原型如下:
dst = cv2.flip(src, flipCode)
其中src表示原始图像,flipCode表示翻转方向,如果flipCode为0,则以X轴为对称轴翻转,如果fliipCode>0则以Y轴为对称轴翻转,如果flipCode<0则在X轴、Y轴方向同时翻转。
代码如下:
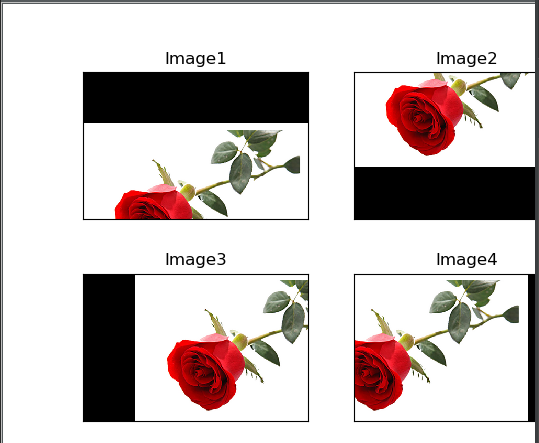
import cv2
import matplotlib.pyplot as plt

def test20():
    # 读取图片
    img = cv2.imread('rose.jpg')
    src = cv2.cvtColor(img, cv2.COLOR_BGR2RGB)

    # 图像翻转
    # 0以X轴为对称轴翻转 >0以Y轴为对称轴翻转 <0 X轴Y轴翻转
    img1 = cv2.flip(src, 0)
    img2 = cv2.flip(src, 1)
    img3 = cv2.flip(src, -1)

    # 显示图形
    titles = ['Source', 'Image1', 'Image2', 'Image3']
    images = [src, img1, img2, img3]
    for i in range(4):
        plt.subplot(2, 2, i + 1), plt.imshow(images[i], 'gray')
        plt.title(titles[i])
        plt.xticks([]), plt.yticks([])
    plt.show()
效果如下:

图像平移
图像平移首先定义平移矩阵M,再调用warpAffine()函数实现平移,核心函数如下:
M = np.float32([[1, 0, x], [0, 1, y]]) 其中(x,y)即为要偏移的x值,y值
shifted = cv2.warpAffine(image, M, (image.shape[1], image.shape[0]))
代码如下:
import cv2
import numpy as np
import matplotlib.pyplot as plt
def test21():

    # 读取图片
    img = cv2.imread('rose.jpg')
    image = cv2.cvtColor(img, cv2.COLOR_BGR2RGB)

    # 图像平移 下、上、右、左平移
    M = np.float32([[1, 0, 0], [0, 1, 100]])
    img1 = cv2.warpAffine(image, M, (image.shape[1], image.shape[0]))

    M = np.float32([[1, 0, 0], [0, 1, -100]])
    img2 = cv2.warpAffine(image, M, (image.shape[1], image.shape[0]))

    M = np.float32([[1, 0, 100], [0, 1, 0]])
    img3 = cv2.warpAffine(image, M, (image.shape[1], image.shape[0]))

    M = np.float32([[1, 0, -100], [0, 1, 0]])
    img4 = cv2.warpAffine(image, M, (image.shape[1], image.shape[0]))

    # 显示图形
    titles = ['Image1', 'Image2', 'Image3', 'Image4']
    images = [img1, img2, img3, img4]
    for i in range(4):
        plt.subplot(2, 2, i + 1), plt.imshow(images[i], 'gray')
        plt.title(titles[i])
        plt.xticks([]), plt.yticks([])
    plt.show()

test21()
效果如下:
转自:https://blog.csdn.net/Eastmount/article/details/82454335