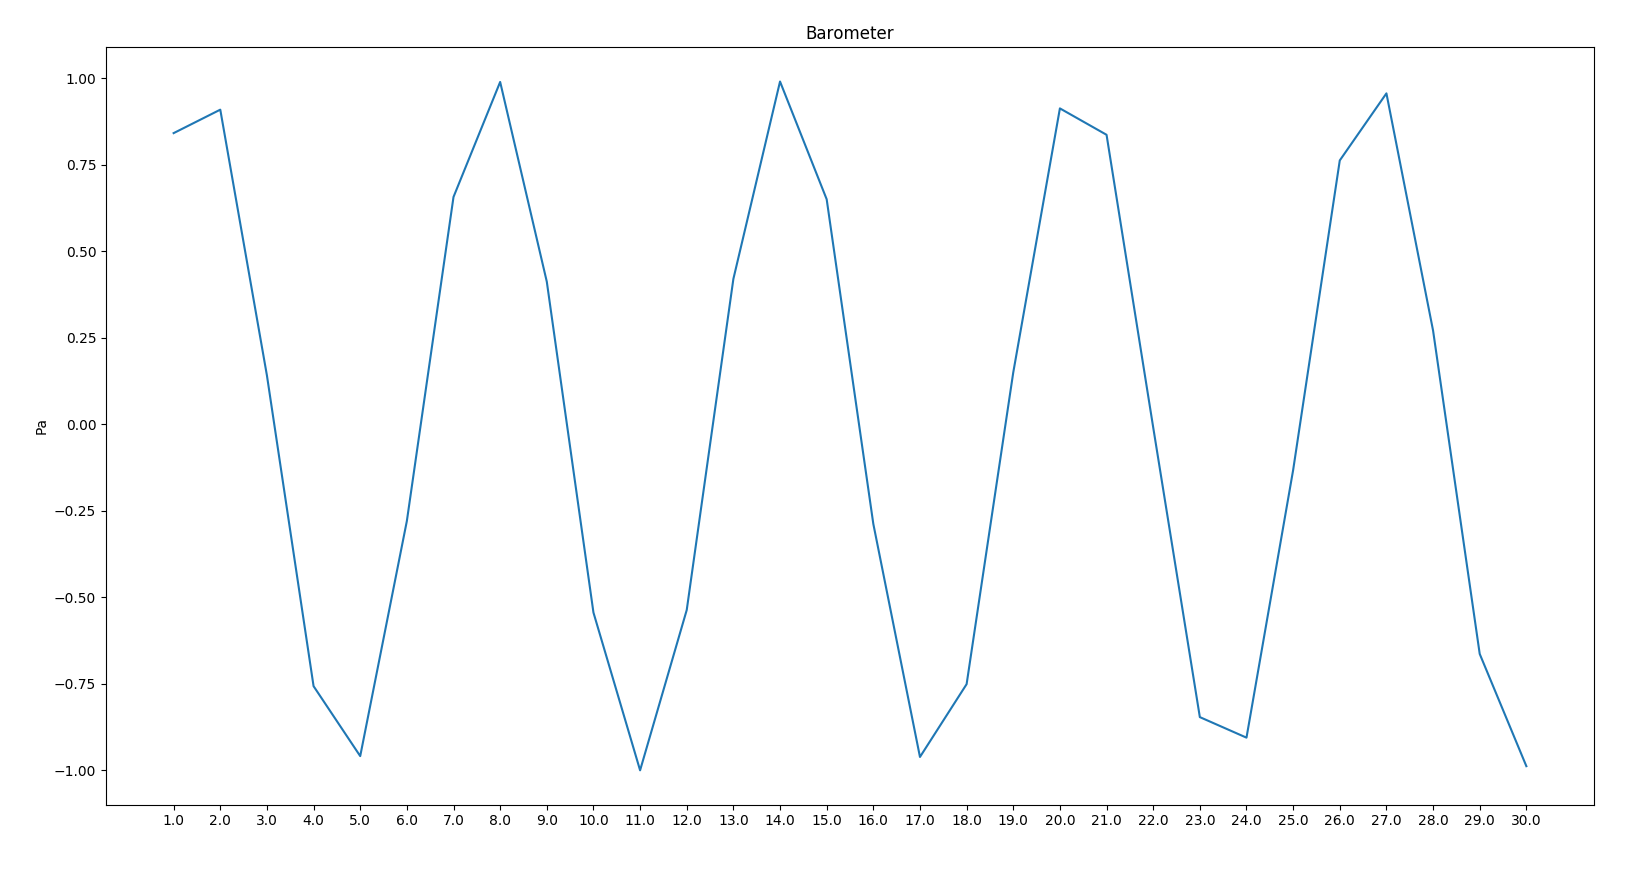
 1 #!/usr/bin/env python
 2 # -*- coding:utf-8 -*-
 3 # __author__ = "blzhu"
 4 """
 5 python study
 6 Date:2017
 7 """
 8 # coding=utf-8
 9 #######################################################
10 # filename:xlrd_draw.py
11 # author:
12 # date:xxxx-xx-xx
13 # function:读excel文件中的数据
14 #######################################################
15 import numpy as np
16 import matplotlib.pyplot as plt
17 import xlrd
18
19 # 打开一个workbook
20 workbook = xlrd.open_workbook(r'E:pythonpycharmwork	estmatplotlibzblBarometer.xlsx')
21
22 # 抓取所有sheet页的名称
23 worksheets = workbook.sheet_names()
24 print('worksheets is %s' % worksheets)
25
26 # 定位到mySheet
27 mySheet = workbook.sheet_by_name(u'Pressure')
28
29 # get datas
30 pressure = mySheet.col_values(0)
31 print(pressure)
32 time = mySheet.col(1)
33 print('time1',time)
34 time = [x.value for x in time]
35 print('time2',time)
36
37
38 # drop the 1st line of the data, which is the name of the data.
39 pressure.pop(0)
40 time.pop(0)
41
42 # declare a figure object to plot
43 fig = plt.figure(1)
44
45 # plot pressure
46 plt.plot(time,pressure)
47
48 plt.title('Barometer')
49 plt.ylabel('Pa')
50 plt.xticks(range(len(time)),time)
51 plt.show()

参考:http://blog.csdn.net/huhuang/article/details/53809891
学习python好去处:http://i.youku.com/pythontutorial