基本步骤类似于
步骤1准备画布
准备画布 <canvas></canvas>标签就是画布
canvas画布有默认大小 默认350X150
设置canvas画布大小
通常canvas是一个标签,可以在style canvas{xxxpx; height:xxpx} 但是不建议这样写 不建议在样式设置尺寸
我们可以在元素本身来设置
<canvas width="600" height="400"></canvas>
解释:不在样式表中设置canvas画布大小的原因
在css中设置canvas尺寸
    canvas{
      border:1px solid black;
      width: 600px;
      height: 400px;
    }
同样类似下面在(100,100)的位置绘制一条直线
此时可以发现 原来300X150的框拉伸到600X400,同样原来100X100的点距离左边和上边同比例放大了。就好比于拉伸了图片,点的相对比例没变,而实际位置改变。
所以在css样式中我们设置canvas的样式,而不是canvas的大小
步骤2准备绘制工具,利用工具绘图
<!DOCTYPE html>
<html lang="en">
<head>
  <meta charset="UTF-8">
  <meta name="viewport" content="width=device-width, initial-scale=1.0">
  <meta http-equiv="X-UA-Compatible" content="ie=edge">
  <title>Document</title>
  <style>
    canvas{
      border:1px solid black;
      /* 不建议在样式设置画布canvas尺寸 */
    }
  </style>
</head>
<body>
  <!-- 设置画布大小 width="600" height="400" -->
  <canvas width="600" height="300"></canvas>
  <script>
    // 1.获取元素
    var myCanvas=document.querySelector('canvas');
    // 2.获取上下文 绘制‘工具箱’(工具箱是比喻可以使用很多方法的意思)
    var ctx=myCanvas.getContext('2d');
    // 3.移动画笔 到定位点 左和上100px,
    ctx.moveTo(100,100)
    // 4.绘制直线(轨迹,绘制路径) 在x方向绘制100px直线,此时只是绘制路径,页面还未真正显示
    ctx.lineTo(200,100)
    // 5.描边
    ctx.stroke();
  </script>
</body>
</html>
温馨提示:现在canvas getContext('2d'); 只能绘制平面图,需要绘制3d图需要使用另外技术 web gl;
绘制出来的线模糊原因 canva的线默认1px 黑色,对齐的点是线中心的位置,而1px不是分布在整个1px,而是相邻两个1px像素各有0.5px的线条,显示不饱和,由于浏览器无法解析最小0.5px,所以模糊。
解决方法可以加0.5px 例如ctx.moveTo(100,100.5),实际中可以不处理,因为模糊效果不是很明显,更多的是用canvas绘制图片
例子:绘制不同样式的线条
使用ctx.begainPath()开启新路径
要绘制不同样式(颜色,宽度等)线条,可以使用ctx.begainPath() 开启新路径
<body>
<canvas width="600" height="400"></canvas>
<script>
    var myCanvas = document.querySelector('canvas');
    var ctx = myCanvas.getContext('2d');

    /*画平行线*/
    ctx.beginPath();/*Kai*/
    /*蓝色  10px*/
    ctx.moveTo(100,100);
    ctx.lineTo(300,100);
    ctx.strokeStyle = 'blue';
    ctx.lineWidth = 10;
    /*描边*/
    ctx.stroke();


    /*红色 20px*/
    ctx.moveTo(100,200);
    ctx.lineTo(300,200);
    ctx.strokeStyle = 'red';
    ctx.lineWidth = 20;
    /*描边*/
    ctx.stroke();


    /*绿色 30px*/
    ctx.moveTo(100,300);
    ctx.lineTo(300,300);
    ctx.strokeStyle = 'green';
    ctx.lineWidth = 30;
    /*描边*/
    ctx.stroke();


</script>
</body>
</html>
例子:绘制填充颜色三角形
绘制三条线,围成三角形,使用fil填充 填充默认的颜色也是黑色
注意:缺角问题,原因起始点和lineTo的结束点无法完全闭合缺角
    /*解决方法使用canvas的自动闭合 */
    /*关闭路径*/
    ctx.closePath();
<body>
<canvas width="600" height="400"></canvas>
<script>
    var myCanvas = document.querySelector('canvas');
    var ctx = myCanvas.getContext('2d');

    /*1.绘制一个三角形*/
    ctx.moveTo(100,100);
    ctx.lineTo(200,100);
    ctx.lineTo(200,200);
    /*起始点和lineTo的结束点无法完全闭合缺角*/
    /*解决方法使用canvas的自动闭合 */
    //ctx.lineTo(100,100);
    /*关闭路径*/
    ctx.closePath();

    ctx.lineWidth = 10;
    /*2.描边*/
    ctx.stroke();
    /*3.填充*/
    //ctx.fill();

</script>
</body>
</html>
例子:镂空图形
<!DOCTYPE html>
<html lang="en">
<head>
    <meta charset="UTF-8">
    <title>Title</title>
    <style>
        canvas {
            border: 1px solid #ccc;
        }
    </style>
</head>
<body>
<canvas width="600" height="400"></canvas>
<script>
    var myCanvas = document.querySelector('canvas');
    var ctx = myCanvas.getContext('2d');

    /*1.绘制两个正方形 一大200一小100 套在一起*/
    ctx.moveTo(100,100);
    ctx.lineTo(300,100);
    ctx.lineTo(300,300);
    ctx.lineTo(100,300);
    ctx.closePath();

    ctx.moveTo(150,150);
    ctx.lineTo(150,250);
    ctx.lineTo(250,250);
    ctx.lineTo(250,150);
    ctx.closePath();

    /*2.去填充*/
    //ctx.stroke();
    ctx.fillStyle = 'red';
    ctx.fill();

    /*在填充的时候回遵循非零环绕规则*/
</script>
</body>
</html>
非零填充规则
1.看一块区域是否填充
2.从这个区域拉一条线
3.看和这条线相交的轨迹
4.如果都是顺时针+1
5.如果逆时针-1
6.所有的轨迹值计算出来
7.如果是非0那么填充
8.如果是0则不填充
例子:绘制折线图
<!DOCTYPE html>
<html lang="en">
<head>
    <meta charset="UTF-8">
    <title>Title</title>
    <style>
        canvas {
            border: 1px solid #ccc;
        }
    </style>
</head>
<body>
<canvas width="600" height="400"></canvas>
<script>
    /*1.构造函数*/
    var LineChart = function (ctx) {
        /*获取绘图工具*/
        this.ctx = ctx || document.querySelector('canvas').getContext('2d');
        /*画布的大小*/
        this.canvasWidth = this.ctx.canvas.width;
        this.canvasHeight = this.ctx.canvas.height;
        /*网格的大小*/
        this.gridSize = 10;
        /*坐标系的间距*/
        this.space = 20;
        /*坐标原点*/
        this.x0 = this.space;
        this.y0 = this.canvasHeight - this.space;
        /*箭头的大小*/
        this.arrowSize = 10;
        /*绘制点*/
        this.dottedSize = 6;
        /*点的坐标 和数据有关系  数据可视化*/
    }
    /*2.行为方法*/
    LineChart.prototype.init = function (data) {
        this.drawGrid();
        this.drawAxis();
        this.drawDotted(data);
    };
    /*绘制网格*/
    LineChart.prototype.drawGrid = function () {
        /*x方向的线*/
        var xLineTotal = Math.floor(this.canvasHeight / this.gridSize);
        this.ctx.strokeStyle = '#eee';
        for (var i = 0; i <= xLineTotal; i++) {
            this.ctx.beginPath();
            this.ctx.moveTo(0, i * this.gridSize - 0.5);
            this.ctx.lineTo(this.canvasWidth, i * this.gridSize - 0.5);
            this.ctx.stroke();
        }
        /*y方向的线*/
        var yLineTotal = Math.floor(this.canvasWidth / this.gridSize);
        for (var i = 0; i <= yLineTotal; i++) {
            this.ctx.beginPath();
            this.ctx.moveTo(i * this.gridSize - 0.5, 0);
            this.ctx.lineTo(i * this.gridSize - 0.5, this.canvasHeight);
            this.ctx.stroke();
        }
    };
    /*绘制坐标系*/
    LineChart.prototype.drawAxis = function () {
        /*X轴*/
        this.ctx.beginPath();
        this.ctx.strokeStyle = '#000';
        this.ctx.moveTo(this.x0, this.y0);
        this.ctx.lineTo(this.canvasWidth - this.space, this.y0);
        this.ctx.lineTo(this.canvasWidth - this.space - this.arrowSize, this.y0 + this.arrowSize / 2);
        this.ctx.lineTo(this.canvasWidth - this.space - this.arrowSize, this.y0 - this.arrowSize / 2);
        this.ctx.lineTo(this.canvasWidth - this.space, this.y0);
        this.ctx.stroke();
        this.ctx.fill();
        /*Y轴*/
        this.ctx.beginPath();
        this.ctx.strokeStyle = '#000';
        this.ctx.moveTo(this.x0, this.y0);
        this.ctx.lineTo(this.space, this.space);
        this.ctx.lineTo(this.space + this.arrowSize / 2, this.space + this.arrowSize);
        this.ctx.lineTo(this.space - this.arrowSize / 2, this.space + this.arrowSize);
        this.ctx.lineTo(this.space, this.space);
        this.ctx.stroke();
        this.ctx.fill();
    };
    /*绘制所有点*/
    LineChart.prototype.drawDotted = function (data) {
        /*1.数据的坐标 需要转换 canvas坐标*/
        /*2.再进行点的绘制*/
        /*3.把线连起来*/
        var that = this;
        /*记录当前坐标*/
        var prevCanvasX = 0;
        var prevCanvasY = 0;
        data.forEach(function (item, i) {
            /* x = 原点的坐标 + 数据的坐标 */
            /* y = 原点的坐标 - 数据的坐标 */
            var canvasX = that.x0 + item.x;
            var canvasY = that.y0 - item.y;
            /*绘制点*/
            that.ctx.beginPath();
            that.ctx.moveTo(canvasX - that.dottedSize / 2, canvasY - that.dottedSize / 2);
            that.ctx.lineTo(canvasX + that.dottedSize / 2, canvasY - that.dottedSize / 2);
            that.ctx.lineTo(canvasX + that.dottedSize / 2, canvasY + that.dottedSize / 2);
            that.ctx.lineTo(canvasX - that.dottedSize / 2, canvasY + that.dottedSize / 2);
            that.ctx.closePath();
            that.ctx.fill();
            /*点的连线*/
            /*当时第一个点的时候 起点是 x0 y0*/
            /*当时不是第一个点的时候 起点是 上一个点*/
            if(i == 0){
                that.ctx.beginPath();
                that.ctx.moveTo(that.x0,that.y0);
                that.ctx.lineTo(canvasX,canvasY);
                that.ctx.stroke();
            }else{
                /*上一个点*/
                that.ctx.beginPath();
                that.ctx.moveTo(prevCanvasX,prevCanvasY);
                that.ctx.lineTo(canvasX,canvasY);
                that.ctx.stroke();
            }
            /*记录当前的坐标,下一次要用*/
            prevCanvasX = canvasX;
            prevCanvasY = canvasY;
        });
    };
    /*3.初始化*/
    var data = [
        {
            x: 100,
            y: 120
        },
        {
            x: 200,
            y: 160
        },
        {
            x: 300,
            y: 240
        },
        {
            x: 400,
            y: 120
        },
        {
            x: 500,
            y: 80
        }
    ];
    var lineChart = new LineChart();
    lineChart.init(data);
</script>
</body>
</html>
例子:绘制渐变矩形
<!DOCTYPE html>
<html lang="en">
<head>
    <meta charset="UTF-8">
    <title>Title</title>
    <style>
        canvas {
            border: 1px solid #ccc;
        }
/*        .linearGradient{
             400px;
            height: 100px;
            background-image: linear-gradient(to right,pink,blue);
        }*/
    </style>
</head>
<body>
<div class="linearGradient"></div>
<canvas width="600" height="400"></canvas>
<script>
    var myCanvas = document.querySelector('canvas');
    var ctx = myCanvas.getContext('2d');

    /*fillStyle 'pink' '#000' 'rgb()' 'rgba()' */
    /*也可以使用一个渐变的方案了填充矩形*/
    /*创建一个渐变的方案*/
    /*渐变是由长度的*/
    /*x0y0 起始点 x1y1 结束点  确定长度和方向*/
    var linearGradient = ctx.createLinearGradient(100,100,500,400);
    linearGradient.addColorStop(0,'pink');
    //linearGradient.addColorStop(0.5,'red');
    linearGradient.addColorStop(1,'blue');

    ctx.fillStyle = linearGradient;

    ctx.fillRect(100,100,400,100);

    /*pink---->blue*/
    /*回想线性渐变---->要素 方向  起始颜色 结束颜色 */
    /*通过两个点的坐标可以控制 渐变方向*/
</script>
</body>
</html>
例子:绘制饼状图
<!DOCTYPE html>
<html lang="en">
<head>
    <meta charset="UTF-8">
    <title>Title</title>
    <style>
        canvas {
            border: 1px solid #ccc;
            display: block;
            margin: 100px auto;
        }
    </style>
</head>
<body>
<canvas width="600" height="400"></canvas>
<script>
    /*var myCanvas = document.querySelector('canvas');
    var ctx = myCanvas.getContext('2d');*/

    /*1.绘制饼状态图*/
    /*1.1 根据数据绘制一个饼图*/
    /*1.2 绘制标题 从扇形的弧中心伸出一条线在画一条横线在横线的上面写上文字标题*/
    /*1.3 在画布的左上角 绘制说明 一个和扇形一样颜色的矩形 旁边就是文字说明*/

    var PieChart = function (ctx) {
        /*绘制工具*/
        this.ctx = ctx || document.querySelector('canvas').getContext('2d');
        /*绘制饼图的中心*/
        this.w = this.ctx.canvas.width;
        this.h = this.ctx.canvas.height;
        /*圆心*/
        this.x0 = this.w / 2 + 60;
        this.y0 = this.h / 2;
        /*半径*/
        this.radius = 150;
        /*伸出去的线的长度*/
        this.outLine = 20;
        /*说明的矩形大小*/
        this.rectW = 30;
        this.rectH = 16;
        this.space = 20;
    }
    PieChart.prototype.init = function (data) {
        /*1.准备数据*/
        this.drawPie(data);
    };
    PieChart.prototype.drawPie = function (data) {
        var that = this;
        /*1.转化弧度*/
        var angleList = this.transformAngle(data);
        /*2.绘制饼图*/
        var startAngle = 0;
        angleList.forEach(function (item, i) {
            /*当前的结束弧度要等于下一次的起始弧度*/
            var endAngle = startAngle + item.angle;
            that.ctx.beginPath();
            that.ctx.moveTo(that.x0, that.y0);
            that.ctx.arc(that.x0, that.y0, that.radius, startAngle, endAngle);
            var color = that.ctx.fillStyle = that.getRandomColor();
            that.ctx.fill();
            /*下一次要使用当前的这一次的结束角度*/
            /*绘制标题*/
            that.drawTitle(startAngle, item.angle, color , item.title);
            /*绘制说明*/
            that.drawDesc(i,item.title);
            startAngle = endAngle;
        });
    };
    PieChart.prototype.drawTitle = function (startAngle, angle ,color , title) {
        /*1.确定伸出去的线 通过圆心点 通过伸出去的点  确定这个线*/
        /*2.确定伸出去的点 需要确定伸出去的线的长度*/
        /*3.固定伸出去的线的长度*/
        /*4.计算这个点的坐标*/
        /*5.需要根据角度和斜边的长度*/
        /*5.1 使用弧度  当前扇形的起始弧度 + 对应的弧度的一半 */
        /*5.2 半径+伸出去的长度 */
        /*5.3 outX = x0 + cos(angle) * ( r + outLine)*/
        /*5.3 outY = y0 + sin(angle) * ( r + outLine)*/
        /*斜边*/
        var edge = this.radius + this.outLine;
        /*x轴方向的直角边*/
        var edgeX = Math.cos(startAngle + angle / 2) * edge;
        /*y轴方向的直角边*/
        var edgeY = Math.sin(startAngle + angle / 2) * edge;
        /*计算出去的点坐标*/
        var outX = this.x0 + edgeX;
        var outY = this.y0 + edgeY;
        this.ctx.beginPath();
        this.ctx.moveTo(this.x0, this.y0);
        this.ctx.lineTo(outX, outY);
        this.ctx.strokeStyle = color;
        /*画文字和下划线*/
        /*线的方向怎么判断 伸出去的点在X0的左边 线的方向就是左边*/
        /*线的方向怎么判断 伸出去的点在X0的右边 线的方向就是右边*/
        /*结束的点坐标  和文字大小*/
        this.ctx.font = '14px Microsoft YaHei';
        var textWidth = this.ctx.measureText(title).width ;
        if(outX > this.x0){
            /*右*/
            this.ctx.lineTo(outX + textWidth,outY);
            this.ctx.textAlign = 'left';
        }else{
            /*左*/
            this.ctx.lineTo(outX - textWidth,outY);
            this.ctx.textAlign = 'right';
        }
        this.ctx.stroke();
        this.ctx.textBaseline = 'bottom';
        this.ctx.fillText(title,outX,outY);

    };
    PieChart.prototype.drawDesc = function (index,title) {
        /*绘制说明*/
        /*矩形的大小*/
        /*距离上和左边的间距*/
        /*矩形之间的间距*/
        this.ctx.fillRect(this.space,this.space + index * (this.rectH + 10),this.rectW,this.rectH);
        /*绘制文字*/
        this.ctx.beginPath();
        this.ctx.textAlign = 'left';
        this.ctx.textBaseline = 'top';
        this.ctx.font = '12px Microsoft YaHei';
        this.ctx.fillText(title,this.space + this.rectW + 10 , this.space + index * (this.rectH + 10));
    };
    PieChart.prototype.transformAngle = function (data) {
        /*返回的数据内容包含弧度的*/
        var total = 0;
        data.forEach(function (item, i) {
            total += item.num;
        });
        /*计算弧度 并且追加到当前的对象内容*/
        data.forEach(function (item, i) {
            var angle = item.num / total * Math.PI * 2;
            item.angle = angle;
        });
        return data;
    };
    PieChart.prototype.getRandomColor = function () {
        var r = Math.floor(Math.random() * 256);
        var g = Math.floor(Math.random() * 256);
        var b = Math.floor(Math.random() * 256);
        return 'rgb(' + r + ',' + g + ',' + b + ')';
    };

    var data = [
        {
            title: '15-20岁',
            num: 6
        },
        {
            title: '20-25岁',
            num: 30
        },
        {
            title: '25-30岁',
            num: 10
        },
        {
            title: '30以上',
            num: 8
        }
    ];

    var pieChart = new PieChart();
    pieChart.init(data);

</script>
</body>
</html>
例子:绘制图片
<!DOCTYPE html>
<html lang="en">
<head>
    <meta charset="UTF-8">
    <title>Title</title>
    <style>
        canvas {
            border: 1px solid #ccc;
        }
    </style>
</head>
<body>
<!--<img src="image/01.jpg" alt="">-->
<canvas width="600" height="400"></canvas>
<script>
    var myCanvas = document.querySelector('canvas');
    var ctx = myCanvas.getContext('2d');

    /*1.加载图片到内存即可*/
    /*var img = document.createElement('img');
    img.src = 'image/01.jpg';*/
    /*创建对象*/
    var image = new Image();
    /*绑定加载完成事件*/
    image.onload = function () {
        /*实现图片绘制*/
        console.log(image);
        /*绘制图片的三种方式*/

        /*3参数*/
        /*图片对象*/
        /*绘制在画布上的坐标 x y*/
        //ctx.drawImage(image,100,100);


        /*5个参数*/
        /*图片对象*/
        /*绘制在画布上的坐标 x y*/
        /*是图片的大小  不是裁剪  是缩放*/
        //ctx.drawImage(image,100,100,100,100);


        /*9个参数*/
        /*图片对象*/
        /*图片上定位的坐标  x y */
        /*在图片上截取多大的区域  w h*/
        /*绘制在画布上的坐标 x y*/
        /*是图片的大小  不是裁剪  是缩放*/
        ctx.drawImage(image,400,400,400,400,200,200,100,100);

    };
    /*设置图片路径*/
    image.src = 'image/02.jpg';


</script>
</body>
</html>
例子:绘制帧动画图片
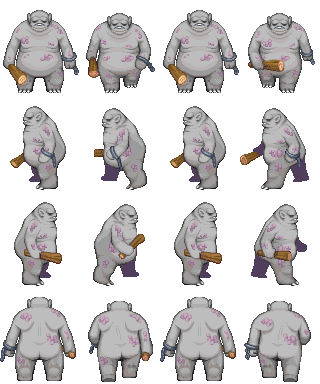
<!DOCTYPE html>
<html lang="en">
<head>
    <meta charset="UTF-8">
    <title>Title</title>
    <style>
        canvas {
            border: 1px solid #ccc;
        }
    </style>
</head>
<body>
<!--<img src="image/01.jpg" alt="">-->
<canvas width="600" height="400"></canvas>
<script>
    var myCanvas = document.querySelector('canvas');
    var ctx = myCanvas.getContext('2d');

    var image = new Image();
    image.onload = function () {
        /*图片加载完成*/
        /*动态的去获取当前图片的尺寸*/
        var imageWidth = image.width;
        var imageHeight = image.height;
        /*计算出每一个小人物的尺寸*/
        var personWidth = imageWidth/4;
        var personHeight = imageHeight/4;
        /*位截取图片*/
        /*帧动画  在固定的时间间隔更换显示的图片  根据图片的索引*/
        var index = 0;

        /*绘制在画布的中心*/
        /*图片绘制的起始点*/
        var x0 = ctx.canvas.width /2 - personWidth / 2;
        var y0 = ctx.canvas.height /2 - personHeight / 2;

        ctx.drawImage(image,0,0,personWidth,personHeight,x0,y0,personWidth,personHeight);
        setInterval(function () {
            index ++;
            ctx.clearRect(0,0,ctx.canvas.width,ctx.canvas.height);
            ctx.drawImage(image,index * personWidth,0,personWidth,personHeight,x0,y0,personWidth,personHeight);
            if(index >= 3){
                index = 0;
            }
        },1000);

    };
    image.src = 'image/04.png';


</script>
</body>
</html>
例子:绘制行走的人
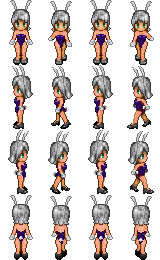
<!DOCTYPE html>
<html lang="en">
<head>
    <meta charset="UTF-8">
    <title>Title</title>
    <style>
        canvas {
            border: 1px solid #ccc;
        }
    </style>
</head>
<body>
<canvas width="600" height="400"></canvas>
<script>

    var Person = function (ctx) {
        /*绘制工具*/
        this.ctx = ctx || document.querySelector('canvas').getContext('2d');
        /*图片路径*/
        this.src = 'image/03.png';
        /*画布的大小*/
        this.canvasWidth = this.ctx.canvas.width;
        this.canvasHeight = this.ctx.canvas.height;

        /*行走相关参数*/
        this.stepSzie = 10;
        /* 0 前  1 左  2 右  3 后  和图片的行数包含的图片对应上*/
        this.direction = 0;
        /*x轴方向的偏移步数*/
        this.stepX = 0;
        /*y轴方向的偏移步数*/
        this.stepY = 0;

        /*初始化方法*/
        this.init();
    };

    Person.prototype.init = function () {
        var that = this;
        /*1.加载图片*/
        this.loadImage(function (image) {
            /*图片的大小*/
            that.imageWidth = image.width;
            that.imageHeight = image.height;
            /*人物的大小*/
            that.personWidth = that.imageWidth / 4;
            that.personHeight = that.imageHeight / 4;
            /*绘制图片的起点*/
            that.x0 = that.canvasWidth / 2 - that.personWidth / 2;
            that.y0 = that.canvasHeight / 2 - that.personHeight / 2;
            /*2.默认绘制在中心位置正面朝外*/
            that.ctx.drawImage(image,
                0,0,
                that.personWidth,that.personHeight,
                that.x0,that.y0,
                that.personWidth,that.personHeight);

            /*3.能通过方向键去控制人物行走*/
            that.index = 0;
            document.onkeydown = function (e) {
                if(e.keyCode == 40){
                    that.direction = 0;
                    that.stepY ++;
                    that.drawImage(image);
                    /*前*/
                }else if(e.keyCode == 37){
                    that.direction = 1;
                    that.stepX --;
                    that.drawImage(image);
                    /*左*/
                }else if(e.keyCode == 39){
                    that.direction = 2;
                    that.stepX ++;
                    that.drawImage(image);
                    /*右*/
                }else if(e.keyCode == 38){
                    that.direction = 3;
                    that.stepY --;
                    that.drawImage(image);
                    /*后*/
                }
            }
        });
    }
    /*加载图片*/
    Person.prototype.loadImage = function (callback) {
        var image = new Image();
        image.onload = function () {
            callback && callback(image);
        };
        image.src = this.src;
    };
    /*绘制图片*/
    Person.prototype.drawImage = function (image) {
        this.index ++;
        /*清除画布*/
        this.ctx.clearRect(0,0,this.canvasWidth,this.canvasHeight);
        /*绘图*/
        /*在精灵图上的定位 x  索引*/
        /*在精灵图上的定位 y  方向*/
        this.ctx.drawImage(image,
            this.index * this.personWidth,this.direction * this.personHeight,
            this.personWidth,this.personHeight,
            this.x0 + this.stepX * this.stepSzie ,this.y0 + this.stepY * this.stepSzie,
            this.personWidth,this.personHeight);
        /*如果索引超出了 变成0*/
        if(this.index >= 3){
            this.index = 0;
        }
    };


    new Person();

</script>
</body>
</html>