一、安装过程
1、下载、解压、软连接(下载特别慢)
# tar xf prometheus-2.16.0.linux-amd64.tar.gz -C /usr/local/ # tar -xvf prometheus-2.16.0.linux-amd64.tar.gz -C /usr/local/ # mv /usr/local/prometheus-2.16.0.linux-amd64/ /usr/local/prometheus [root@localhost prometheus]# pwd
/usr/local/prometheus
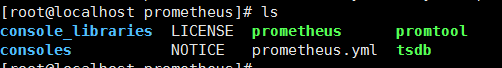
[root@localhost prometheus]# ls
console_libraries LICENSE prometheus promtool
consoles NOTICE prometheus.yml tsdb
#./prometheus --version prometheus, version 2.16.0 (branch: HEAD, revision: b90be6f32a33c03163d700e1452b54454ddce0ec) build user: root@7ea0ae865f12 build date: 20200213-23:50:02 go version: go1.13.8 (此处go语言环境,没提前准备) #./prometheus & 也可以启动
查看版本信息
# /usr/local/prometheus/prometheus --version
prometheus, version 2.16.0 (branch: HEAD, revision: b90be6f32a33c03163d700e1452b54454ddce0ec)
  build user:       root@7ea0ae865f12
  build date:       20200213-23:50:02
  go version:       go1.13.8
2、配置说明
# cat prometheus.yml
# 全局配置
global:
  scrape_interval:     15s # 设置抓取间隔,默认为1分钟
  evaluation_interval: 15s #估算规则的默认周期,每15秒计算一次规则。默认1分钟
  # scrape_timeout  #默认抓取超时,默认为10s

# Alertmanager相关配置
alerting:
  alertmanagers:
  - static_configs:
    - targets:
      # - alertmanager:9093

# 规则文件列表,使用'evaluation_interval' 参数去抓取
rule_files:
  # - "first_rules.yml"
  # - "second_rules.yml"

#  抓取配置列表
scrape_configs:
  - job_name: 'prometheus'
    static_configs:
    - targets: ['localhost:9090']
二、加入systemd管理
# vi /etc/systemd/system/prometheus.service
 [Unit]
Description=Prometheus Monitoring System
Documentation=Prometheus Monitoring System

[Service]
ExecStart=/usr/local/prometheus/prometheus
  --config.file=/usr/local/prometheus/prometheus.yml
  --web.listen-address=:9090

[Install]
WantedBy=multi-user.target

# systemctl daemon-reload
#systemctl enable prometheus
#systemctl start prometheus
三、grafana的安装
1、下载
# yum install -y grafana-6.6.2-1.x86_64.rpm (rpm包是提前下好的,yum解决两个依赖)
2、启动:
默认端口3000,用户名admin,密码admin
启动方式:
脚本启动
# service grafana-server start
Starting grafana-server (via systemctl):                   [  确定  ]
systemd 启动
#systemctl daemon-reload

#systemctl start grafana-server

#systemctl status grafana-server

#systemctl enable grafana-server.service
3、重要文件目录:
二进制文件: /usr/sbin/grafana-server
init.d 脚本: /etc/init.d/grafana-server
环境变量文件: /etc/sysconfig/grafana-server
配置文件: /etc/grafana/grafana.ini
启动项: /sys/fs/cgroup/systemd/system.slice/grafana-server.service   、   /usr/lib/systemd/system/grafana-server.service
日志文件:/var/log/grafana/grafana.log
默认配置的sqlite3数据库:/var/lib/grafana/grafana.db
环境配置文件:
systemd 和 init.d 脚本启动都是加载的 /etc/sysconfig/grafana-server 文件。
可以在 /etc/sysconfig/grafana-server 文件中修改日志目录,数据目录和其他一些环境变量。
数据库:
默认配置指定的数据库 sqlite3 在 /var/lib/grafana/grafana.db 。升级之前记得备份。
也可以用 mysql 或者 postgres,详细配置参考:http://docs.grafana.org/installation/configuration/#database 或者后面的介绍的配置方法
配置文件:
配置文件存放在 /etc/grafana/grafana.ini ,详细的配置选项参考:http://docs.grafana.org/installation/configuration/
添加数据源:
Graphite
InfluxDB
OpenTSDB
Prometheus
服务器端图形渲染:
服务器端映像(png)呈现是一个可选的特性,但在共享可视化时非常有用,例如在警报通知中。
如果图像缺少文本,请确保已经安装了字体包
#yum install fontconfig
#yum install freetype*
#yum install urw-fonts
4、管理
配置:
grafana 后端有许多配置选项,可以在一个配置文件或环境变量中指定。
ini 配置文件以分号为注释 ;
默认配置文件路径:$WORKING_DIR/conf/defaults.ini
自定义配置文件:$WORKING/conf/custom.ini
自定义配置文件路径可以使用 --config 参数覆盖
注意:使用 rpm或者 deb 方式安装的,配置文件默认在 /etc/grafana/grafana.ini
这个路径是由 init.d 脚本 --config 参数指定的。
使用环境变量
下面列出的配置文件中的选项都可以被环境变量覆盖,语法:
    GF_<SectionName>_<KeyName>

    配置文件选项:
    # default section
    instance_name = ${HOSTNAME}

    [security]
    admin_user = admin

    [auth.google]
    client_secret = 0ldS3cretKey

    环境变量替换:
    export GF_DEFAULT_INSTANCE_NAME=my-instance
    export GF_SECURITY_ADMIN_USER=true
    export GF_AUTH_GOOGLE_CLIENT_SECRET=newS3cretKey
四、问题记录
解决:
#timedatectl set-timezone Asia/Shanghai
#ntpdate -u cn.pool.ntp.org
#systemctl restart prometheus.service
#reboot    重启系统(或电脑)

#yum -y install ntpdate ntp
#rm -rf /etc/localtime
#ln -s /usr/share/zoneinfo/Asia/Shanghai    /etc/localtime
#ntpdate us.pool.ntp.org (备用)
五、node_exporter的管理
node-exporter用于采集服务器层面的运行指标,包括机器的loadavg负载、filesystem文件系统、meminfo内存信息等基础监控,类似于传统主机监控维度的zabbix-agent
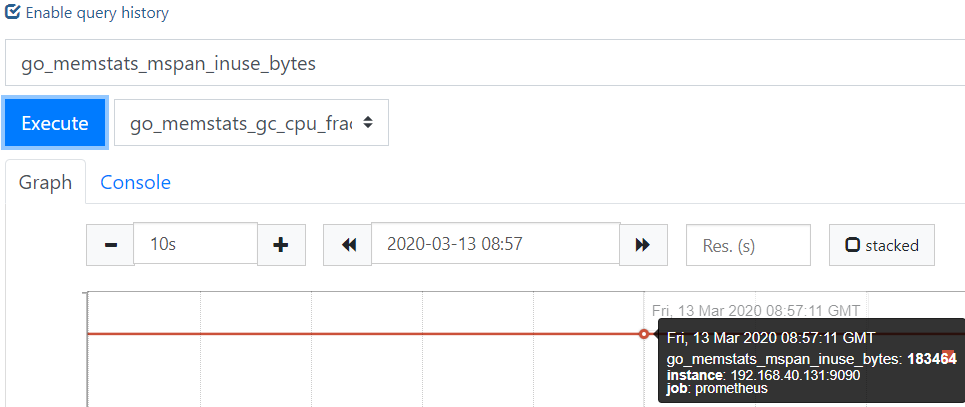
http://192.168.40.131:9100/metrics ( node_exporter的url显示)
https://www.mediaat.cn/news/show-4522.html (node_exporter怎么设置开机自启)
# nohup /root/node_exporter-0.18.1.linux-amd64/node_exporter & (nohup是不挂断,&后台运行,结合后就是永久在后台运行)
容器监控实践—node-exporter
https://www.jianshu.com/p/e3c9fc929d8a
六、mysqld_exporter
[root@mysql ~]# cat /root/.my.cnf
[client]
user=admin
password=QWer90-=
#mysql (实现了免密登录,,前提是mysql数据库中已经做过admin用户localhost本地登录授权)
Welcome to the MySQL monitor. Commands end with ; or g.
Your MySQL connection id is 11
Server version: 5.7.29 MySQL Community Server (GPL)
# pwd
/usr/local/mysqld_exporter
# nohup ./mysqld_exporter --config.my-cnf=/root/.my.cnf & (启动mysqld_exporter)
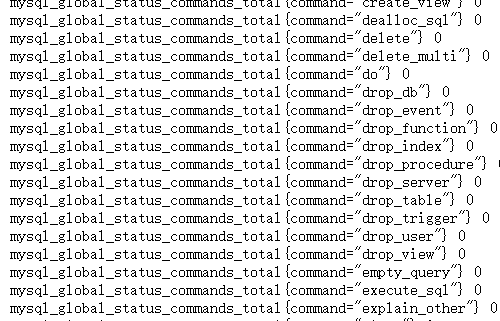
http://192.168.40.132:9104/metrics (查看数据是否收集过来,默认端口9104)
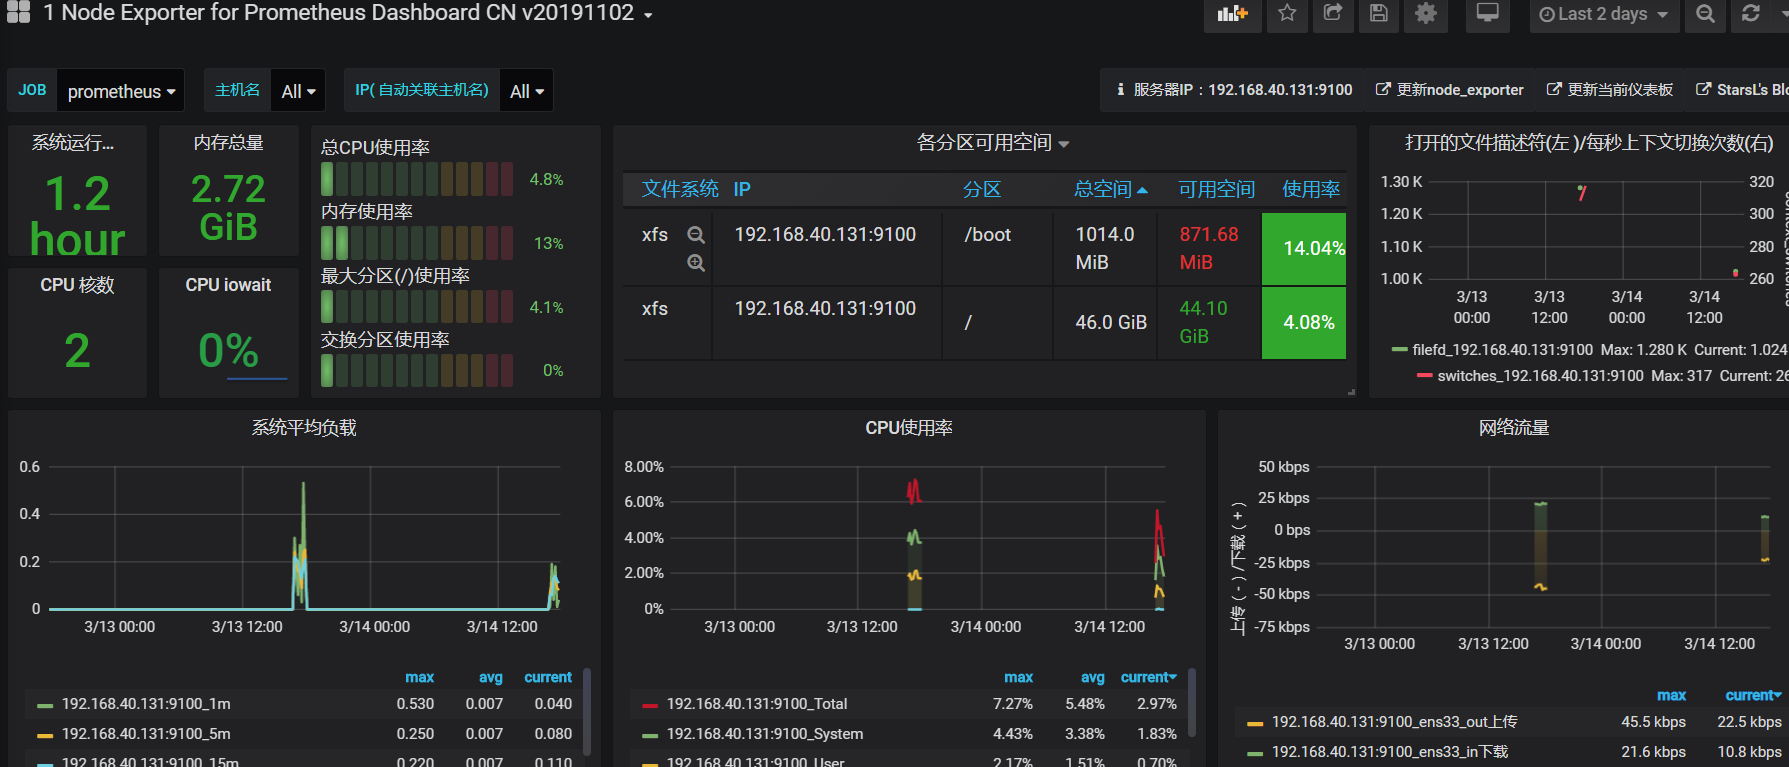
http://ip:3000(grafanan监控主机基本信息图)
官网下载地址:https://prometheus.io/download/#node_exporter
https://blog.51cto.com/msiyuetian/2369130 (docker版搭建)
https://blog.csdn.net/BianChengNinHao/article/details/80985302
https://www.jianshu.com/p/b2f1b58c8e7f Prometheus Operator 的安装