代码及数据:https://github.com/zle1992/MachineLearningInAction
logistic regression
优点:计算代价不高,易于理解实现,线性模型的一种。
缺点:容易欠拟合,分类精度不高。但是可以用于预测概率。
适用数据范围:数值型和标称型。
准备数据:
1 def loadDataSet():
2     dataMat,labelMat = [],[]
3     with open(filename,"r") as  fr:  #open file
4         for line in fr.readlines():
5             lineArr = line.split() #split each line
6             dataMat.append([1.0,float(lineArr[0]),float(lineArr[1])])  #创建2维list
7             labelMat.append(int(lineArr[2]))
8     return dataMat,labelMat
1 基于Logistic回归和Sigmoid函数的分类
Sigmoid函数:

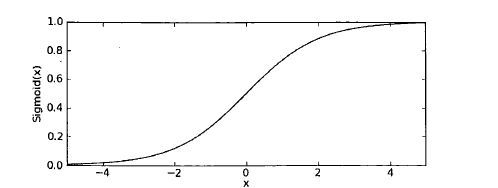

1 def sigmoid(inX):
2     return 1.0/(1+np.exp(-inX))
2基于最优化方法的最佳回归系数确定
梯度上升法:
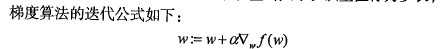
梯度上升法的伪代码如下:
每个回归系数初始化为1
重复R次:
计算整个数据集的梯度
使用alpha x gradient更新回归系数的向量
返回回归系数
代码:
 1 def sigmoid(inX):
 2     return 1.0/(1+np.exp(-inX))
 3
 4 def gradAscent(dataMat,labelMat):
 5     dataMatrix = np.mat(dataMat)  #translate list to matrix
 6     labelMatrix = np.mat(labelMat).transpose() #转置
 7     m,n = np.shape(dataMatrix) #100 rows  3 coulums
 8     alpha = 0.001 #步长 or 学习率
 9     maxCyclse = 500
10     weight = np.ones((n,1)) #初始值随机更好吧
11     #weight = np.random.rand(n,1)
12     for k in range(maxCyclse):
13         h = sigmoid(dataMatrix * weight) # h 是向量
14         error = (labelMatrix - h)  #error 向量
15         weight = weight + alpha * dataMatrix.transpose() *error  #更新
16      #   print(k,"  ",weight)
17     return weight
3分析数据:画出决策边界
 1 def plotfit(wei):
 2     import matplotlib.pyplot as plt
 3     weight = np.array(wei) #???????? #return array
 4     dataMat ,labelMat = loadDataSet()
 5     dataArr = np.array(dataMat)
 6     n = np.shape(dataArr)[0]  #row
 7     fig = plt.figure()   #plot
 8     ax = fig.add_subplot(111)
 9     ax.scatter(dataArr[:,1],dataArr[:,2],s =50, c = np.array(labelMat)+5) #散点图 #参考KNN 的画图
10     x = np.arange(-3.0,3.0,0.1)   #画拟合图像
11     y = (-weight[0] - weight[1] *x ) / weight[2]
12     ax.plot(x,y)
13     plt.xlabel("x1")
14     plt.ylabel("x2")
15     plt.show()
4训练算法:随机梯度上升
伪代码:
所有回归系数初始化为1
对数据集中每个样本
计算该样本的梯度
使用alpha x gradient更新回归系数值
返回回归系数值
原始梯度上升计算数据集的梯度,涉及的是矩阵运算。h,error都是向量
随机梯度算法计算的是数据集中每个样本的梯度,s计算量减小,h,error都是数值
1 ef stocGradAscent0(dataMatrix,labelMatrix):
2     m,n = np.shape(dataMatrix)
3     alpha = 0.1
4     weight = np.ones(n)
5     for i in range(m):
6         h = sigmoid(sum(dataMatrix * weight))
7         error = labelMatrix[i] - h
8         weight = weight + alpha * error * dataMatrix[i]
9     return weight
上面的算法是固定的步长,固定的步长,不稳定,会产生震荡,所以下面的算法采用不固定的步长。
距离目标值远的时候,步长大,距离目标值近的时候,步长小。
 1 def stocGradAscent1(dataMat,labelMat,numIter = 150):
 2     dataMatrix = np.mat(dataMat)  #translate list to matrix
 3     labelMatrix = np.mat(labelMat).transpose() #转置
 4     m,n = np.shape(dataMat)
 5     alpha = 0.1
 6     weight = np.ones(n) #float
 7     #weight = np.random.rand(n)
 8     for j in range(numIter):
 9         dataIndex = list(range(m)) #range 没有del 这个函数  所以转成list  del 见本函数倒数第二行
10         for i in range(m):
11             alpha = 4/(1.0 +j + i) + 0.01
12             randIndex = int(np.random.uniform(0,len(dataIndex))) #random.uniform(0,5) 生成0-5之间的随机数
13             #生成随机的样本来更新权重。
14             h = sigmoid(sum(dataMat[randIndex] * weight))
15             error = labelMat[randIndex] - h
16             weight = weight + alpha * error * np.array(dataMat[randIndex])  #!!!!一定要转成array才行
17             #dataMat[randIndex] 原来是list  list *2 是在原来的基础上长度变为原来2倍,
18             del(dataIndex[randIndex]) #从随机list中删除这个
19     return weight
5从病气病症预测病马的死亡率
 1 def classifyVector(inX,weight):  #输入测试带测试的向量 返回类别
 2     prob = sigmoid(sum(inX * weight))
 3     if prob > 0.5 :
 4         return 1.0
 5     else: return 0.0
 6 def colicTest():
 7     trainingSet ,trainingSetlabels =[],[]
 8     with open("horseColicTraining.txt") as frTrain:
 9         for lines in frTrain.readlines():
10             currtline = lines.strip().split('	')  # strip()remove the last string('/n') in everyline
11             linearr = [] #每行临时保存str 转换float的list
12             for i in range(21):   #将读进来的每行的前21个str 转换为float
13                 linearr.append(float(currtline[i]))
14             trainingSet.append(linearr)  #tianset 是2维的list
15             trainingSetlabels.append(float(currtline[21]))#第22个是类别
16     trainWeights = stocGradAscent1(trainingSet,trainingSetlabels,500)
17     errorCount = 0
18     numTestVec = 0.0
19     with open("horseColicTest.txt") as frTrain:
20         for lines in frTrain.readlines():
21             numTestVec += 1.0
22             currtline = lines.strip().split('	')  # strip()remove the last string('/n') in everyline
23             linearr = []  #测试集的每一行
24             for i in range(21):
25                 linearr.append(float(currtline[i]))#转换为float
26             if int(classifyVector(np.array(linearr),trainWeights)) != int(currtline[21]) :
27                 errorCount += 1  #输入带分类的向量,输出类别,类别不对,errorCount ++
28             errorRate = float(errorCount)/numTestVec
29             print("the error rate of this test is : %f"%errorRate)
30     return errorRate
31 def multiTest(): #所有测试集的错误率
32     numTests = 10
33     errorSum = 0.0
34     for k in range(numTests):
35         errorSum +=colicTest()
36     print("after %d iterations the average error rate is : %f" %(numTests,errorSum/float(numTests)))
主函数:
1 if __name__ == '__main__':
2     filename = "testSet.txt"
3     dataMat,labelMat = loadDataSet()
4     #weight = gradAscent(dataMat,labelMat)
5     weight = stocGradAscent1(dataMat,labelMat)
6     print(weight)
7     plotfit(weight)#画分类图像在小数据集上
8     multiTest() #真实数据集上测试