今天睡了14个小时,真的很舒服,好久没这么爽了,嘿嘿(*ヘ|・∀・|ノ*~●
结构化程序与自定函数
if else
a=3;
if rem(a,2)==0
    disp('a is even')
else
    disp('a is odd')
end
switch
input_num=1;
switch input_num
    case -1
        disp('negative 1');
    case 0
        disp('zero');
    otherwise
        disp('other value');
end
while
n=1;
while prod(1:n)<1e100
    n=n+1;
end
for
for variable=start:increment:end
commands
end
for n=1:2:10
    a(n)=2^n;
end
disp(a);
clear all 清除所有的历史数据
close all 关闭所有的数据
clc 清屏
... 换行
ctrl+c 终止程序
edit(which('mean.m')) 获取内建的函数
>> edit('mean.m');
自定义函数
function x=freebody(x0,v0,t)
x=x0+v0.*t+1/2*9.8*t.*t;
点乘和乘的区别
乘是矩阵的运算,点乘是矩阵中相同位置元素的乘法运算
在自定义函数中使用点乘可以同时算出多组数据
>> freebody([0,9],[2,7],[2,3])

ans =

   23.6000   74.1000
建立多个输入和输出的函数
function [a,F]=freebody(v2,v1,t2,t1,m)
a=(v2-v1)./(t2-t1);
F=m.*a;

[a F]=freebody(20,10,5,4,1)

a =

    10


F =

    10
function handle
基础绘图
line types
solid line -
dashed line --
dash-dotted line -.
dotted line :
hold on
x=0:pi/10:2*pi;
y1=sin(x);
y2=x;
plot(x,y1,':or',x,y2,'--+g');
hold off
hold on
x=0:0.5:4*pi;
y=sin(x);
hh=tan(x);
h=y./hh;
w=1./(1+exp(-x));
g=(1/(2*pi*2)^0.5).*exp((-1.*(x-2*pi).^2)./(2*2^2));
plot(x,y,'bd-',x,h,'gp:',x,w,'ro-',x,g,'c^-');
%添加标识
legend('sin(x)','cos(x)','Sigmoid','Gauss function');
%添加标题和坐标
title('标题');
xlabel('t=0to2pi');
ylabel('value');
hold off

text() 可用该函数在图形中指定的位置上显示字符串。
annotation() 添加注释、箭头、文本框等,默认坐标为0-1的归一化坐标
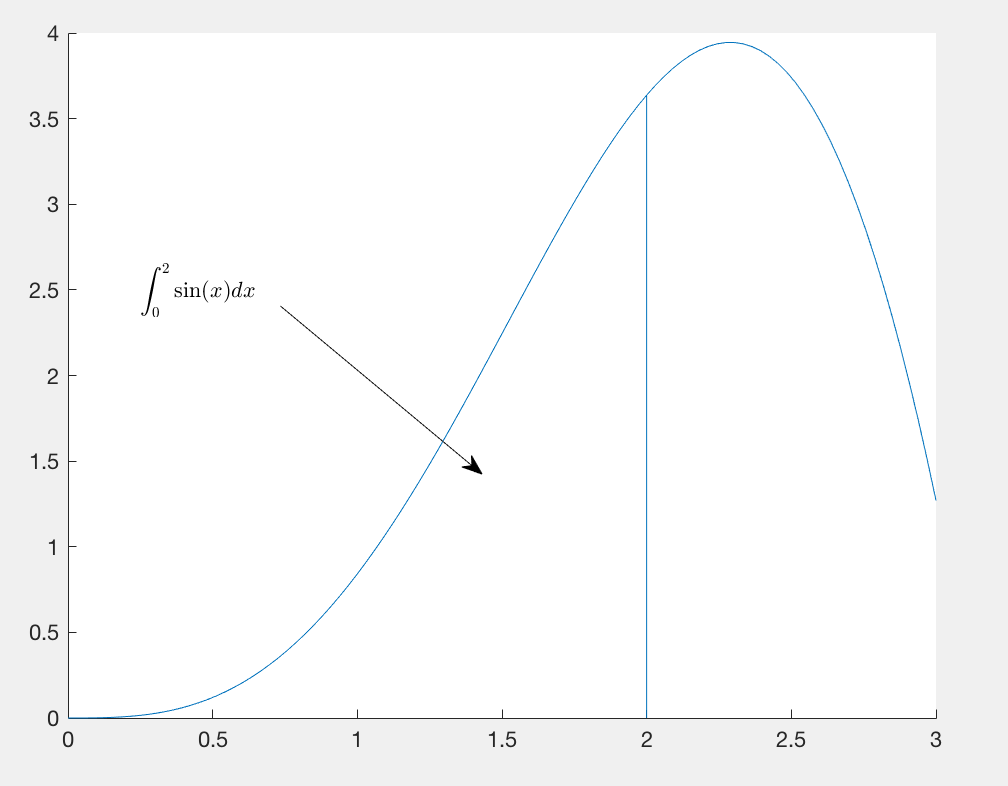
hold on
x=linspace(0,3);
y=x.^2.*sin(x);
plot(x,y);
line([2,2],[0,2^2*sin(2)]);
%积分符号 int  下标_{0} 上标{1}
str='$$ int_{0}^{2}sin(x) dx $$';
%以LaTeX表示法表示str,0.25表示x的坐标,2.5表示y的坐标
text(0.25,2.5,str,'Interpreter','latex');
%[0.32,0.5]是代表箭头在x坐标的位置,[0.6,0.4]是代表箭头在y坐标的位置,都要归一化,x乘3,y乘4
annotation('arrow','X',[0.32,0.5],'Y',[0.6,0.4]);
hold off
get() 获得句柄handle 详情https://ww2.mathworks.cn/help/matlab/ref/get.html
gca() return the handle of the "current" axes
gcf() return the handle the "current" figure
hold on
x=linspace(0,2*pi,1000);
y=sin(x);
plot(x,y);
h=plot(x,y);
get(h);
hold off
set(句柄,属性名1,属性值1,属性名2,属性值2,…) 设置句柄handle
set(gca,'Xlim',[0,pi]);
除了上面的方法可以设置handle,下面的方法也可以
xlim([0,2*pi]);
ylim([-1.2,1.2]);
%改变坐标的大小
set(gca,'FontSize',25);
%tick 设置几个刻度的意思
set(gca,'XTick',0:pi/2:2*pi);
set(gca,'XTickLabel',0:90:360);
%gca是针对坐标轴的改变
%改变线的样式 set(线的名称;样式;目标值,···);
set(h,'LineStyle','-.','LineWidth',7.0,'Color','g');
figure('Position',[left,bottom,width,height]);
多张图画在一张图上
只有一个figure subplot(row,column,1);
x=-10:0.1:10;
y1=x.^2-8;
y2=exp(x);
%可以表示写position,也可以不写
figure('Position',[300,100,500,500]),plot(x,y1);
figure,plot(x,y2);
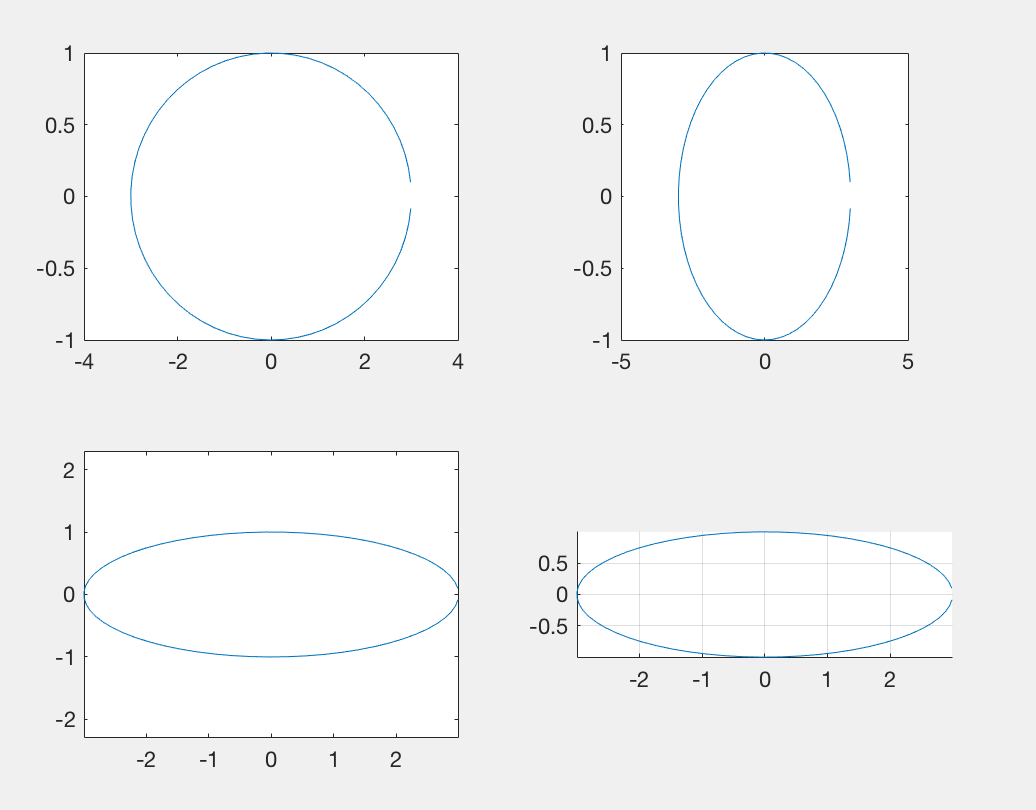
t=0:0.1:2*pi;
x=3*sin(t)./tan(t);
y=sin(t);
subplot(2,2,1);plot(x,y);axis normal;
subplot(2,2,2);plot(x,y);axis square;
%axis equal x轴上一格距离大小与y轴上一格距离大小一致
subplot(2,2,3);plot(x,y);axis equal;
subplot(2,2,4);plot(x,y);axis equal tight;
axis off 关闭最后画的一个图的坐标
axis on 打开最后画的一个图的坐标
box off 关闭最后画的一个图的上边线和右边线
box on 打开最后画的一个图的上边线和右边线
grid off 关闭最后一个画的图的栅格
grid on 打开最后一个画的图的栅格
>>box off
>> grid on
进阶绘图
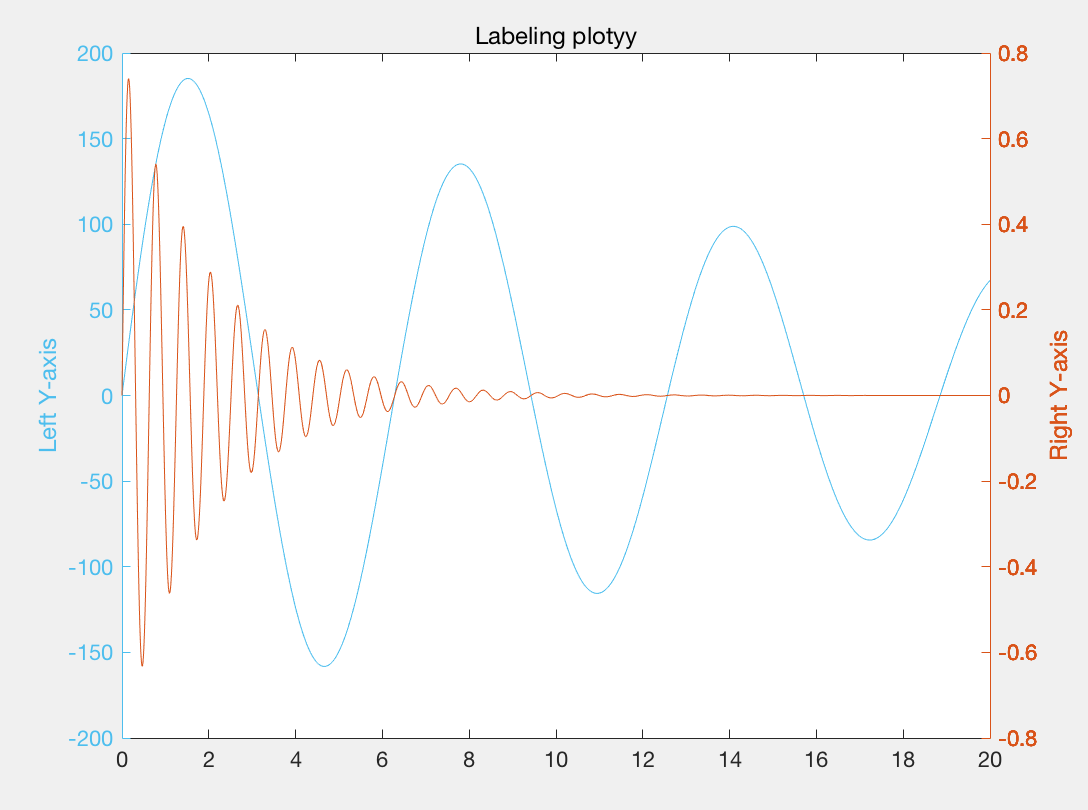
plotyy() 双y轴函数
hold on
x=0:0.01:20;
y1=200*exp(-0.05*x).*sin(x);
y2=0.8*exp(-0.5*x).*sin(10*x);
%下面的式子返回三个参数,ax是坐标轴的句柄,ax(1)是左边的纵轴,ax(2)时右边的纵轴
[ax,h1,h2]=plotyy(x,y1,x,y2);
set(get(ax(1),'Ylabel'),'String','Left Y-axis');
set(get(ax(2),'Ylabel'),'String','Right Y-axis');
title('Labeling plotyy');
set(h1,'LineStyle','--');
set(h2,'LineStyle',':');
plotyy(x,y1,x,y2);
hold off
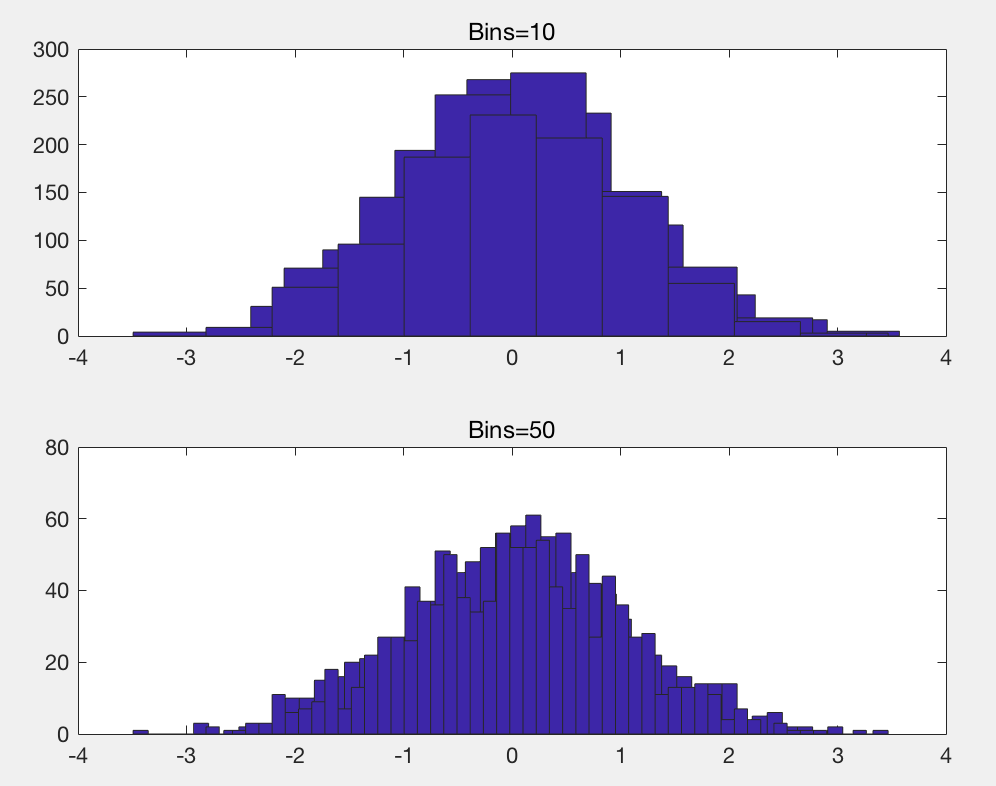
randn()是均值为0方差为1的正态分布
hist(y,m) m是一个标量,表明使用m个箱子
hold on
y=randn(1,1000);
subplot(2,1,1);
hist(y,10);
title('Bins=10');
subplot(2,1,2);
hist(y,50);
title('Bins=50');
hold off
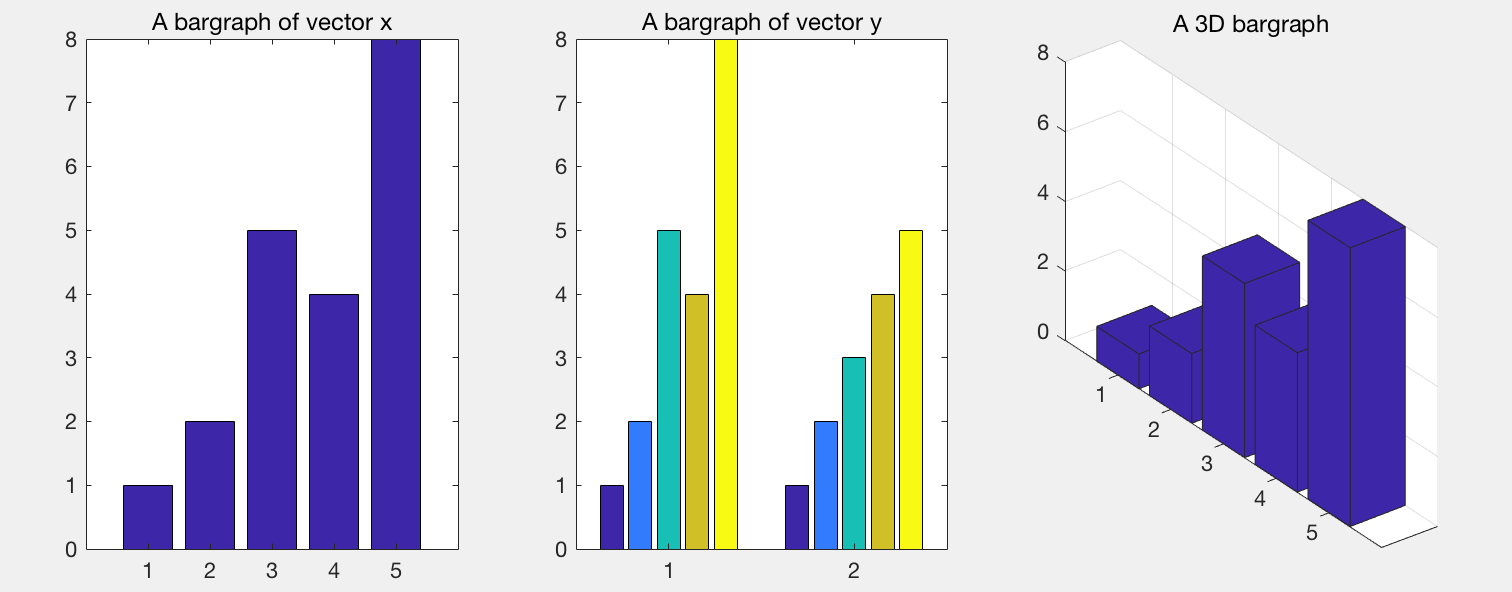
bar
hold on
x=[1 2 5 4 8];
y=[x;1:5];
subplot(1,3,1);bar(x);title('A bargraph of vector x');
subplot(1,3,2);bar(y);title('A bargraph of vector y');
subplot(1,3,3);bar3(x);title('A 3D bargraph');
hold off
详情https://www.mathworks.com/help/matlab/ref/barh.html
pie chart
hold on
a=[10 5 20 30];
subplot(1,3,1);pie(a);
subplot(1,3,2);pie(a,[0,0,0,1]);
subplot(1,3,3);pie3(a,[0,0,0,1]);
hold off

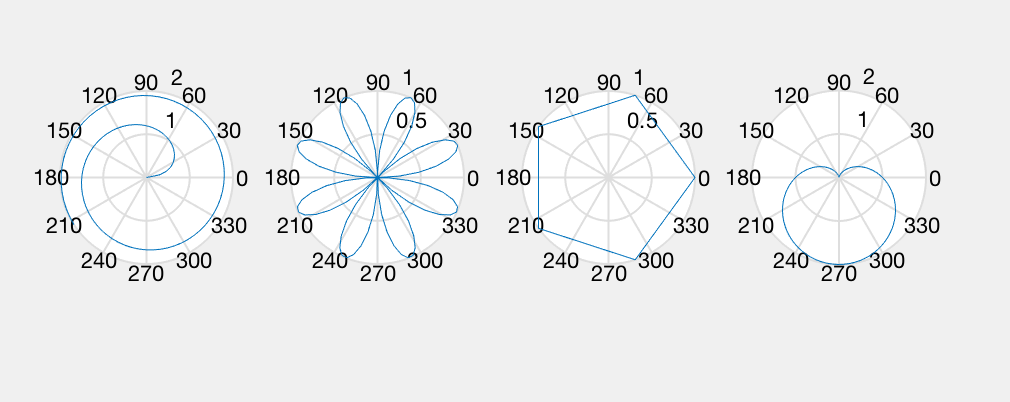
polar chart
hold on
x=1:100;
theta=x/10;r=log10(x);
subplot(1,4,1);polar(theta,r);
theta=linspace(0,2*pi);r=sin(4*theta);
subplot(1,4,2);polar(theta,r);
theta=linspace(0,2*pi,6);r=ones(1,length(theta));
subplot(1,4,3);polar(theta,r);
theta=linspace(0,2*pi);r=1-sin(theta);
subplot(1,4,4);polar(theta,r);
hold off
stairs and stem charts
stem(Y) 将数据序列Y从x轴到数据值按照茎状形式画出,以圆圈终止。如果Y是一个矩阵,则将其每一列按照分隔方式画出。
hold on
x=linspace(0,4*pi,40);
y=sin(x);
subplot(1,2,1);stairs(y);
subplot(1,2,2);stem(y);
hold off

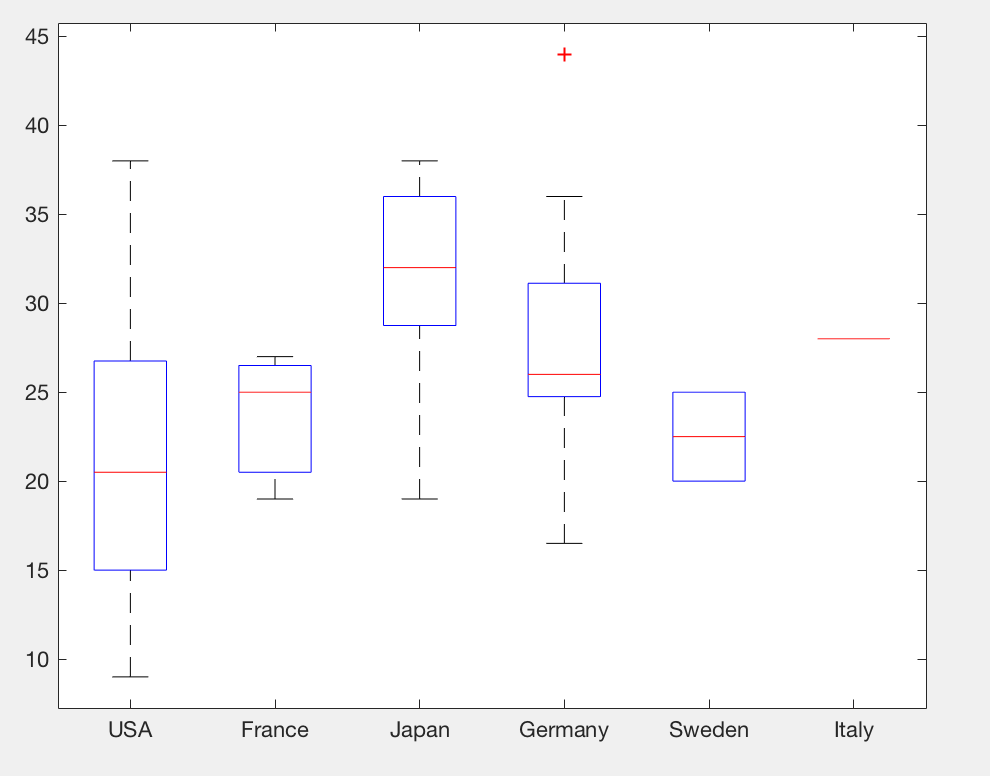
Boxplot and Error Bar
error bar 含误差条的线图 详情https://ww2.mathworks.cn/help/matlab/ref/errorbar.html
hold on
load carsmall
boxplot(MPG,Origin);
hold off
hold on
x=0:pi/10:pi;
y=sin(x);
e=std(y)*ones(size(x));
errorbar(x,y,e);
hold off;
