he power of a signal is the sum of the absolute squares of its time-domain samples divided by the signal length, or, equivalently, the square of its RMS level. The function bandpower allows you to estimate signal power in one step.
Consider a unit chirp embedded in white Gaussian noise and sampled at 1 kHz for 1.2 seconds. The chirp's frequency increases in one second from an initial value of 100 Hz to 300 Hz. The noise has variance 0.012. Reset the random number generator for reproducible results.
N = 1200;
Fs = 1000;
t = (0:N-1)/Fs;

sigma = 0.01;
rng('default')

s = chirp(t,100,1,300)+sigma*randn(size(t));
Verify that the power estimate given by bandpower is equivalent to the definition.
pRMS = rms(s)^2
pRMS = 0.5003
powbp = bandpower(s,Fs,[0 Fs/2])
powbp = 0.5005
Use the obw function to estimate the width of the frequency band that contains 99% of the power of the signal, the lower and upper bounds of the band, and the power in the band. The function also plots the spectrum estimate and annotates the occupied bandwidth.
obw(s,Fs);
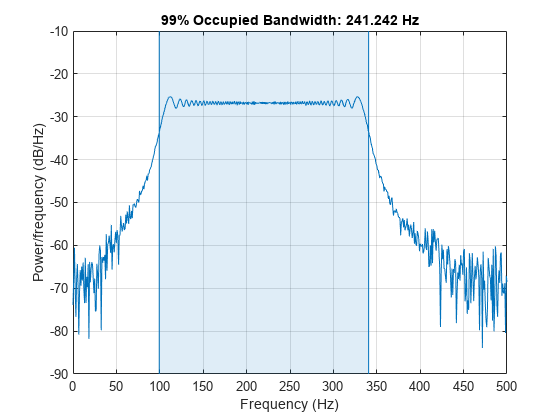
[wd,lo,hi,power] = obw(s,Fs);
powtot = power/0.99
powtot = 0.5003
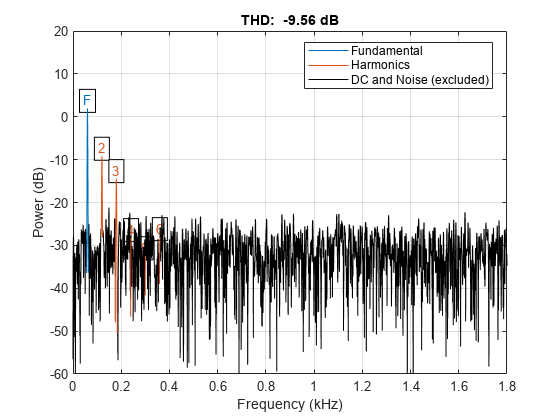
A nonlinear power amplifier is given a 60 Hz sinusoid as input and outputs a noisy signal with third-order distortion. The signal is sampled at 3.6 kHz for 2 seconds.
Fs = 3600;
t = 0:1/Fs:2-1/Fs;
x = sin(2*pi*60*t);
y = polyval(ones(1,4),x) + randn(size(x));
Because the amplifier introduces third-order distortion, the output signal is expected to have:
-
A fundamental component with the same frequency as the input, 60 Hz.
-
Two harmonics — frequency components at twice and three times the frequency of the input, 120 and 180 Hz.
Use the thd function to visualize the spectrum of the signal. Annotate the fundamental and the harmonics.
thd(y,Fs);
Use bandpower to determine the power stored in the fundamental and the harmonics. Express each value as a percentage of the total power and in decibels. Display the values as a table.
pwrTot = bandpower(y,Fs,[0 Fs/2]);

Harmonic = {'Fundamental';'First';'Second'};

Freqs = [60 120 180]';

Power = zeros([3 1]);
for k = 1:3
    Power(k) = bandpower(y,Fs,Freqs(k)+[-10 10]);
end

Percent = Power/pwrTot*100;

inDB = pow2db(Power);

T = table(Freqs,Power,Percent,inDB,'RowNames',Harmonic)
T=3×4 table
                   Freqs     Power     Percent     inDB
                   _____    _______    _______    _______

    Fundamental      60      1.5777    31.788      1.9804
    First           120     0.13141    2.6476     -8.8137
    Second          180     0.04672    0.9413     -13.305


Reference
  1. MathWorks