Signal Constellation Diagrams for Binary Signals
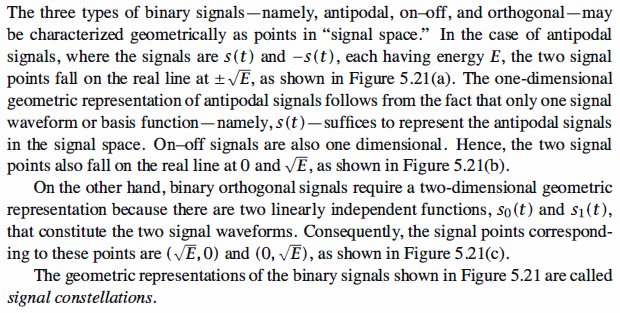
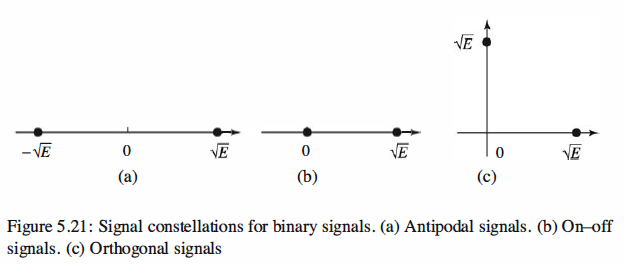
Matlab Coding
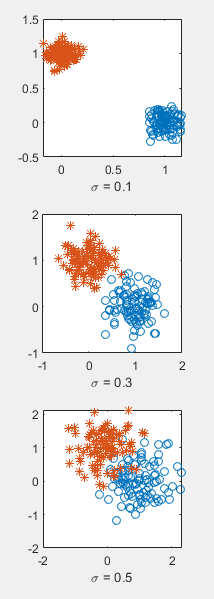
 1 % MATLAB script
 2 echo on
 3 x = [0.1,0.3,0.5];
 4
 5 for i = 1:3
 6     n0=x(i)*randn(100,1);
 7     n1=x(i)*randn(100,1);
 8     n2=x(i)*randn(100,1);
 9     n3=x(i)*randn(100,1);
10     x1=1.+n0;
11     y1=n1;
12     x2=n2;
13     y2=1.+n3;
14     subplot(3,1,i);
15     plot(x1,y1,'o',x2,y2,'*')
16     xlabel(['sigma = ', num2str(x(i))],'fontsize',10)
17     axis('square')
18 end


 Simulation Result
Reference,
1. <<Contemporary Communication System using MATLAB>> - John G. Proakis