学习内容为因果图的简答入门
Informations
1、Introduce:
From the description to identify programs written in natural language specification due to (input condition) and fruit ( the change of output or the state of the program), can be converted by causality determination table in FIG.
For the use of a composition suitable for describing a variety of conditions, to produce a plurality of corresponding acts testing methods, causal map is made in this context
2、Points
Steps needed:


1)analyse the cause and effects.
2)Use some sign restrictions or limitations on causal diagram.
3)Needs to be analyzed and the relationship between them is expressed as between cause and effect diagram in Figure.
4)The causal diagram into decision tables.
5)The determination of each column of the table as the basis for design of test cases.
Symbol
I find this picture in wiki, let me introduce the symbol for you.
Identity:equals if c1 then e1.
Or: if c1 c2 one casue then e1.
And: if c1and c2 both come true then e1.
Exculsive:if e,that only zero or one come true in a,b.
Inclusive:if i,that at least one come true in a,b,c.
Requires: a requires b,if a is true that b must come true.
Masks:if a is truth,that b must be false.
Only one: their must be one and only one is truth in a and b.
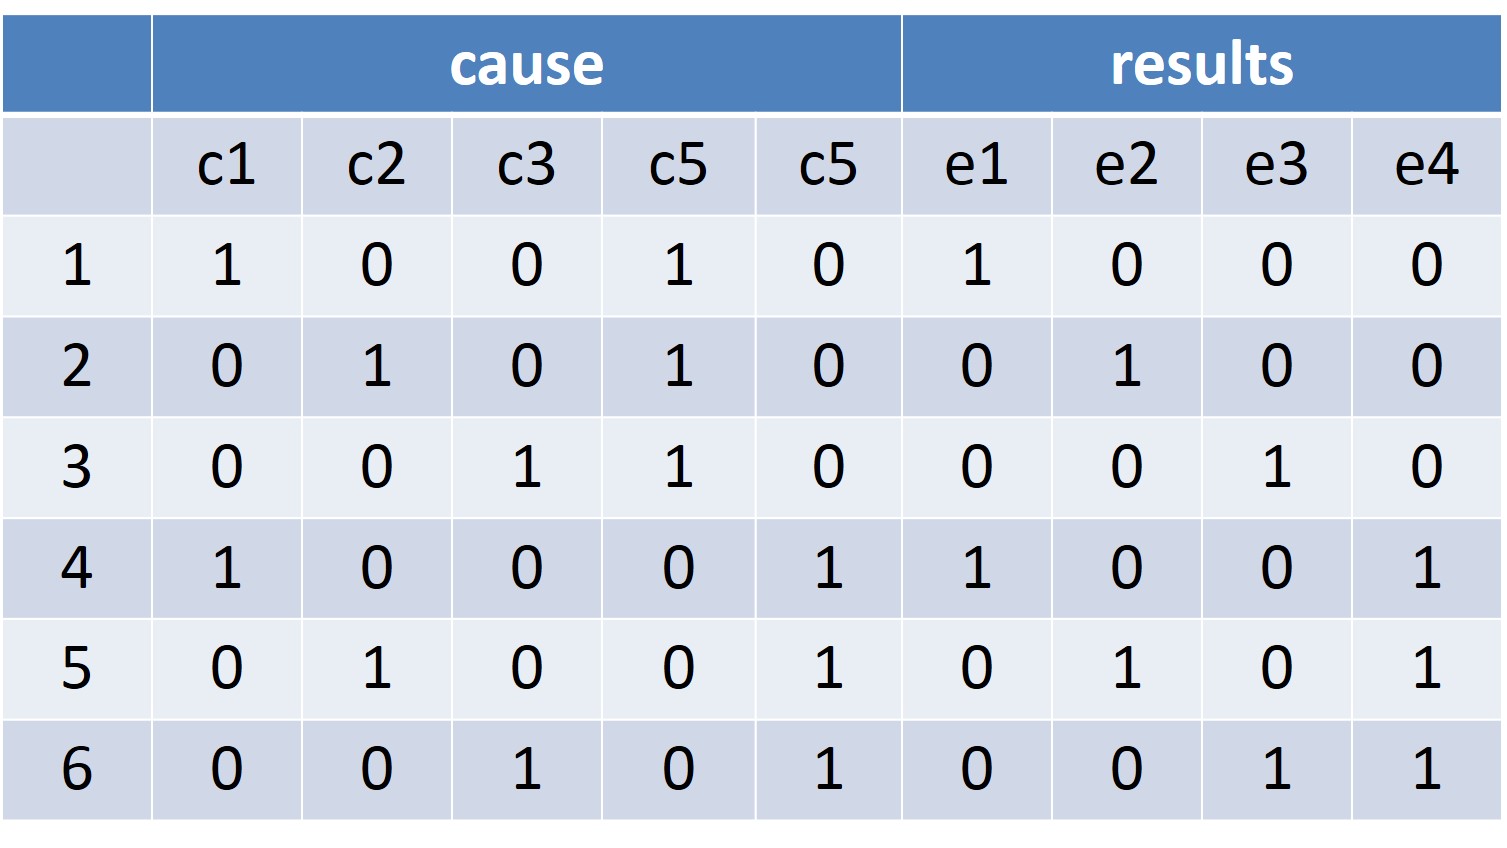
Decision table

This is decision table.In this table ,we show the condition of cause and results.
We have a needed example
有一个处理单价为1元5角钱的盒装饮料的自动售货机软件。若投入1元5角硬币,按下“可乐”、“雪碧”、“红茶”按钮,相应的饮料就送出来。若投入的是两元硬币,在送出饮料的同时退还5角硬币。
In this example we do not think that we push button once two. So it is easy to create decision table.

in this table
c1 按可乐 e1出可乐
c2 按雪碧 e2出雪碧
c3 按红茶 e3出红茶
c4 1.5元 e4找零0.5
c5 2元