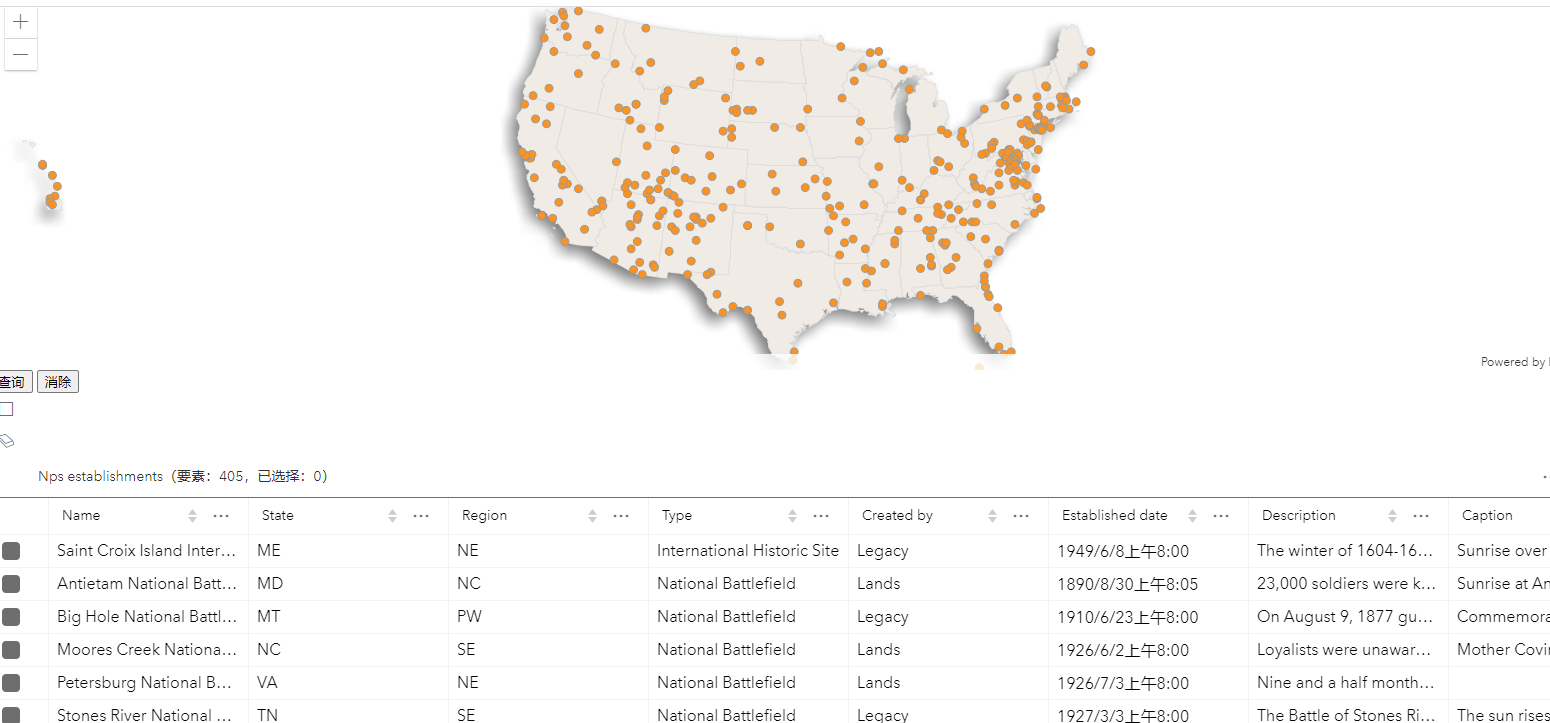
FeatureTable的使用方法,(其中csvLayer是之前定义的FeatureLayer图层,然后fieldConfigs就是对表头的重命名,如果删去的话,表头默认为数据中的名称)
      const featureTable = new FeatureTable({
        view: view,
        layer: csvLayer,
        highlightOnRowSelectEnabled: false,
        fieldConfigs: [
          {
            name: "unit_name",   //原名称
            label: "Name",      //表头显示的名称
          },
          {
            name: "state",
            label: "State",
          },
          {
            name: "region",
            label: "Region",
          },
          {
            name: "unit_type",
            label: "Type",
          },
          {
            name: "created_by",
            label: "Created by",
          },
          {
            name: "date_est",
            label: "Established date",
          },
          {
            name: "description",
            label: "Description",
          },
          {
            name: "caption",
            label: "Caption",
          },
        ],
        container: document.getElementById("tableDiv"),   //在html中声明的用于存放table的位置
      });

当FeatureTable中的多选框发生改变时,图中对应的节点发生变化
// this array will keep track of selected feature objectIds to
      // sync the layerview effects and feature table selection
      let features = [];


      // Listen for the table's selection-change event
      featureTable.on("selection-change", (changes) => {
        // if the feature is unselected then remove the objectId
        // of the removed feature from the features array
        changes.removed.forEach((item) => {
          const data = features.find((data) => {
            return data === item.objectId;
          });
          if (data) {
            features.splice(features.indexOf(data), 1);
          }
        });

        // If the selection is added, push all added selections to array
        changes.added.forEach((item) => {
          features.push(item.objectId);
        });

        // set excluded effect on the features that are not selected in the table
        csvLayerView.effect = {
          filter: {
            objectIds: features
          },
          excludedEffect: "blur(5px) grayscale(90%) opacity(40%)"
        };
      });
当然,我这也是从官方给的样例中摘取出来的,所以有需要的可以直接参考官方的样例
https://developers.arcgis.com/javascript/latest/sample-code/highlight-features-by-geometry/