ELk简介
E:	elasticsearch	存储数据			    java
L:	logstash		收集,过滤,转发,匹配,大,启动慢,中间角色	     java
K:	kibana			过滤,分析,图形展示		java
F:  filebeat 		收集日志,过滤 		  go
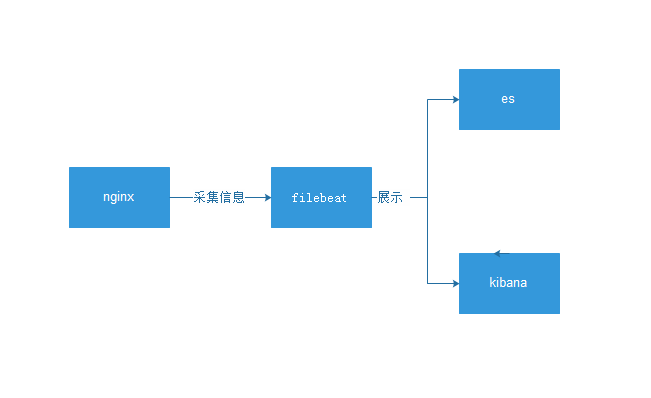
基本架构图

传统日志分析需求(面试)
1.找出访问网站频次最高的 IP 排名前十
2.找出访问网站排名前十的 URL
3.找出中午 10 点到 2 点之间 www 网站访问频次最高的 IP
4.对比昨天这个时间段和今天这个时间段访问频次有什么变化
5.对比上周这个时间和今天这个时间的区别
6.找出特定的页面被访问了多少次
7.找出有问题的 IP 地址,并告诉我这个 IP 地址都访问了什么页面,在对比前几天他来过吗?他从什么时间段开
始访问的,什么时间段走了
8.找出来访问最慢的前十个页面并统计平均响应时间,对比昨天这也页面访问也这么慢吗?
9.找出搜索引擎今天各抓取了多少次?抓取了哪些页面?响应时间如何?
10.找出伪造成搜索引擎的 IP 地址
yum provides host
安装软件包
host +ip 我可以看到ip是否伪装
11.5 分钟之内告诉我结果
日志收集分类
代理层: nginx haproxy
web层:  nginx tomcat java php
db层:   mysql mongo redis es
系统层: message secure
存储层:nfs gfs
部署
ELK安装部署
准备单机环境
db01  nginx filebet es kibana es-head
db02  nginx filebet

1.es单机环境准备
cat >/etc/elasticsearch/elasticsearch.yml <<EOF
node.name: node-1
path.data: /var/lib/elasticsearch
path.logs: /var/log/elasticsearch
network.host: 10.0.0.51,127.0.0.1
http.port: 9200
EOF

systemctl stop elasticsearch
rm -rf /var/lib/elasticsearch/*
rm -rf /var/lib/kibana/*
systemctl start elasticsearch
systemctl start kibana
tail -f /var/log/elasticsearch/elasticsearch.log
netstat -lntup|egrep "5601|9200"
filebet收集nginx普通格式日志
ES
kibana
es-head
0.更新系统时间
ntpdate time1.aliyun.com
1.安装Nginx
cat >/etc/yum.repos.d/nginx.repo <<EOF
[nginx-stable]
name=nginx stable repo
baseurl=http://nginx.org/packages/centos/$releasever/$basearch/
gpgcheck=1
enabled=1
gpgkey=https://nginx.org/keys/nginx_signing.key
module_hotfixes=true
[nginx-mainline]
name=nginx mainline repo
baseurl=http://nginx.org/packages/mainline/centos/$releasever/$basearch/
gpgcheck=1
enabled=0
gpgkey=https://nginx.org/keys/nginx_signing.key
module_hotfixes=true
EOF
yum install nginx -y
systemctl start nginx
curl 127.0.0.1
2.配置Nginx并创建测试页面
rm -rf /etc/nginx/conf.d/default.conf
cat >/etc/nginx/conf.d/www.conf<<EOF
server {
listen 80;
server_name localhost;
location / {
root /code/www;
index index.html index.htm;
}
}
EOF
mkdir /code/www/ -p
echo "db01-www" > /code/www/index.html
nginx -t
systemctl restart nginx
curl 127.0.0.1
tail -f /var/log/nginx/access.log
2.安装filebeat
rpm -ivh filebeat-6.6.0-x86_64.rpm
rpm -qc filebeat
3.配置filebeat
[root@db-01 /data/soft]# cat /etc/filebeat/filebeat.yml
filebeat.inputs:
- type: log
enabled: true
paths:
- /var/log/nginx/access.log
output.elasticsearch:
hosts: ["10.0.0.51:9200"]
4.启动并检查
systemctl start filebeat
tail -f /var/log/filebeat/filebeat
5.查看日志结果
es-head查看
curl -s 127.0.0.1:9200/_cat/indices|awk '{print $3}'
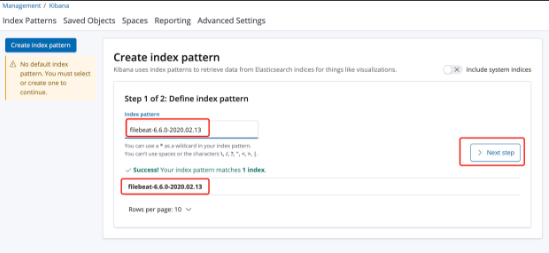
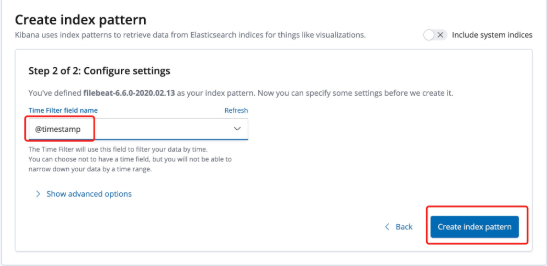
6.kibana添加索引
Management-->kibana-->Index Patterns-->filebeat-6.6.0-2020.02.13
kibana界面

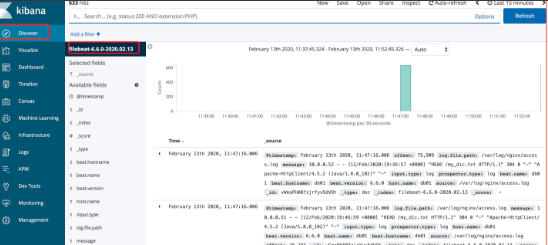
kibana区域介绍
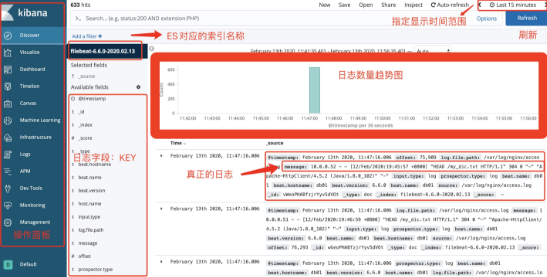

filebeat收集nginx的json各式日志
1.普通Nginx日志不足的地方:
- 日志都在一个value里,不能拆分单独显示和搜索
- 索引名称没有意义

2.理想中的情况
{
    $remote_addr : 192.168.12.254
    - : -
    $remote_user : -
    [$time_local]: [10/Sep/2019:10:52:08 +0800]
    $request: GET /jhdgsjfgjhshj HTTP/1.0
    $status : 404
    $body_bytes_sent : 153
    $http_referer : -
    $http_user_agent :ApacheBench/2.3
    $http_x_forwarded_for:-
}

3.目标
将Nginx日志转换成json格式

4.修改nginx配置文件使日志转换成json
vim /etc/nginx/nginx.conf
log_format json '{ "time_local": "$time_local", '
                          '"remote_addr": "$remote_addr", '
                          '"referer": "$http_referer", '
                          '"request": "$request", '
                          '"status": $status, '
                          '"bytes": $body_bytes_sent, '
                          '"agent": "$http_user_agent", '
                          '"x_forwarded": "$http_x_forwarded_for", '
                          '"up_addr": "$upstream_addr",'
                          '"up_host": "$upstream_http_host",'
                          '"upstream_time": "$upstream_response_time",'
                          '"request_time": "$request_time"'
    ' }';
    access_log  /var/log/nginx/access.log  json;

清空旧日志
> /var/log/nginx/access.log

检查并重启nginx
nginx -t
systemctl restart nginx

5.修改filebeat配置文件
cat >/etc/filebeat/filebeat.yml<<EOF
filebeat.inputs:
- type: log
  enabled: true
  paths:
    - /var/log/nginx/access.log
  json.keys_under_root: true
  json.overwrite_keys: true
output.elasticsearch:
  hosts: ["10.0.0.51:9200"]
EOF

6.删除旧的ES索引
es-head >> filebeat-6.6.0-2019.11.15 >> 动作 >>删除

7.重启filebeat
systemctl restart filebeat
curl 127.0.0.1生成新的日志,
8,删除kibana
自定义索引名称
filebeat自定义ES索引名称

1.理想中的索引名称
filebeat-6.6.0-2020.02.13
nginx-6.6.0-2019.11.15

2.filebeat配置
cat >/etc/filebeat/filebeat.yml<<EOF
filebeat.inputs:
- type: log
  enabled: true
  paths:
    - /var/log/nginx/access.log
  json.keys_under_root: true
  json.overwrite_keys: true

output.elasticsearch:
  hosts: ["10.0.0.51:9200"]
  index: "nginx-%{[beat.version]}-%{+yyyy.MM}"

setup.template.name: "nginx"
setup.template.pattern: "nginx-*"
setup.template.enabled: false
setup.template.overwrite: true
EOF

3.重启filebeat
systemctl restart filebeat

4.生成新日志并检查
curl 127.0.0.1

es-head里索引名称
nginx-6.6.0-2020.02

5.kibana添加
按日志分类存储
filebeat按照服务类型拆分索引

1.理想中的情况:
nginx-access-6.6.0-2020.02
nginx-error-6.6.0-2020.02

2.filebeat配置
第一种方法:
cat >/etc/filebeat/filebeat.yml <<EOF
filebeat.inputs:
- type: log
  enabled: true
  paths:
    - /var/log/nginx/access.log
  json.keys_under_root: true
  json.overwrite_keys: true

- type: log
  enabled: true
  paths:
    - /var/log/nginx/error.log

output.elasticsearch:
  hosts: ["10.0.0.51:9200"]
  indices:
    - index: "nginx-access-%{[beat.version]}-%{+yyyy.MM}"
      when.contains:
        source: "/var/log/nginx/access.log"
    - index: "nginx-error-%{[beat.version]}-%{+yyyy.MM}"
      when.contains:
        source: "/var/log/nginx/error.log"

setup.template.name: "nginx"
setup.template.pattern: "nginx-*"
setup.template.enabled: false
setup.template.overwrite: true
EOF

第二种方法:
cat >/etc/filebeat/filebeat.yml <<EOF
filebeat.inputs:
- type: log
  enabled: true
  paths:
    - /var/log/nginx/access.log
  json.keys_under_root: true
  json.overwrite_keys: true
  tags: ["access"]

- type: log
  enabled: true
  paths:
    - /var/log/nginx/error.log
  tags: ["error"]

output.elasticsearch:
  hosts: ["10.0.0.51:9200"]
  indices:
    - index: "nginx-access-%{[beat.version]}-%{+yyyy.MM}"
      when.contains:
        tags: "access"
    - index: "nginx-error-%{[beat.version]}-%{+yyyy.MM}"
      when.contains:
        tags: "error"

setup.template.name: "nginx"
setup.template.pattern: "nginx-*"
setup.template.enabled: false
setup.template.overwrite: true
EOF

3.重启filebeat
systemctl restart filebeat

4.生成测试数据
curl 127.0.0.1/zhangya

5.检查是否生成对应的索引
nginx-access-6.6.0-2020.02
nginx-error-6.6.0-2020.02
收集多台nginx日志
1.安装nginx
yum install nginx

2.复制db01配置文件
scp 10.0.0.51:/etc/nginx/nginx.conf /etc/nginx/nginx.conf
scp 10.0.0.51:/etc/nginx/conf.d/www.conf /etc/nginx/conf.d/

3.创建测试页面
mkdir /code/www/ -p
echo "db02-www" > /code/www/index.html

4.重启nginx
>/var/log/nginx/access.log
>/var/log/nginx/error.log
nginx -t
systemctl restart nginx

5.生成测试页面
curl 127.0.0.1/22222222222222

6.安装filebeat
rpm -ivh filebeat...

7.复制filebeat配置文件
scp 10.0.0.51:/etc/filebeat/filebeat.yml /etc/filebeat/

8.启动filebeat
systemctl restart filebeat
filebeat原理
类似tail -f
实时读取,会记录上一次已经传送的位置点
自定义kibana图形
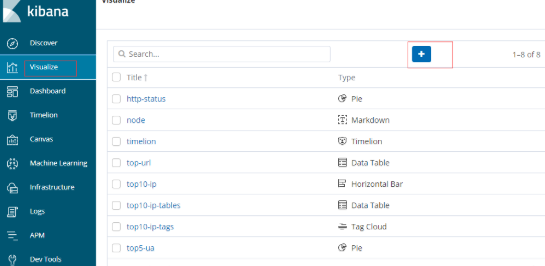
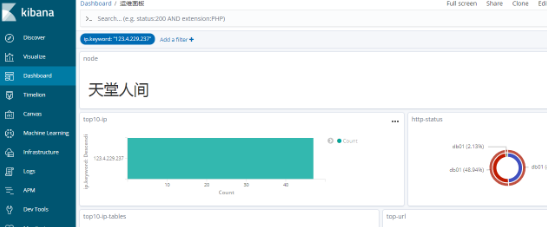
组合面板


过滤查看
收集tomcat的json日志
1.安装tomcat
yum install tomcat tomcat-webapps tomcat-admin-webapps tomcat-docs-webapp tomcat-javadoc -y

filebeat收集tomcat的json日志

1.安装tomcat
yum install tomcat -y
systemctl start tomcat
tail -f /var/log/tomcat/localhost_access_log.2020-02-14.txt

2.修改tomcat配置将日志转换为json格式
cp /etc/tomcat/server.xml /opt/
vim /etc/tomcat/server.xml
pattern="{"clientip":"%h","ClientUser":"%l","authenticated":"%u","AccessTime":"%t","method":"%r","status":"%s","SendBytes":"%b","Query?string":"%q","partner":"%{Referer}i","AgentVersion":"%{User-Agent}i"}"/>

3.清空日志并重启
> /var/log/tomcat/localhost_access_log.2020-02-14.txt
systemctl restart tomcat

4.访问并查看日志是否为json格式
curl 127.0.0.1:8080
tail -f /var/log/tomcat/localhost_access_log.2020-02-14.txt

5.创建filebeat配置文件
cat >/etc/filebeat/filebeat.yml <<EOF
filebeat.inputs:
- type: log
  enabled: true
  paths:
    - /var/log/nginx/access.log
  json.keys_under_root: true
  json.overwrite_keys: true
  tags: ["access"]

- type: log
  enabled: true
  paths:
    - /var/log/nginx/error.log
  tags: ["error"]

- type: log
  enabled: true
  paths:
    - /var/log/tomcat/localhost_access_log.*.txt
  json.keys_under_root: true
  json.overwrite_keys: true
  tags: ["tomcat"]

output.elasticsearch:
  hosts: ["10.0.0.51:9200"]
  indices:
    - index: "nginx-access-%{[beat.version]}-%{+yyyy.MM}"
      when.contains:
        tags: "access"
    - index: "nginx-error-%{[beat.version]}-%{+yyyy.MM}"
      when.contains:
        tags: "error"
    - index: "tomcat-%{[beat.version]}-%{+yyyy.MM}"
      when.contains:
        tags: "tomcat"

setup.template.name: "nginx"
setup.template.pattern: "nginx-*"
setup.template.enabled: false
setup.template.overwrite: true
EOF

6.重启filebeat并检查
systemctl restart filebeat
收集JAVA日志
https://www.elastic.co/guide/en/beats/filebeat/6.6/multiline-examples.html
java日志的特点:
1.报错信息巨多
2.报错信息巨多还是一个事件.不能分开看

一段java报错日志如下:
[2019-09-10T16:15:41,630][ERROR][o.e.b.Bootstrap          ] [CcJTI28] Exception
java.lang.IllegalArgumentException: unknown setting [nnode.name] did you mean [node.name]?
        at org.elasticsearch.common.settings.AbstractScopedSettings.validate(AbstractScopedSettings.java:482) ~[elasticsearch-6.6.0.jar:6.6.0]
        at org.elasticsearch.common.settings.AbstractScopedSettings.validate(AbstractScopedSettings.java:427) ~[elasticsearch-6.6.0.jar:6.6.0]
        at org.elasticsearch.common.settings.AbstractScopedSettings.validate(AbstractScopedSettings.java:398) ~[elasticsearch-6.6.0.jar:6.6.0]
        at org.elasticsearch.common.settings.AbstractScopedSettings.validate(AbstractScopedSettings.java:369) ~[elasticsearch-6.6.0.jar:6.6.0]
        at org.elasticsearch.common.settings.SettingsModule.<init>(SettingsModule.java:148) ~[elasticsearch-6.6.0.jar:6.6.0]
[2019-09-10T16:18:16,742][INFO ][o.e.c.m.MetaDataIndexTemplateService] [node-1] adding template [kibana_index_template:.kibana] for index patterns [.kibana]
[2019-09-10T16:18:17,981][INFO ][o.e.c.m.MetaDataIndexTemplateService] [node-1] adding template [kibana_index_template:.kibana] for index patterns [.kibana]
[2019-09-10T16:18:33,417][INFO ][o.e.c.m.MetaDataIndexTemplateService] [node-1] adding template [kibana_index_template:.kibana] for index patterns [.kibana]

匹配思路:
1.java报错日志特点
正常日志是以[日期]开头的
报错日志行数多,但是不是以[
2.匹配以[开头的行,一直到下一个以[开头的行,中间所有的数据属于一个事件,放在一起发给ES
 filebeat收集java多行匹配模式
1.filebeat配置文件
cat >/etc/filebeat/filebeat.yml<<EOF
filebeat.inputs:
- type: log
  enabled: true
  paths:
    - /var/log/elasticsearch/elasticsearch.log
  multiline.pattern: '^['
  multiline.negate: true
  multiline.match: after

output.elasticsearch:
  hosts: ["10.0.0.51:9200"]
  index: "es-%{[beat.version]}-%{+yyyy.MM}"

setup.template.name: "es"
setup.template.pattern: "es-*"
setup.template.enabled: false
setup.template.overwrite: true
EOF

2.重启filebeat
systemctl restart filebeat

3.检查java报错日志是否合并成一行了
kibana添加索引然后搜索关键词 at org
filbeat模块module
作用:
可以将特定的服务的普通日志转成json格式

filbeat使用模块收集nginx日志
1.清空并把nginx日志恢复成普通格式
#清空日志
>/var/log/nginx/access.log

#编辑配置文件
vi /etc/nginx/nginx.conf
    log_format  main  '$remote_addr - $remote_user [$time_local] "$request" '
                      '$status $body_bytes_sent "$http_referer" '
                      '"$http_user_agent" "$http_x_forwarded_for"';
    access_log  /var/log/nginx/access.log  main;

#检查并重启
nginx -t
systemctl restart nginx

2.访问并检查日志是否为普通格式
curl 127.0.0.1
tail -f /var/log/nginx/access.log


3.配置filebeat配置文件支持模块
vim /etc/filebeat/filebeat.yml
filebeat.config.modules:
  path: ${path.config}/modules.d/*.yml
  reload.enabled: true
  reload.period: 10s

output.elasticsearch:
  hosts: ["10.0.0.51:9200"]
  indices:
  - index: "nginx-access-%{[beat.version]}-%{+yyyy.MM}"
    when.contains:
      event.dataset: "nginx.access"
  - index: "nginx-error-%{[beat.version]}-%{+yyyy.MM}"
    when.contains:
      event.dataset: "nginx.error"

setup.template.name: "nginx"
setup.template.pattern: "nginx-*"
setup.template.enabled: false
setup.template.overwrite: true


4.激活filebeat的nginx模块
filebeat modules enable nginx
filebeat modules list

5.配置filebeat的nginx模块配置文件
cat >/etc/filebeat/modules.d/nginx.yml <<EOF
- module: nginx
  access:
    enabled: true
    var.paths: ["/var/log/nginx/access.log"]

  error:
    enabled: true
    var.paths: ["/var/log/nginx/error.log"]
EOF


6.es安装filebeat的nginx模块必要插件并重启
cd /usr/share/elasticsearch/:
./bin/elasticsearch-plugin install file:///root/ingest-geoip-6.6.0.zip
./bin/elasticsearch-plugin install file:///root/ingest-user-agent-6.6.0.zip
systemctl restart elasticsearch

7.重启filebeat
systemctl restart filebeat
filebeat使用模块收集mysql日志
1.配置mysql错误日志和慢日志路径
编辑my.cnf
log-error=错误日志路径
slow_query_log=ON
slow_query_log_file=慢日志日志路径
long_query_time=3

2.重启mysql并制造慢日志
systemctl restart mysql
慢日志制造语句
select sleep(2) user,host from mysql.user ;

3.确认慢日志和错误日志确实有生成

4.激活filebeat的mysql模块
filebeat module enable mysql

5.配置mysql的模块
- module: mysql
  error:
    enabled: true
    var.paths: ["错误日志路径"]

  slowlog:
    enabled: true
    var.paths: ["慢日志日志路径"]

6.配置filebeat根据日志类型做判断
filebeat.config.modules:
  path: ${path.config}/modules.d/*.yml
  reload.enabled: true
  reload.period: 10s

output.elasticsearch:
  hosts: ["10.0.0.51:9200"]
  indices:
    - index: "nginx_access-%{[beat.version]}-%{+yyyy.MM}"
      when.contains:
        fileset.module: "nginx"
        fileset.name: "access"
    - index: "nginx_error-%{[beat.version]}-%{+yyyy.MM}"
      when.contains:
        fileset.module: "nginx"
        fileset.name: "error"

    - index: "mysql_slowlog-%{[beat.version]}-%{+yyyy.MM}"
      when.contains:
        fileset.module: "mysql"
        fileset.name: "slowlog"
    - index: "mysql_error-%{[beat.version]}-%{+yyyy.MM}"
      when.contains:
        fileset.module: "mysql"
        fileset.name: "error"

setup.template.name: "nginx"
setup.template.pattern: "nginx_*"
setup.template.enabled: false
setup.template.overwrite: true

7.重启filebeat
systemctl restart filebeat
使用input的docker类型收集docker日志
docker


1.安装dockder
yum install -y yum-utils device-mapper-persistent-data lvm2
wget -O /etc/yum.repos.d/docker-ce.repo https://download.docker.com/linux/centos/docker-ce.repo
sed -i 's+download.docker.com+mirrors.tuna.tsinghua.edu.cn/docker-ce+' /etc/yum.repos.d/docker-ce.repo
yum makecache fast
yum install docker-ce -y
mkdir -p /etc/docker
tee /etc/docker/daemon.json <<-'EOF'
{
  "registry-mirrors": ["https://ig2l319y.mirror.aliyuncs.com"]
}
EOF
systemctl daemon-reload
systemctl restart docker

2.启动2个Nginx容器并访问测试
docker run -d -p 80:80 nginx
docker run -d -p 8080:80 nginx

curl 10.0.0.52
curl 10.0.0.52:8080

3.配置filebeat
[root@db02 ~]# cat /etc/filebeat/filebeat.yml
filebeat.inputs:
- type: docker
  containers.ids:
    - '*'

output.elasticsearch:
  hosts: ["10.0.0.51:9200"]
  index: "docker-%{[beat.version]}-%{+yyyy.MM}"

setup.template.name: "docker"
setup.template.pattern: "docker-*"
setup.template.enabled: false
setup.template.overwrite: true

4.重启filebeat
systemctl restart filebeat

5.访问生成测试数据
curl 10.0.0.52/1111111111
curl 10.0.0.52:8080/2222222222
使用docker-compose启动docker容器
场景:
容器1: nginx
容器2: mysql

filebeat收集docker日志可以早下班版

1.假设的场景
nginx容器 80端口
mysql容器 8080端口

2.理想中的索引名称
docker-nginx-6.6.0-2020.02
docker-mysql-6.6.0-2020.02

3.理想的日志记录格式
nginx容器日志:
{
	"log": "xxxxxx",
	"stream": "stdout",
	"time": "xxxx",
	"service": "nginx"
}

mysql容器日志:
{
	"log": "xxxxxx",
	"stream": "stdout",
	"time": "xxxx",
	"service": "mysql"
}

4.docker-compose配置
yum install docker-compose -y
cat >docker-compose.yml<<EOF
version: '3'
services:
  nginx:
    image: nginx:latest
    labels:
      service: nginx
    logging:
      options:
        labels: "service"
    ports:
      - "80:80"
  db:
    image: nginx:latest
    labels:
      service: db
    logging:
      options:
        labels: "service"
    ports:
      - "8080:80"
EOF


5.删除旧的容器
docker stop $(docker ps -q)
docker rm $(docker ps -qa)

6.启动容器
docker-compose up -d

7.配置filebeat
cat >/etc/filebeat/filebeat.yml <<EOF
filebeat.inputs:
- type: log
  enabled: true
  paths:
    - /var/lib/docker/containers/*/*-json.log
  json.keys_under_root: true
  json.overwrite_keys: true

output.elasticsearch:
  hosts: ["10.0.0.51:9200"]
  indices:
    - index: "docker-nginx-%{[beat.version]}-%{+yyyy.MM}"
      when.contains:
        attrs.service: "nginx"
    - index: "docker-db-%{[beat.version]}-%{+yyyy.MM}"
      when.contains:
        attrs.service: "db"

setup.template.name: "docker"
setup.template.pattern: "docker-*"
setup.template.enabled: false
setup.template.overwrite: true
EOF

8.重启filebeat
systemctl restart filebeat

9.生成访问日志
curl 127.0.0.1/nginxxxxxxxxxxx
curl 127.0.0.1:8080/dbbbbbbbbb
根据服务分类
目前不完善的地方
正常日志和报错日志放在一个索引里了

2.理想中的索引名称
docker-nginx-access-6.6.0-2020.02
docker-nginx-error-6.6.0-2020.02
docker-db-access-6.6.0-2020.02
docker-db-error-6.6.0-2020.02

3.filebeat配置文件
cat >/etc/filebeat/filebeat.yml <<EOF
filebeat.inputs:
- type: log
  enabled: true
  paths:
    - /var/lib/docker/containers/*/*-json.log
  json.keys_under_root: true
  json.overwrite_keys: true

output.elasticsearch:
  hosts: ["10.0.0.51:9200"]
  indices:
    - index: "docker-nginx-access-%{[beat.version]}-%{+yyyy.MM}"
      when.contains:
        attrs.service: "nginx"
        stream: "stdout"
    - index: "docker-nginx-error-%{[beat.version]}-%{+yyyy.MM}"
      when.contains:
        attrs.service: "nginx"
        stream: "stderr"

    - index: "docker-db-access-%{[beat.version]}-%{+yyyy.MM}"
      when.contains:
        attrs.service: "db"
        stream: "stdout"
    - index: "docker-db-error-%{[beat.version]}-%{+yyyy.MM}"
      when.contains:
        attrs.service: "db"
        stream: "stderr"

setup.template.name: "docker"
setup.template.pattern: "docker-*"
setup.template.enabled: false
setup.template.overwrite: true
EOF

4.重启filebeat
systemctl restart filebeat

5.生成测试数据
curl 127.0.0.1/nginxxxxxxxxxxx
curl 127.0.0.1:8080/dbbbbbbbbb
收集docker日志涨薪版
1.需求分析
json格式并且按照下列索引生成
docker-nginx-access-6.6.0-2020.02
docker-db-access-6.6.0-2020.02
docker-db-error-6.6.0-2020.02
docker-nginx-error-6.6.0-2020.02


2.停止并且删除以前的容器
docker stop $(docker ps -qa)
docker rm $(docker ps -qa)

3.创建新容器
docker run -d -p 80:80 -v /opt/nginx:/var/log/nginx/ nginx
docker run -d -p 8080:80 -v /opt/mysql:/var/log/nginx/ nginx

4.准备json格式的nginx配置文件
scp 10.0.0.51:/etc/nginx/nginx.conf /root/

[root@db02 ~]# grep "access_log" nginx.conf
    access_log  /var/log/nginx/access.log  json;

5.拷贝到容器里并重启
docker cp nginx.conf Nginx容器的ID:/etc/nginx/
docker cp nginx.conf mysql容器的ID:/etc/nginx/
docker stop $(docker ps -qa)
docker start Nginx容器的ID
docker start mysql容器的ID


6.删除ES已经存在的索引


7.配置filebeat配置文件
cat >/etc/filebeat/filebeat.yml <<EOF
filebeat.inputs:
- type: log
  enabled: true
  paths:
    - /opt/nginx/access.log
  json.keys_under_root: true
  json.overwrite_keys: true
  tags: ["nginx_access"]

- type: log
  enabled: true
  paths:
    - /opt/nginx/error.log
  tags: ["nginx_err"]

- type: log
  enabled: true
  paths:
    - /opt/mysql/access.log
  json.keys_under_root: true
  json.overwrite_keys: true
  tags: ["db_access"]

- type: log
  enabled: true
  paths:
    - /opt/mysql/error.log
  tags: ["db_err"]

output.elasticsearch:
  hosts: ["10.0.0.51:9200"]
  indices:
    - index: "docker-nginx-access-%{[beat.version]}-%{+yyyy.MM}"
      when.contains:
        tags: "nginx_access"

    - index: "docker-nginx-error-%{[beat.version]}-%{+yyyy.MM}"
      when.contains:
        tags: "nginx_err"

    - index: "docker-db-access-%{[beat.version]}-%{+yyyy.MM}"
      when.contains:
        tags: "db_access"

    - index: "docker-db-error-%{[beat.version]}-%{+yyyy.MM}"
      when.contains:
        tags: "db_err"

setup.template.name: "docker"
setup.template.pattern: "docker-*"
setup.template.enabled: false
setup.template.overwrite: true
EOF

8.重启filebeat
systemctl restart filebeat

9.访问并测试
curl 127.0.0.1/oldboy
curl 127.0.0.1:8080/oldboy
cat /opt/nginx/access.log
cat /opt/mysql/access.log
es-head查看
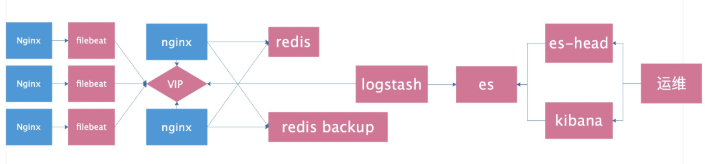
第二种方案

使用缓存服务来缓解ES压力
架构图
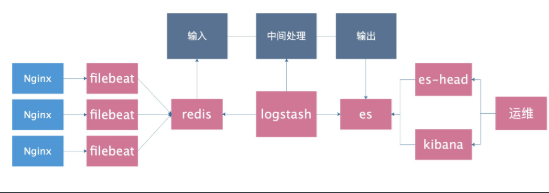
引入redis缓存

1.安装redis
yum install redis
sed -i 's#^bind 127.0.0.1#bind 127.0.0.1 10.0.0.51#' /etc/redis.conf
systemctl start redis
netstat -lntup|grep redis
redis-cli -h 10.0.0.51

2.停止docker容器
docker stop $(docker ps -q)

3.停止filebeat
systemctl stop filebeat

4.删除旧的ES索引

5.确认nginx日志为json格式
grep "access_log" nginx.conf

6.修改filebeat配置文件
cat >/etc/filebeat/filebeat.yml <<EOF
filebeat.inputs:
- type: log
  enabled: true
  paths:
    - /var/log/nginx/access.log
  json.keys_under_root: true
  json.overwrite_keys: true
  tags: ["access"]

- type: log
  enabled: true
  paths:
    - /var/log/nginx/error.log
  tags: ["error"]

output.redis:
  hosts: ["10.0.0.51"]
  keys:
    - key: "nginx_access"
      when.contains:
        tags: "access"
    - key: "nginx_error"
      when.contains:
        tags: "error"

setup.template.name: "nginx"
setup.template.pattern: "nginx_*"
setup.template.enabled: false
setup.template.overwrite: true
EOF

7.重启filebaet和nginx
systemctl restart nginx
systemctl restart filebeat

8.生成测试数据
curl 127.0.0.1/haha

9.检查
redis-cli -h 10.0.0.51
keys *
TYPE nginx_access
LLEN nginx_access
LRANGE nginx_access 0 -1
确认是否为json格式

10.安装logstash
rpm -ivh jdk-8u102-linux-x64.rpm
rpm -ivh logstash-6.6.0.rpm


11.配置logstash
cat >/etc/logstash/conf.d/redis.conf<<EOF
input {
  redis {
    host => "10.0.0.51"
    port => "6379"
    db => "0"
    key => "nginx_access"
    data_type => "list"
  }
  redis {
    host => "10.0.0.51"
    port => "6379"
    db => "0"
    key => "nginx_error"
    data_type => "list"
  }
}

filter {
  mutate {
    convert => ["upstream_time", "float"]
    convert => ["request_time", "float"]
  }
}

output {
   stdout {}
   if "access" in [tags] {
      elasticsearch {
        hosts => "http://10.0.0.51:9200"
        manage_template => false
        index => "nginx_access-%{+yyyy.MM}"
      }
    }
    if "error" in [tags] {
      elasticsearch {
        hosts => "http://10.0.0.51:9200"
        manage_template => false
        index => "nginx_error-%{+yyyy.MM}"
      }
    }
}
EOF

12.前台启动测试
/usr/share/logstash/bin/logstash -f /etc/logstash/conf.d/redis.conf

13.检查
logstash输出的内容有没有解析成json
es-head上有没有索引生成
redis里的列表数据有没有在减少

14.将logstash放在后台运行
ctrl+c
systemctl start logstash
听风扇声音,开始转的时候表示logstash启动了
filebeat引入redis完善方案
filebeat引入redis完善方案

1.前提条件
- filebeat不支持传输给redis哨兵或集群
- logstash也不支持从redis哨兵或集群里读取数据

2.安装配置redis
yum install redis -y
sed -i 's#^bind 127.0.0.1#bind 127.0.0.1 10.0.0.51#' /etc/redis.conf
systemctl start redis

3.安装配置nginx
配置官方源
yum install nginx -y
放在nginx.conf最后一行的}后面,不要放在conf.d里面
stream {
  upstream redis {
      server 10.0.0.51:6379 max_fails=2 fail_timeout=10s;
      server 10.0.0.52:6379 max_fails=2 fail_timeout=10s backup;
  }

  server {
          listen 6380;
          proxy_connect_timeout 1s;
          proxy_timeout 3s;
          proxy_pass redis;
  }
}
nginx -t
systemctl start nginx

4.安装配置keepalived
yum install keepalived -y
db01的配置
global_defs {
    router_id db01
}
vrrp_instance VI_1 {
    state MASTER
        interface eth0
        virtual_router_id 50
        priority 150
        advert_int 1
        authentication {
            auth_type PASS
            auth_pass 1111
        }
        virtual_ipaddress {
            10.0.0.100
        }
}

db02的配置
global_defs {
    router_id db02
}
vrrp_instance VI_1 {
    state BACKUP
    interface eth0
    virtual_router_id 50
    priority 100
    advert_int 1
    authentication {
        auth_type PASS
        auth_pass 1111
    }
    virtual_ipaddress {
        10.0.0.100
    }
}

systemctl start keepalived
ip a

5.测试访问能否代理到redis
redis-cli -h 10.0.0.100 -p 6380
把db01的redis停掉,测试还能不能连接redis

6.配置filebeat
cat >/etc/filebeat/filebeat.yml <<EOF
filebeat.inputs:
- type: log
  enabled: true
  paths:
    - /var/log/nginx/access.log
  json.keys_under_root: true
  json.overwrite_keys: true
  tags: ["access"]

- type: log
  enabled: true
  paths:
    - /var/log/nginx/error.log
  tags: ["error"]

output.redis:
  hosts: ["10.0.0.100:6380"]
  keys:
    - key: "nginx_access"
      when.contains:
        tags: "access"
    - key: "nginx_error"
      when.contains:
        tags: "error"

setup.template.name: "nginx"
setup.template.pattern: "nginx_*"
setup.template.enabled: false
setup.template.overwrite: true
EOF

7.测试访问filebeat能否传输到redis
curl 10.0.0.51/haha
redis-cli -h 10.0.0.51 #应该有数据
redis-cli -h 10.0.0.52 #应该没数据
redis-cli -h 10.0.0.100 -p 6380 #应该有数据

8.配置logstash
cat >/etc/logstash/conf.d/redis.conf<<EOF
input {
  redis {
    host => "10.0.0.100"
    port => "6380"
    db => "0"
    key => "nginx_access"
    data_type => "list"
  }
  redis {
    host => "10.0.0.100"
    port => "6380"
    db => "0"
    key => "nginx_error"
    data_type => "list"
  }
}

filter {
  mutate {
    convert => ["upstream_time", "float"]
    convert => ["request_time", "float"]
  }
}

output {
   stdout {}
   if "access" in [tags] {
      elasticsearch {
        hosts => "http://10.0.0.51:9200"
        manage_template => false
        index => "nginx_access-%{+yyyy.MM}"
      }
    }
    if "error" in [tags] {
      elasticsearch {
        hosts => "http://10.0.0.51:9200"
        manage_template => false
        index => "nginx_error-%{+yyyy.MM}"
      }
    }
}
EOF

9.启动测试
/usr/share/logstash/bin/logstash -f /etc/logstash/conf.d/redis.conf

10.最终测试
ab -n 10000 -c 100 10.0.0.100/
检查es-head上索引条目是否为10000条
关闭db01的redis,在访问,测试logstash正不正常
恢复db01的redis,再测试
filbeat引入redis优化方案
1.新增加一个日志路径需要修改4个地方:
- filebat 2个位置
- logstash 2个位置

2.优化之后需要修改的地方2个地方
- filebat 1个位置
- logstash 1个位置

3.filebeat配置文件
filebeat.inputs:
- type: log
  enabled: true
  paths:
    - /var/log/nginx/access.log
  json.keys_under_root: true
  json.overwrite_keys: true
  tags: ["access"]

- type: log
  enabled: true
  paths:
    - /var/log/nginx/error.log
  tags: ["error"]


output.redis:
  hosts: ["10.0.0.100:6380"]
  key: "nginx_log"

setup.template.name: "nginx"
setup.template.pattern: "nginx_*"
setup.template.enabled: false
setup.template.overwrite: true

4.优化后的logstash
input {
  redis {
    host => "10.0.0.100"
    port => "6380"
    db => "0"
    key => "nginx_log"
    data_type => "list"
  }
}

filter {
  mutate {
    convert => ["upstream_time", "float"]
    convert => ["request_time", "float"]
  }
}

output {
   stdout {}
   if "access" in [tags] {
      elasticsearch {
        hosts => "http://10.0.0.51:9200"
        manage_template => false
        index => "nginx_access-%{+yyyy.MM}"
      }
    }
    if "error" in [tags] {
      elasticsearch {
        hosts => "http://10.0.0.51:9200"
        manage_template => false
        index => "nginx_error-%{+yyyy.MM}"
      }
    }
}
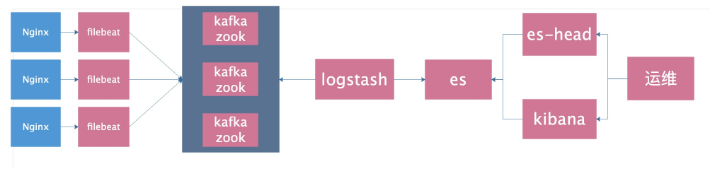
使用kafka作为缓存
1.配置hosts
10.0.0.51 kafka51
10.0.0.52 kafka52
10.0.0.53 kafka53
2.安装配置zookeeper
cd /data/soft/
tar zxf zookeeper-3.4.11.tar.gz -C /opt/
ln -s /opt/zookeeper-3.4.11/ /opt/zookeeper
mkdir -p /data/zookeeper
cp /opt/zookeeper/conf/zoo_sample.cfg /opt/zookeeper/conf/zoo.cfg
cat >/opt/zookeeper/conf/zoo.cfg<<EOF
tickTime=2000
initLimit=10
syncLimit=5
dataDir=/data/zookeeper
clientPort=2181
server.1=10.0.0.51:2888:3888
server.2=10.0.0.52:2888:3888
server.3=10.0.0.53:2888:3888
EOF
注意!ID每台机器不一样
echo "1" > /data/zookeeper/myid
cat /data/zookeeper/myid
3.启动zookeeper
所有节点都启动
/opt/zookeeper/bin/zkServer.sh start
4.每个节点都检查
/opt/zookeeper/bin/zkServer.sh status
5.测试zookeeper
在一个节点上执行,创建一个频道
/opt/zookeeper/bin/zkCli.sh -server 10.0.0.51:2181
create /test "hello"
在其他节点上看能否接收到
/opt/zookeeper/bin/zkCli.sh -server 10.0.0.52:2181
get /test

查看进程
ps -aux | grep 'zookeeper'
6.安装部署kafka
db01操作
cd /data/soft/
tar zxf kafka_2.11-1.0.0.tgz -C /opt/
ln -s /opt/kafka_2.11-1.0.0/ /opt/kafka
mkdir /opt/kafka/logs
cat >/opt/kafka/config/server.properties<<EOF
broker.id=1
listeners=PLAINTEXT://10.0.0.51:9092
num.network.threads=3
num.io.threads=8
socket.send.buffer.bytes=102400
socket.receive.buffer.bytes=102400
socket.request.max.bytes=104857600
log.dirs=/opt/kafka/logs
num.partitions=1
num.recovery.threads.per.data.dir=1
offsets.topic.replication.factor=1
transaction.state.log.replication.factor=1
transaction.state.log.min.isr=1
log.retention.hours=24
log.segment.bytes=1073741824
log.retention.check.interval.ms=300000
zookeeper.connect=10.0.0.51:2181,10.0.0.52:2181,10.0.0.53:2181
zookeeper.connection.timeout.ms=6000
group.initial.rebalance.delay.ms=0
EOF
db02操作
cd /data/soft/
tar zxf kafka_2.11-1.0.0.tgz -C /opt/
ln -s /opt/kafka_2.11-1.0.0/ /opt/kafka
mkdir /opt/kafka/logs
cat >/opt/kafka/config/server.properties<<EOF
broker.id=2
listeners=PLAINTEXT://10.0.0.52:9092
num.network.threads=3
num.io.threads=8
socket.send.buffer.bytes=102400
socket.receive.buffer.bytes=102400
socket.request.max.bytes=104857600
log.dirs=/opt/kafka/logs
num.partitions=1
num.recovery.threads.per.data.dir=1
offsets.topic.replication.factor=1
transaction.state.log.replication.factor=1
transaction.state.log.min.isr=1
log.retention.hours=24
log.segment.bytes=1073741824
log.retention.check.interval.ms=300000
zookeeper.connect=10.0.0.51:2181,10.0.0.52:2181,10.0.0.53:2181
zookeeper.connection.timeout.ms=6000
group.initial.rebalance.delay.ms=0
EOF
db03操作
cd /data/soft/
tar zxf kafka_2.11-1.0.0.tgz -C /opt/
ln -s /opt/kafka_2.11-1.0.0/ /opt/kafka
mkdir /opt/kafka/logs
cat >/opt/kafka/config/server.properties<<EOF
broker.id=3
listeners=PLAINTEXT://10.0.0.53:9092
num.network.threads=3
num.io.threads=8
socket.send.buffer.bytes=102400
socket.receive.buffer.bytes=102400
socket.request.max.bytes=104857600
log.dirs=/opt/kafka/logs
num.partitions=1
num.recovery.threads.per.data.dir=1
offsets.topic.replication.factor=1
transaction.state.log.replication.factor=1
transaction.state.log.min.isr=1
log.retention.hours=24
log.segment.bytes=1073741824
log.retention.check.interval.ms=300000
zookeeper.connect=10.0.0.51:2181,10.0.0.52:2181,10.0.0.53:2181
zookeeper.connection.timeout.ms=6000
group.initial.rebalance.delay.ms=0
EOF
7.前台启动测试
/opt/kafka/bin/kafka-server-start.sh  /opt/kafka/config/server.properties


看最后有没有start
8.验证进程
jps
出现3个进程
9.测试创建topic
/opt/kafka/bin/kafka-topics.sh --create --zookeeper 10.0.0.51:2181,10.0.0.52:2181,10.0.0.53:2181 --partitions 3 --replication-factor 3 --topic kafkatest
10.测试获取toppid
/opt/kafka/bin/kafka-topics.sh --describe --zookeeper 10.0.0.51:2181,10.0.0.52:2181,10.0.0.53:2181 --topic kafkatest
11.测试删除topic
/opt/kafka/bin/kafka-topics.sh --delete --zookeeper 10.0.0.51:2181,10.0.0.52:2181,10.0.0.53:2181 --topic kafkatest
12.kafka测试命令发送消息
创建命令
/opt/kafka/bin/kafka-topics.sh --create --zookeeper 10.0.0.51:2181,10.0.0.52:2181,10.0.0.53:2181 --partitions 3 --replication-factor 3 --topic messagetest
测试发送消息
/opt/kafka/bin/kafka-console-producer.sh --broker-list  10.0.0.51:9092,10.0.0.52:9092,10.0.0.53:9092 --topic  messagetest

出现尖角号
其他节点测试接收
/opt/kafka/bin/kafka-console-consumer.sh --zookeeper 10.0.0.51:2181,10.0.0.52:2181,10.0.0.53:2181 --topic messagetest --from-beginning
测试获取所有的频道
/opt/kafka/bin/kafka-topics.sh --list --zookeeper 10.0.0.51:2181,10.0.0.52:2181,10.0.0.53:2181
13.测试成功之后,可以放在后台启动
/opt/kafka/bin/kafka-server-start.sh -daemon /opt/kafka/config/server.properties
14.修改filebeat配置文件
cat >/etc/filebeat/filebeat.yml <<EOF
filebeat.inputs:
- type: log
  enabled: true
  paths:
    - /var/log/nginx/access.log
  json.keys_under_root: true
  json.overwrite_keys: true
  tags: ["access"]

- type: log
  enabled: true
  paths:
    - /var/log/nginx/error.log
  tags: ["error"]

output.kafka:
  hosts: ["10.0.0.51:9092", "10.0.0.52:9092", "10.0.0.53:9092"]
  topic: 'filebeat'

setup.template.name: "nginx"
setup.template.pattern: "nginx_*"
setup.template.enabled: false
setup.template.overwrite: true
EOF

重启filebeat
systemctl restart filebeat

11.访问并检查kafka里有没有收到日志
curl 10.0.0.51

/opt/kafka/bin/kafka-topics.sh  --list --zookeeper 10.0.0.51:2181,10.0.0.52:2181,10.0.0.53:2181

/opt/kafka/bin/kafka-console-consumer.sh --zookeeper 10.0.0.51:2181,10.0.0.52:2181,10.0.0.53:2181 --topic filebeat --from-beginning
15.修改logstash配置文件
cat >/etc/logstash/conf.d/kafka.conf <<EOF
input {
  kafka{
    bootstrap_servers=>["10.0.0.51:9092,10.0.0.52:9092,10.0.0.53:9092"]
    topics=>["filebeat"]
    #group_id=>"logstash"
    codec => "json"
  }
}

filter {
  mutate {
    convert => ["upstream_time", "float"]
    convert => ["request_time", "float"]
  }
}

output {
   stdout {}
   if "access" in [tags] {
      elasticsearch {
        hosts => "http://10.0.0.51:9200"
        manage_template => false
        index => "nginx_access-%{+yyyy.MM}"
      }
    }
    if "error" in [tags] {
      elasticsearch {
        hosts => "http://10.0.0.51:9200"
        manage_template => false
        index => "nginx_error-%{+yyyy.MM}"
      }
    }
}
EOF
16.启动logstash并测试
1.前台启动
/usr/share/logstash/bin/logstash -f /etc/logstash/conf.d/kafka.conf
2.后台启动
systemctl start logstash
17.logstash移除不需要的字段
在filter区块里添加remove_field字段即可
filter {
  mutate {
    convert => ["upstream_time", "float"]
    convert => ["request_time", "float"]
    remove_field => [ "beat" ]
  }
}
kafka与zookeeper 的关系
zookeeper中存储的信息有broker,consumer等重要znode信息。

可以感知到,每个kafka节点会在zookeeper中注册该机器的配置信息。

然后注册完的kafka节点的topic信息会存在topics目录下面。


根据zookeeper目录列表可以看到,zookeeper存储了kafka集群的所有信息,那么发送和接收消息是怎样的流程呢?


 kafka的发送与接收

发送:kafka的发送程序(代码)会指定broker服务地址,那么消息的发送会直接发送到broker提供的地址中。

如果地址是列表(指定了多个broker地址),那么则随机选择一个可用的发送。接收到消息的kafka机器会向zookeeper查询拥有该topic下partition决定权(leader)的机器,然后由该leader选择机器存储数据,最终存储数据。
接收:kafka的接收会指定zookeeper地址,那么接收到消费任务的zookeeper将任务报告给该topic下partition的leader,由该leader指定follower完成数据的获取并返回。

Zookeeper上的细节:

1. 每个broker启动后会在zookeeper上注册一个临时的broker registry,包含broker的ip地址和端口号,所存储的topics和partitions信息。

2. 每个consumer启动后会在zookeeper上注册一个临时的consumer registry:包含consumer所属的consumer group以及订阅的topics。

3. 每个consumer group关联一个临时的owner registry和一个持久的offset registry。

对于被订阅的每个partition包含一个owner registry,内容为订阅这个partition的consumer id。

同时包含一个offset registry,内容为上一次订阅的offset。
如何在公司推广ELK
- 优先表达对别人的好处,可以让别人早下班
- 实验环境准备充足,可以随时打开演示,数据和画图丰富一些
- 开发组,后端组,前端组,运维组,DBA组 单独定制面板
- 单独找组长,说优先给咱们组解决问题
- 你看,你有问题还得这么麻烦跑过来,我给你调好之后,你直接点点鼠标就可以了,如果还有问题,您一句话,我过去