代码:
yiqing.py
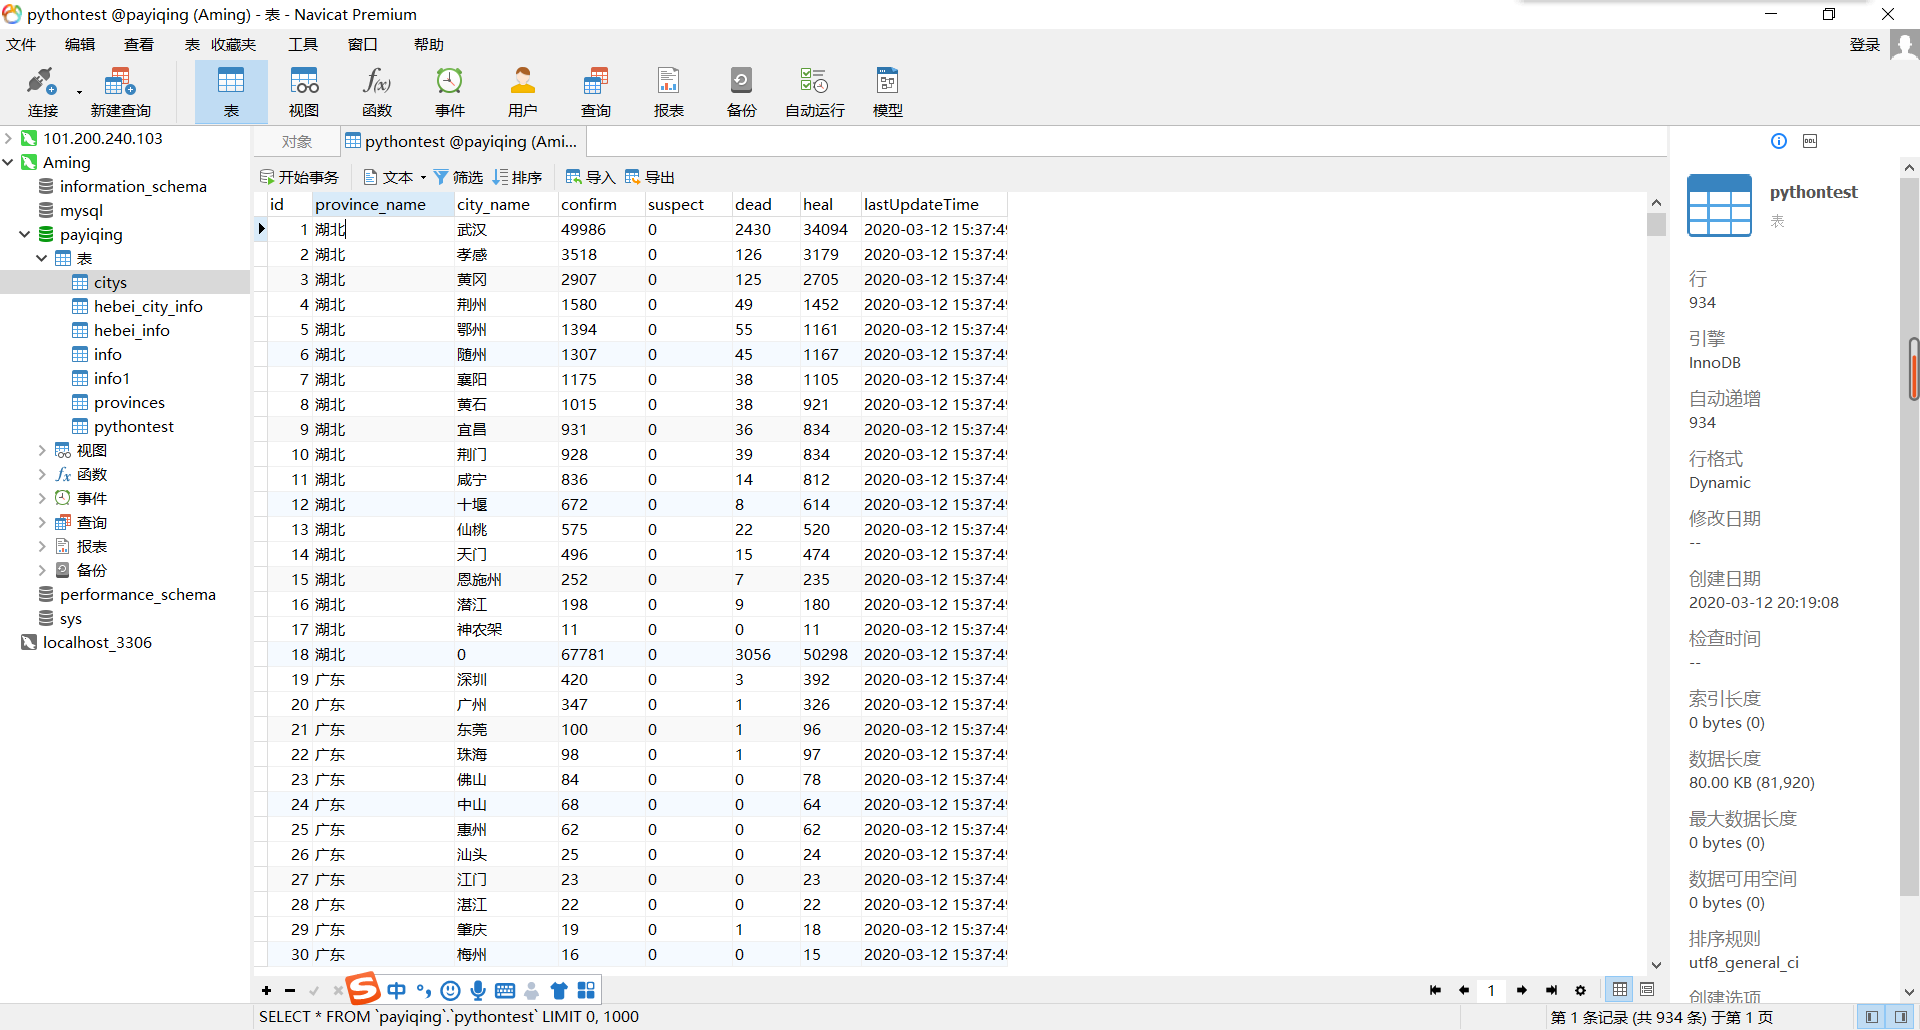
import requests
import json
from pymysql import *
import requests
from retry import retry

headers = {
    "User-Agent": "Mozilla/5.0 (Linux; Android 6.0; Nexus 5 Build/MRA58N) AppleWebKit/537.36 (KHTML, like Gecko) Chrome/80.0.3987.132 Mobile Safari/537.36"
    , "Referer": "https://wp.m.163.com/163/page/news/virus_report/index.html?_nw_=1&_anw_=1"}


def _parse_url(url):
    response = requests.get(url, headers=headers, timeout=3)  # 3秒之后返回
    return response.content.decode()


def parse_url(url):
    try:
        html_str = _parse_url(url)
    except:
        html_str = None
    return html_str


class yiqing:
    url = "https://c.m.163.com/ug/api/wuhan/app/data/list-total?t=316765429316"

    def getContent_list(self, html_str):
        dict_data = json.loads(html_str)
        # 各省的数据
        content_list = dict_data["data"]

        return content_list

    def saveContent_list(self, i):
        # 打开数据库连接(ip/数据库用户名/登录密码/数据库名)
        con = connect("localhost", "root", "0608", "payiqing")
        # 使用 cursor() 方法创建一个游标对象 cursor
        cursors = con.cursor()
        # 使用 execute()  方法执行 SQL 查询 返回的是你影响的行数

        row = cursors.execute("insert into provinces values(%s,%s,%s,%s,%s,%s,%s,%s)",
                              (i.get('id'), i.get('name'), i.get('total').get('confirm'),
                               i.get('total').get('suspect'), i.get('total').get('heal'),
                               i.get('total').get('dead'), i.get('total').get('severe'),
                               i.get('lastUpdateTime')))
        for j in i.get('children'):
            row = cursors.execute("insert into citys values(%s,%s,%s,%s,%s,%s,%s,%s)",
                                  (j.get('id'), j.get('name'), j.get('total').get('confirm'),
                                   j.get('total').get('suspect'), j.get('total').get('heal'),
                                   j.get('total').get('dead'), j.get('total').get('severe'),
                                   j.get('lastUpdateTime')))
        con.commit()  # 提交事务
        con.close()  # 关闭数据库连接

    def run(self):  # 实现主要逻辑
        # 请求数据
        html_str = parse_url(self.url)
        # 获取数据
        content_list = self.getContent_list(html_str)
        values = content_list["areaTree"][0]["children"]
        for i in values:
            self.saveContent_list(i)


if __name__ == '__main__':
    yq = yiqing()
    yq.run()
    print('爬取,存储成功!!')
yiqing.jsp
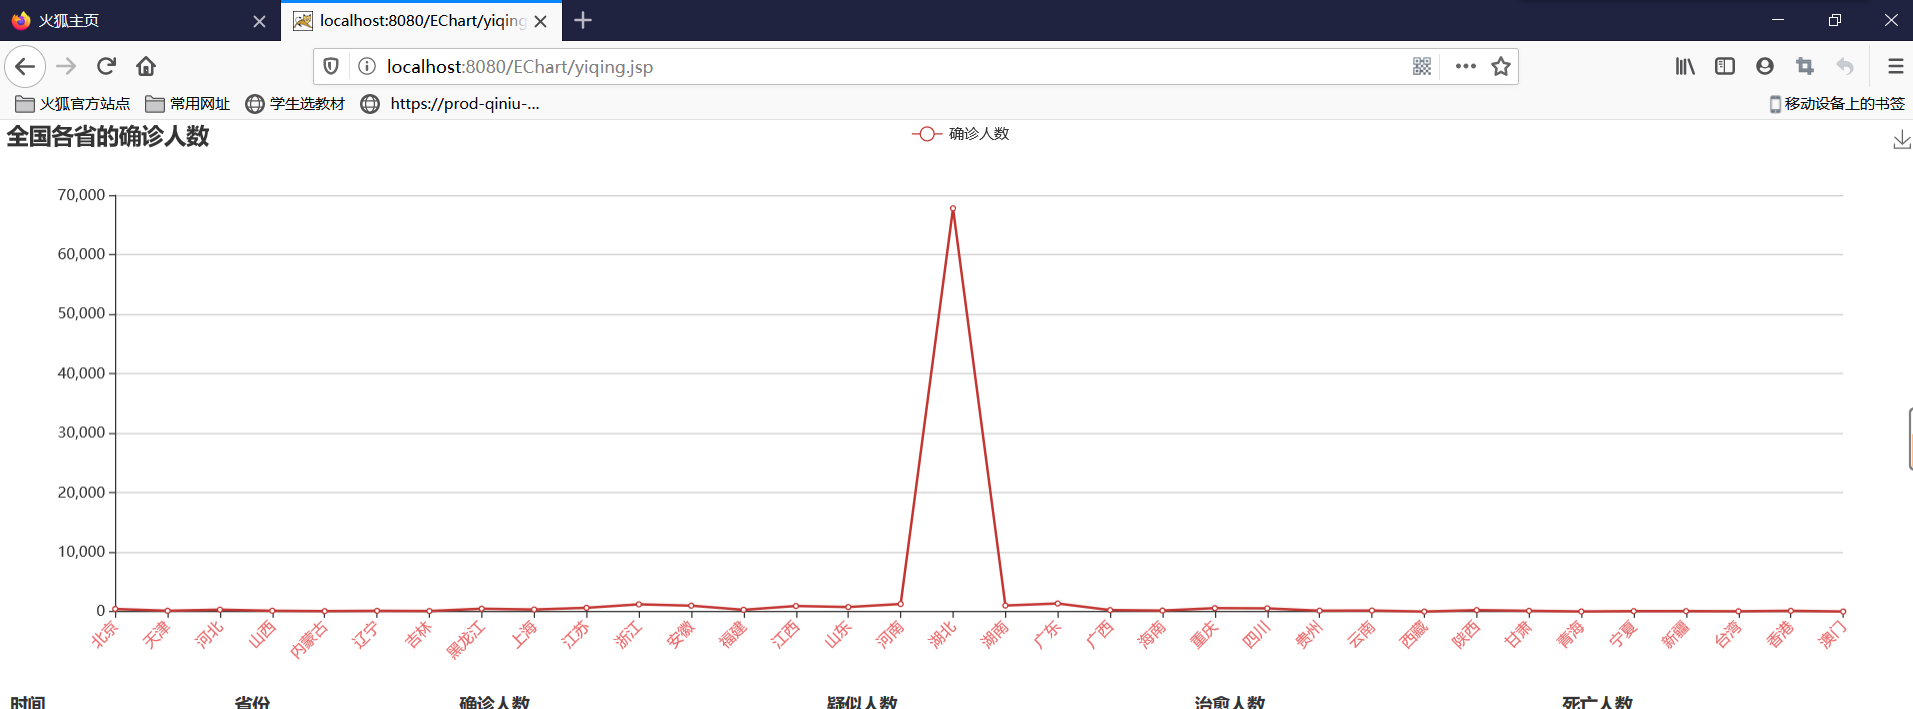
<%@ page language="java" contentType="text/html; charset=UTF-8"
    pageEncoding="UTF-8"%>
<%@ taglib uri="http://java.sun.com/jsp/jstl/core" prefix="c"%>

<!DOCTYPE html>
<html>
<head>
<meta charset="utf-8">
<!-- 引入 ECharts 文件 -->
<link rel="stylesheet" href="css/bootstrap.min.css" type="text/css" />
<script src="js/jquery-1.11.3.min.js" type="text/javascript"></script>
<script src="js/bootstrap.min.js" type="text/javascript"></script>
<script src="js/echarts.js"></script>
<script src="js/jquery-1.11.3.min.js" type="text/javascript"></script>
</head>
<body>
    <!-- 为 ECharts 准备一个具备大小(宽高)的Dom -->
    <div id="main" style=" 100%; height: 450px;"></div>
    <table class="table table-striped">
        <thead>
            <tr>
                <th >时间</th>
                <th >省份</th>
                <th >确诊人数</th>
                <th >疑似人数</th>
                <th >治愈人数</th>
                <th>死亡人数</th>
            </tr>
        </thead>
        <tbody>
            <c:forEach items="${list}" var="item">
                <tr>
                    <td >${item.lastUpdateTime}</td>
                    <td >${item.name}</td>
                    <td >${item.confirm}</td>
                    <td >${item.suspect}</td>
                    <td >${item.heal}</td>
                    <td >${item.dead}</td>
                </tr>
            </c:forEach>
        </tbody>
    </table>
</body>
<script type="text/javascript">
    var dt;
    $(function(){
        $.ajax({
            url : "info?method=yiqing",
            async : false,
            type : "POST",
            success : function(data) {
                dt = data;
                //alert(dt[0].name);
            },
            error : function() {
                alert("请求失败");
            },
            dataType : "json"
        });

        var myChart = echarts.init(document.getElementById('main'));
        alert(dt);
        var xd = new Array(0)//长度为33
        var yd = new Array(0)//长度为33
        for (var i = 0; i < 34; i++) {
            xd.push(dt[i].name);
            yd.push(dt[i].confirm);
        }
        alert(xd);
        alert(yd);
        // 指定图表的配置项和数据
        var option = {
            title : {
                text : '全国各省的确诊人数'
            },
            tooltip : {
                trigger : 'axis'
            },
            legend : {
                data : [ '确诊人数' ]
            },
            grid : {
                left : '3%',
                right : '4%',
                bottom : '3%',
                containLabel : true
            },
            toolbox : {
                feature : {
                    saveAsImage : {}
                }
            },
            xAxis : {
                type : 'category',
                boundaryGap : false,
                axisLabel : {
                    //横坐标上的文字斜着显示 文字颜色 begin
                    interval : 0,
                    rotate : 45,
                    margin : 10,
                    textStyle : {
                        color : "#ec6869"
                    }
                //横坐标上的文字换行显示 文字颜色end
                },
                data : xd
            },
            yAxis : {
                type : 'value'
            },
            series : [ {
                name : '确诊人数',
                type : 'line',
                stack : '总量',
                data : yd
            } ]
        };

        // 使用刚指定的配置项和数据显示图表。
        myChart.setOption(option);
    });
</script>
</html>
截图: