介绍
在linux上跑程序时,常常遇到程序卡顿,内存消耗大,这时候,我们需要使用free查看内存使用情况及top内存消耗排行,当然,我们还可以继续使用一些其他的JVM监控命令如jstat等命令进行java程序的性能评估。
free命令
free命令介绍
free命令是显示系统内存的使用情况,一般包括了物理内存、交换内存以及内核缓冲区内存。
free命令使用
[linux@001]$ free --help

Usage:
 free [options]

Options:
 -b, --bytes         show output in bytes
 -k, --kilo          show output in kilobytes
 -m, --mega          show output in megabytes
 -g, --giga          show output in gigabytes
     --tera          show output in terabytes
 -h, --human         show human-readable output
     --si            use powers of 1000 not 1024
 -l, --lohi          show detailed low and high memory statistics
 -t, --total         show total for RAM + swap
 -s N, --seconds N   repeat printing every N seconds
 -c N, --count N     repeat printing N times, then exit
 -w, --wide          wide output

     --help     display this help and exit
 -V, --version  output version information and exit
free命令示例
[linux@001]$ free -b
              total        used        free      shared  buff/cache   available
Mem:    16657858560  9096298496  5962731520    42442752  1598828544  7198982144
Swap:             0           0           0
[linux@001]$ free -k
              total        used        free      shared  buff/cache   available
Mem:       16267440     8884816     5821264       41448     1561360     7028544
Swap:             0           0           0
[linux@001]$ free -m
              total        used        free      shared  buff/cache   available
Mem:          15886        8757        5612          40        1516        6782
Swap:             0           0           0
[linux@001]$ free -g
              total        used        free      shared  buff/cache   available
Mem:             15           8           5           0           1           6
Swap:             0           0           0
[linux@001]$ free -h
              total        used        free      shared  buff/cache   available
Mem:            15G        8.6G        5.5G         40M        1.5G        6.6G
Swap:            0B          0B          0B
[linux@001]$ free -l -h
              total        used        free      shared  buff/cache   available
Mem:            15G        8.5G        5.6G         40M        1.5G        6.7G
Low:            15G          9G        5.6G
High:            0B          0B          0B
Swap:            0B          0B          0B
[linux@001]$ free -t -h
              total        used        free      shared  buff/cache   available
Mem:            15G        8.5G        5.6G         40M        1.5G        6.7G
Swap:            0B          0B          0B
Total:          15G        8.5G        5.6G
[linux@001]$ free -s 10
              total        used        free      shared  buff/cache   available
Mem:       16267440     8910116     5798884       41448     1558440     7003268
Swap:             0           0           0

              total        used        free      shared  buff/cache   available
Mem:       16267440     8912052     5796892       41448     1558496     7001336
Swap:             0           0           0
free命令的参数说明
Mem:内存的使用情况。Swap:交换空间的使用情况,是磁盘的一块区域,可以是swap分区也可以是swap文件,当系统物理内存使用比较紧张时,Linux会将内存中不常被访问的数据保存到Swap中,若需要访问该内容,会加载到内存中,即换出和换入的意思。total:物理内存总数。used:已使用内存大小。free:可使用内存大小,即未被真正使用过的物理内存大小。shared:多个进程可共享内存大小。buff/cache:磁盘缓存大小。available:可提供的内存大小,区别于free列,如果没有足够的free内存可用,会从buffer/cache回收内存来满足应用程序的需求,所以available=free+buffer+cache。
top命令
top命令介绍
top命令是用于监控Linux系统状况,可以通过该命令实时查看系统各个进程的资源占用状况。相当于Windows系统的任务管理器。
top命令使用
[linux@001]$ top -help
  procps-ng version 3.3.10
Usage:
  top -hv | -bcHiOSs -d secs -n max -u|U user -p pid(s) -o field -w [cols]
使用格式:
top [-] [d] [p] [q] [c] [b] [S] [s] [n]
d:指定两次频幕刷新频率,即时间间隔。如top -d 4,指定更新周期为4秒。p:指定监控进程id来监控某个进程状态。如top -p 1201,显示进程号为1201的进程信息、cpu、内存占用等信息。q:无延时刷新,若有超级用户权限,则top会以高优先级运行。c:显示整个命令行。如top -c,显示每个进程的完整命令。S:指定累计模式。如top -S,以累计模式显示程序信息。s:使top命令在安全模式中运行。如top -s,不能交互使用s键位,会报unavailable in secure mode提示。n:指定更新的次数。如top -n 2只更新2次,就退出top程序。b:批处理模式显示程序信息。如top -b,以批处理模式显示程序信息。
top界面程序交互常用按键说明:
- 按
c键位:切换显示命令名称和完整的命令行。 - 按
P键位:根据CPU使用百分比大小进行排序。 - 按
M键位:根据内存mem占有率大小进行排序。 - 按
n键位:设置在进程列表中显示进程的数量。 - 按
T键位:根据时间/累计时间进行排序。 - 按
s键位:改变画面更新频率,输入两次刷新之间的延迟时间,以秒为单位。 - 按
S键位:切换到累计模式;开关。 - 按
i键位:忽略闲置和僵尸进程;开关。 - 按
h键位:显示帮助画面。
10.按u键位:输入指定的user,就会显示所有该user的程序进程。 - 按
q键位:退出top查看程序。 - 按
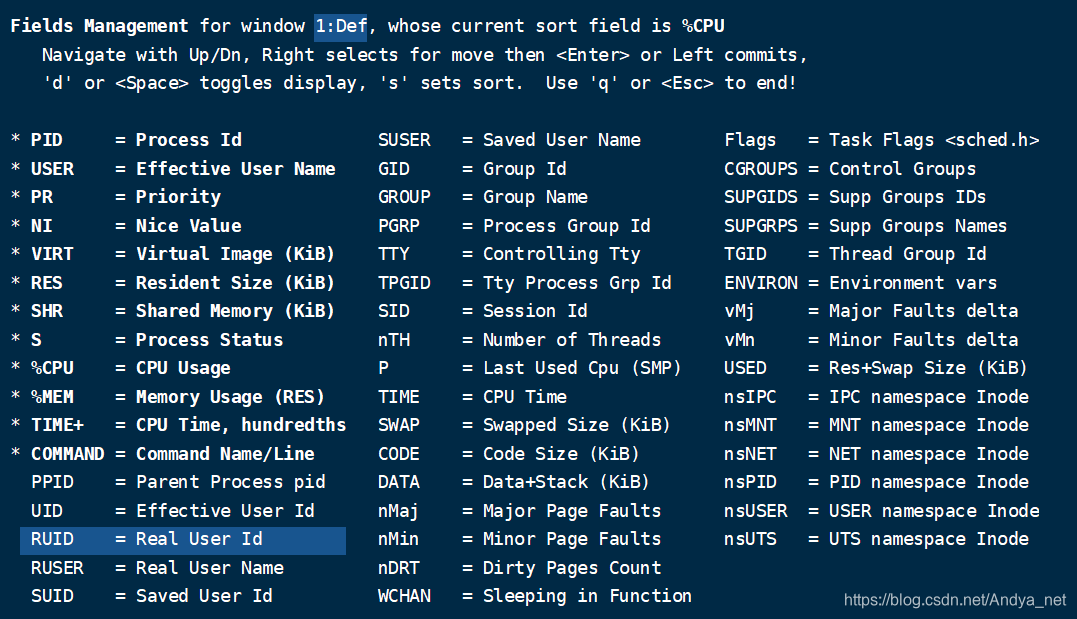
f键位:编排视图显示字段。
top命令示例
top - 09:48:58 up 27 days, 23:42,  6 users,  load average: 0.10, 0.27, 0.37
Tasks: 163 total,   1 running, 160 sleeping,   2 stopped,   0 zombie
%Cpu(s):  0.6 us,  1.2 sy,  0.0 ni, 98.1 id,  0.1 wa,  0.0 hi,  0.0 si,  0.0 st
KiB Mem : 16267440 total,  6819976 free,  8980392 used,   467072 buff/cache
KiB Swap:        0 total,        0 free,        0 used.  6944052 avail Mem

  PID USER      PR  NI    VIRT    RES    SHR S  %CPU %MEM     TIME+ COMMAND
 1926 root      20   0 1020672   3584      0 S   0.3  0.0  71:41.44 vmsec-linux
 2501 bdoc      20   0 8421520 569828   3876 S   0.3  3.5  26:53.14 java
 7899 root      20   0  148656   6044   4368 S   0.3  0.0   0:13.34 sshd
12912 root      20   0       0      0      0 S   0.3  0.0   3:03.64 kworker/0:2
31032 root      20   0       0      0      0 S   0.3  0.0   0:43.88 kworker/4:2
    1 root      20   0  191196   3132   1428 S   0.0  0.0   0:33.66 systemd
    2 root      20   0       0      0      0 S   0.0  0.0   0:00.38 kthreadd
    3 root      20   0       0      0      0 S   0.0  0.0   0:04.44 ksoftirqd/0
    5 root       0 -20       0      0      0 S   0.0  0.0   0:00.00 kworker/0:0H
    7 root      rt   0       0      0      0 S   0.0  0.0   0:43.99 migration/0
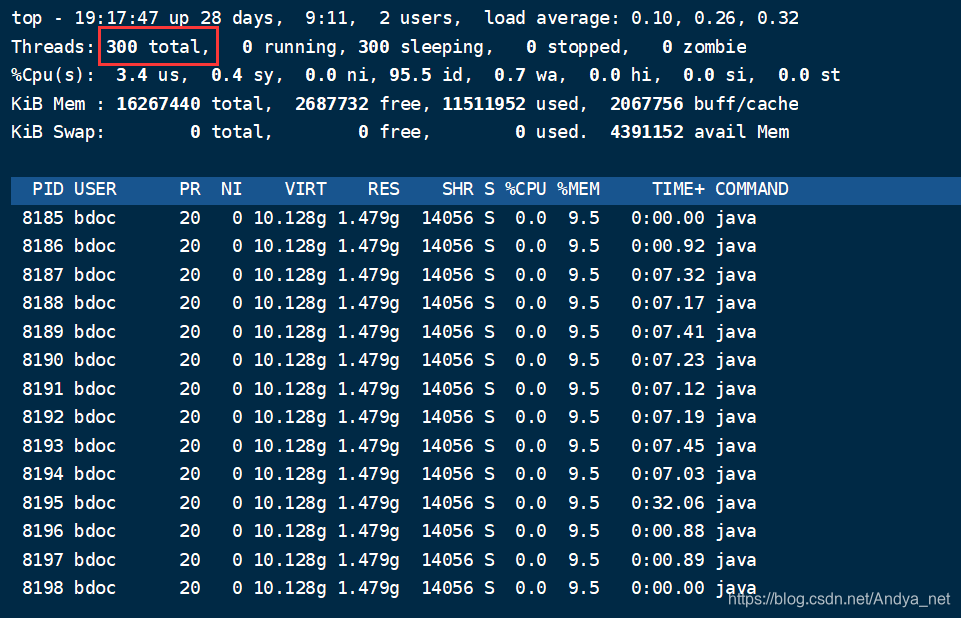
若按下1数字键,进行多核展示
top - 10:35:29 up 28 days, 29 min,  6 users,  load average: 0.09, 0.15, 0.25
Tasks: 159 total,   1 running, 156 sleeping,   2 stopped,   0 zombie
%Cpu0  :  1.3 us,  1.3 sy,  0.0 ni, 97.3 id,  0.0 wa,  0.0 hi,  0.0 si,  0.0 st
%Cpu1  :  0.7 us,  1.3 sy,  0.0 ni, 98.0 id,  0.0 wa,  0.0 hi,  0.0 si,  0.0 st
%Cpu2  :  1.0 us,  1.0 sy,  0.0 ni, 98.0 id,  0.0 wa,  0.0 hi,  0.0 si,  0.0 st
%Cpu3  :  0.7 us,  1.3 sy,  0.0 ni, 98.0 id,  0.0 wa,  0.0 hi,  0.0 si,  0.0 st
%Cpu4  :  0.7 us,  0.7 sy,  0.0 ni, 98.7 id,  0.0 wa,  0.0 hi,  0.0 si,  0.0 st
%Cpu5  :  0.7 us,  1.0 sy,  0.0 ni, 96.0 id,  2.3 wa,  0.0 hi,  0.0 si,  0.0 st
%Cpu6  :  1.0 us,  1.7 sy,  0.0 ni, 97.3 id,  0.0 wa,  0.0 hi,  0.0 si,  0.0 st
%Cpu7  :  1.0 us,  1.0 sy,  0.0 ni, 98.0 id,  0.0 wa,  0.0 hi,  0.0 si,  0.0 st
KiB Mem : 16267440 total,  6706632 free,  8955152 used,   605656 buff/cache
KiB Swap:        0 total,        0 free,        0 used.  6968016 avail Mem

  PID USER      PR  NI    VIRT    RES    SHR S  %CPU %MEM     TIME+ COMMAND
 7899 root      20   0  148656   6048   4368 S   0.7  0.0   0:24.99 sshd
 1926 root      20   0 1020672   3584      0 S   0.3  0.0  71:46.39 vmsec-linux
 2726 mysql     20   0 4795092 849484   4984 S   0.3  5.2   1835:23 mysqld
 4363 bdoc      20   0 8445056 1.898g  14052 S   0.3 12.2   1:53.14 java
 8185 bdoc      20   0 10.126g 1.471g  12908 S   0.3  9.5  35:39.03 java
 8520 root      20   0  158684   3028   1568 S   0.3  0.0   0:14.86 top
25718 bdoc      20   0  157708   2248   1568 R   0.3  0.0   0:00.17 top
top命令的参数说明
统计信息区的前5行是系统整体的系统信息。
1)第1行是任务队列信息,这个类似于uptime命令的执行结果:
[linux@001]$ uptime
 09:50:06 up 27 days, 23:43,  6 users,  load average: 1.13, 0.47, 0.43
2)第2、3行是进程和cpu的统计信息。
tasks:进程任务数:
total:表示进程总数;running:表示正在运行的进程数;sleeping:表示睡眠的进程数;stopped:表示停止的进程数;zombie:表示僵尸进程数;
%Cpu(s):cpu使用情况,多核展示也可以通过按1数字,就会变成%Cpu0,%Cpu1,%Cpu2... ...
us:user,time running un-niced user processes 用户空间占用cpu百分比;sy:system,time running kernel processes 内核空间占用cpu百分比;ni: nice , time running niced user processes 用户进程空间内改变过优先级的进程占用cpu百分比;id:idle, time idel processes 空闲cpu百分比;wa:IO-wait ,time waiting for I/O completion 等待输入输出cpu时间百分比;hi:hardware interrupts,time spent servicing hardware interrupts 硬件cpu中断占用百分比;si:software interrupts,time spent servicing software interrupts 软中断占用百分比;st:time stolen from this vm by the hypervisor虚拟机占用百分比;
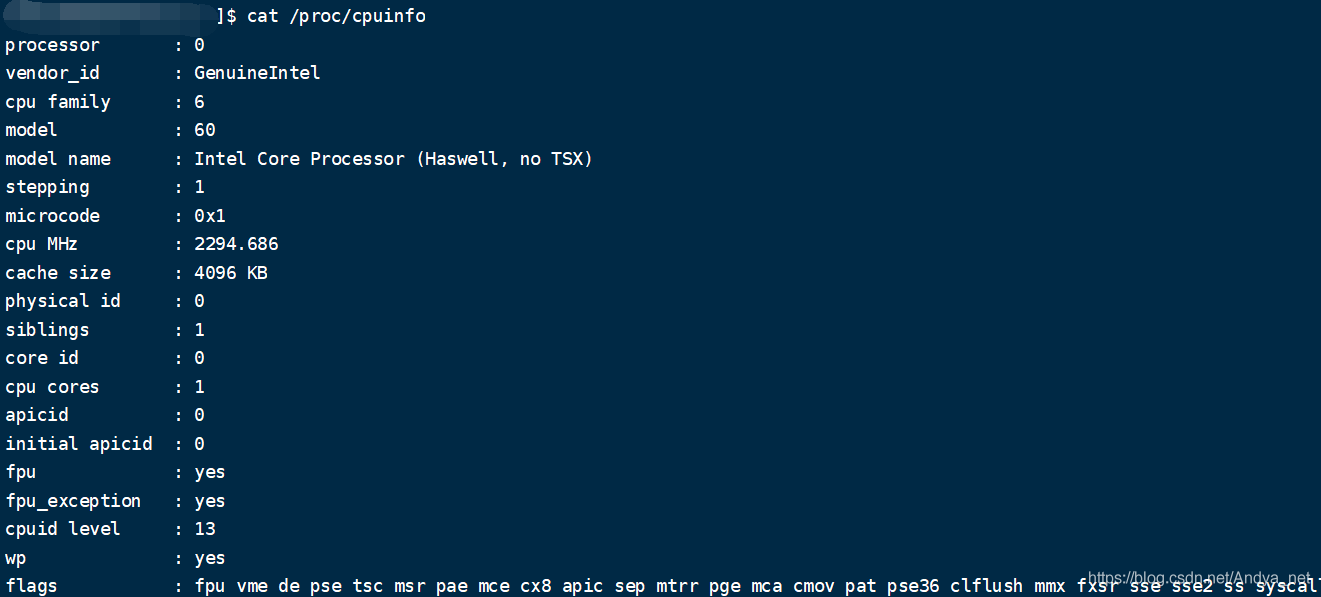
我们也可以通过cat /proc/cpuinfo查看cpu信息:
3)第5、6行是内存信息
Mem:物理内存total:物理内存总量。free:物理空闲内存量。used:物理已使用内存量。buff/cache:物理内核缓存内存量。
Swap:交换区total:交换区总量。free:交换区空闲量。used:交换区使用量。avail Mem:交换区可用量。
4)第7行是各进程的监控
PID:进程id。USER:进程所有者。PR:进程优先级。NI:nice值,负值表示高优先级,正值表示低优先级。VIRT:进程使用的虚拟内存总量,单位是kb,VIRT=SWAP+RES。RES:进程使用的、未被换出的物理内存大小,单位kb,RES=CODE+DATA。SHR:共享内存大小,单位kb。S:进程状态。D:不可终端的睡眠状态;R:运行状态;S:睡眠状态;T:跟踪/停止状态;Z:僵尸进程状态。%CPU:上次更新到现在的CPU时间占用百分比。%MEM:进程使用的物理内存百分比。TIME+:进程使用的CPU时间总长,单位1/100秒。COMMAND:进程命令名称/命令行。
jstat命令
jstat命令介绍
首先得明确一下JVM中的堆内存的概念,堆内存=年轻代+年老代+永久代+元数据,而年轻代=Eden区+两个Survivor区(From及To)
一般常用jstat -gc PID查看某个进程的堆内存使用情况。
jstat命令使用
使用语法格式
jstat -<option> [-t] [-h<lines>] <vmid> [<interval> [<count>]]
参数解释:
- option 常见的都是使用-gcutil查看gc情况。
- vmid : VM的进程号,即当前运行的java进程号。
- interval : 间隔时间,单位为秒或毫秒
- count:打印次数,如果缺省则打印无数次。
用的比较多的是:jstat -gc PID和jstat -gcutil PID
Option Displays...
-class: Statistics on the behavior of the class loader.-compiler: Statistics of the behavior of the HotSpot Just-in-Time compiler.-gc: Statistics of the behavior of the garbage collected heap.-gccapacity: Statistics of the capacities of the generations and their corresponding spaces.-gccause: Summary of garbage collection statistics (same as -gcutil), with the cause of the last and current (if applicable) garbage collection events.-gcnew: Statistics of the behavior of the new generation.-gcnewcapacity: Statistics of the sizes of the new generations and its corresponding spaces.-gcold: Statistics of the behavior of the old and permanent generations.-gcoldcapacity: Statistics of the sizes of the old generation.-gcpermcapacity: Statistics of the sizes of the permanent generation.-gcutil: Summary of garbage collection statistics.
printcompilation HotSpot compilation method statistics.
jstat命令示例
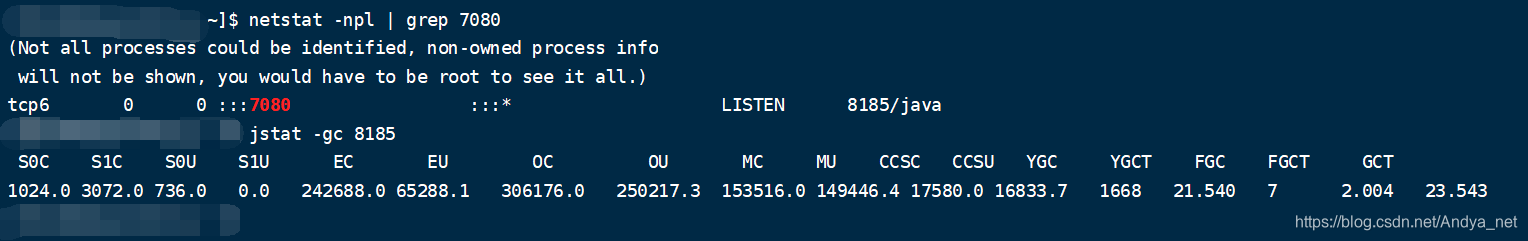
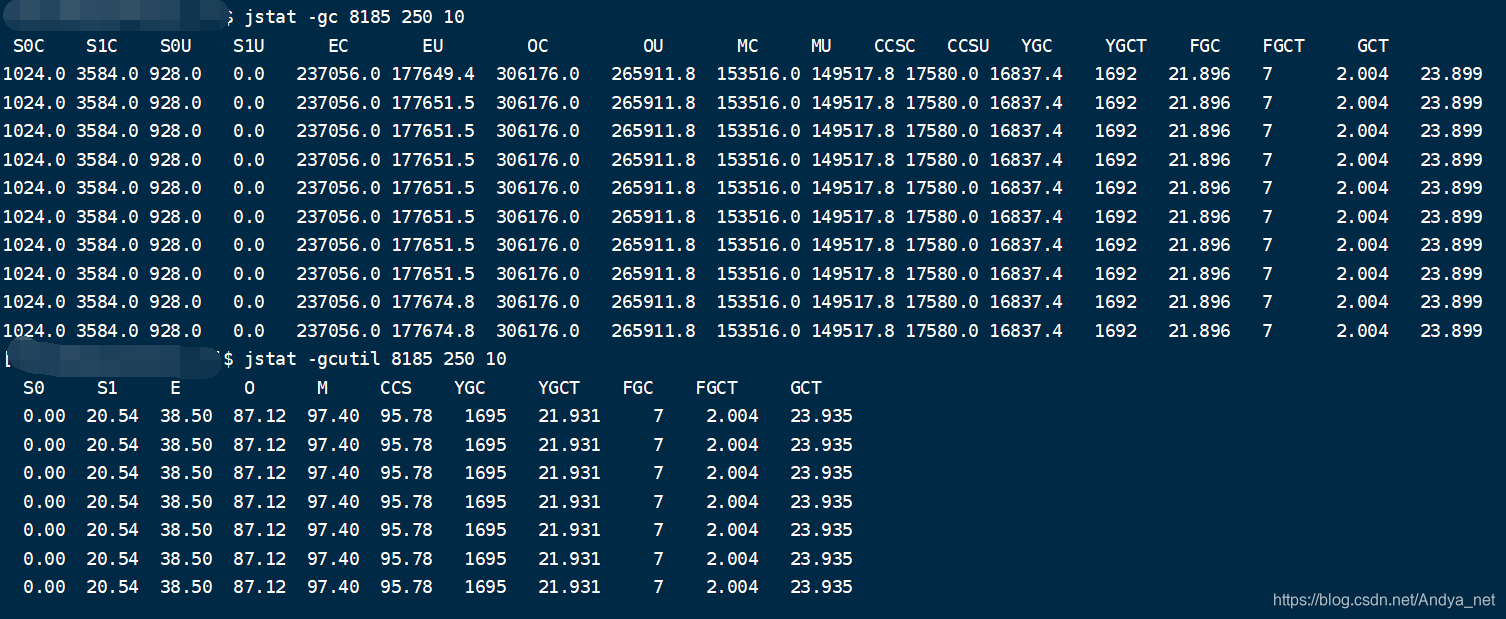
jstat -gc常用的参数说明
Column Description
S0C: Current survivor space 0 capacity (KB).S1C: Current survivor space 1 capacity (KB).S0U: Survivor space 0 utilization (KB).S1U: Survivor space 1 utilization (KB).EC: Current eden space capacity (KB).EU: Eden space utilization (KB).OC: Current old space capacity (KB).OU: Old space utilization (KB).PC: Current permanent space capacity (KB).PU: Permanent space utilization (KB).YGC: Number of young generation GC Events.YGCT: Young generation garbage collection time.FGC: Number of full GC events.常用FGCT: Full garbage collection time. 常用GCT: Total garbage collection time.常用
jmap命令
jmap命令介绍
jmap命令可以用于对堆进行立项分析,检查对象创建、数量及对象所占内存大小。一般使用jmap -heap PID用于打印堆使用情况。
jmap命令使用
jmap [ option ] pid:连接进程号
jmap [ option ] executable core:连接核心文件
jmap [ option ] [server-id@]remote-hostname-or-IP:连接远程debug服务的主机名或ip
[linux@001]$ jmap -h
Usage:
    jmap [option] <pid>
        (to connect to running process)
    jmap [option] <executable <core>
        (to connect to a core file)
    jmap [option] [server_id@]<remote server IP or hostname>
        (to connect to remote debug server)

where <option> is one of:
    <none>               to print same info as Solaris pmap
    -heap                to print java heap summary
    -histo[:live]        to print histogram of java object heap; if the "live"
                         suboption is specified, only count live objects
    -clstats             to print class loader statistics
    -finalizerinfo       to print information on objects awaiting finalization
    -dump:<dump-options> to dump java heap in hprof binary format
                         dump-options:
                           live         dump only live objects; if not specified,
                                        all objects in the heap are dumped.
                           format=b     binary format
                           file=<file>  dump heap to <file>
                         Example: jmap -dump:live,format=b,file=heap.bin <pid>
    -F                   force. Use with -dump:<dump-options> <pid> or -histo
                         to force a heap dump or histogram when <pid> does not
                         respond. The "live" suboption is not supported
                         in this mode.
    -h | -help           to print this help message
    -J<flag>             to pass <flag> directly to the runtime system
jmap命令示例
[linux@001]$ netstat -npl | grep 8889
(Not all processes could be identified, non-owned process info
 will not be shown, you would have to be root to see it all.)
tcp6       0      0 :::8889                 :::*                    LISTEN      7253/java
[linux@001]$ jmap -heap 7253
Attaching to process ID 7253, please wait...
Debugger attached successfully.
Server compiler detected.
JVM version is 25.65-b01

using thread-local object allocation.
Parallel GC with 8 thread(s)

Heap Configuration: #堆配置,即JVM参数配置
   MinHeapFreeRatio         = 0 #最小堆使用比例
   MaxHeapFreeRatio         = 100 #最大堆使用比例
   MaxHeapSize              = 4164943872 (3972.0MB) #最大堆空间大小
   NewSize                  = 87031808 (83.0MB) #新生代分配大小
   MaxNewSize               = 1388314624 (1324.0MB) #最大新生代可分配大小
   OldSize                  = 175112192 (167.0MB) #老年代大小
   NewRatio                 = 2 #新生代比例
   SurvivorRatio            = 8 #新生代和survivor比例
   MetaspaceSize            = 21807104 (20.796875MB) #元数据空间大小
   CompressedClassSpaceSize = 1073741824 (1024.0MB) #指针空间大小
   MaxMetaspaceSize         = 17592186044415 MB #MaxMetaspaceSize=Compressed Class Space Size + Metaspace area (excluding the Compressed Class Space) Size
   G1HeapRegionSize         = 0 (0.0MB) #G1中的region大小

Heap Usage:
PS Young Generation
Eden Space: #eden区
   capacity = 1342177280 (1280.0MB)
   used     = 970477176 (925.519157409668MB)
   free     = 371700104 (354.48084259033203MB)
   72.30618417263031% used
From Space: #from区,即survivor1区
   capacity = 23068672 (22.0MB)
   used     = 22904896 (21.84381103515625MB)
   free     = 163776 (0.15618896484375MB)
   99.29005015980114% used
To Space: #to区,即survivor2区
   capacity = 23068672 (22.0MB)
   used     = 0 (0.0MB)
   free     = 23068672 (22.0MB)
   0.0% used
PS Old Generation #老年代使用情况
   capacity = 176685056 (168.5MB)
   used     = 52151696 (49.73573303222656MB)
   free     = 124533360 (118.76426696777344MB)
   29.5167555087398% used

31742 interned Strings occupying 3385416 bytes.
其他
ps监控java线程数
ps -eLf | grep java | wc -l
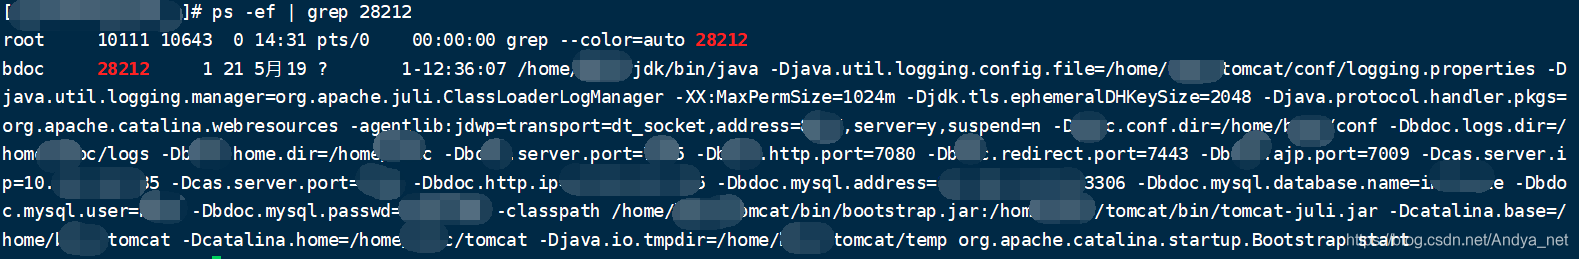
ps监控进程详情
ps -ef | grep PID
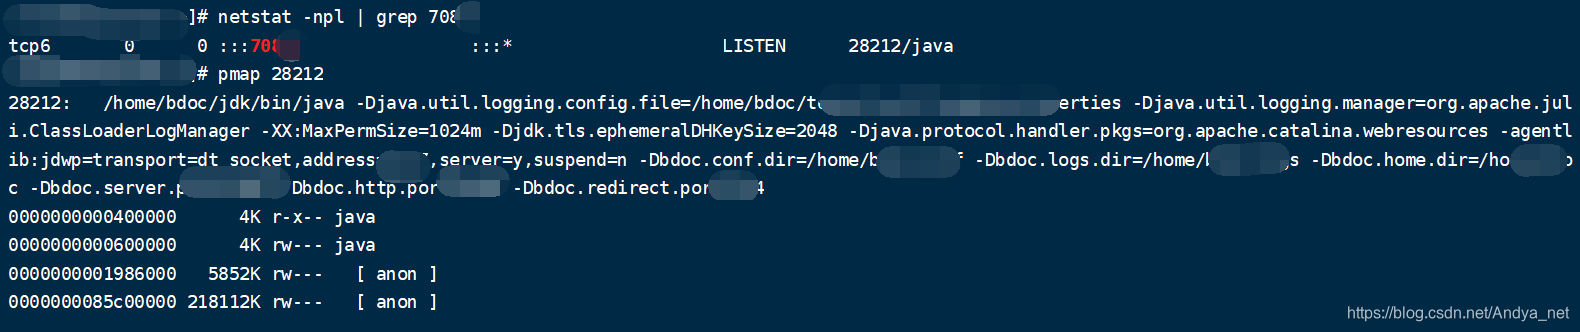
netstat监控网络tcp客户连接数
netstat -n | grep tcp | grep 程序端口号| wc -l
pmap分析线程堆栈
pmap PID
top查看进程线程
top -Hp PID