The k-means algorithm captures the insight that each point in a cluster should be near to the center of that cluster. It works like this: first we choose k, the number of clusters we want to find in the data. Then, the centers of those k clusters, called centroids, are initialized in some fashion, (discussed later).
#!/usr/bin/python

"""
    Skeleton code for k-means clustering mini-project.
"""

import pickle
import numpy
import matplotlib.pyplot as plt
import sys
sys.path.append("../tools/")
from feature_format import featureFormat, targetFeatureSplit
from sklearn.cluster import KMeans


def Draw(pred, features, poi, mark_poi=False, name="image.png", f1_name="feature 1", f2_name="feature 2"):
    """ some plotting code designed to help you visualize your clusters """

    ### plot each cluster with a different color--add more colors for
    ### drawing more than five clusters
    colors = ["b", "c", "k", "m", "g"]
    for ii, pp in enumerate(pred):
        plt.scatter(features[ii][0], features[ii][1], color = colors[pred[ii]])

    ### if you like, place red stars over points that are POIs (just for funsies)
    if mark_poi:
        for ii, pp in enumerate(pred):
            if poi[ii]:
                plt.scatter(features[ii][0], features[ii][1], color="r", marker="*")
    plt.xlabel(f1_name)
    plt.ylabel(f2_name)
    plt.savefig(name)
    plt.show()


### load in the dict of dicts containing all the data on each person in the dataset
data_dict = pickle.load( open("../final_project/final_project_dataset.pkl", "r") )
### there's an outlier--remove it!
data_dict.pop("TOTAL", 0)


### the input features we want to use
### can be any key in the person-level dictionary (salary, director_fees, etc.)
feature_1 = "salary"
feature_2 = "exercised_stock_options"
poi  = "poi"
features_list = [poi, feature_1, feature_2]
data = featureFormat(data_dict, features_list )
poi, finance_features = targetFeatureSplit( data )


### in the "clustering with 3 features" part of the mini-project,
### you'll want to change this line to
### for f1, f2, _ in finance_features:
### (as it's currently written, the line below assumes 2 features)
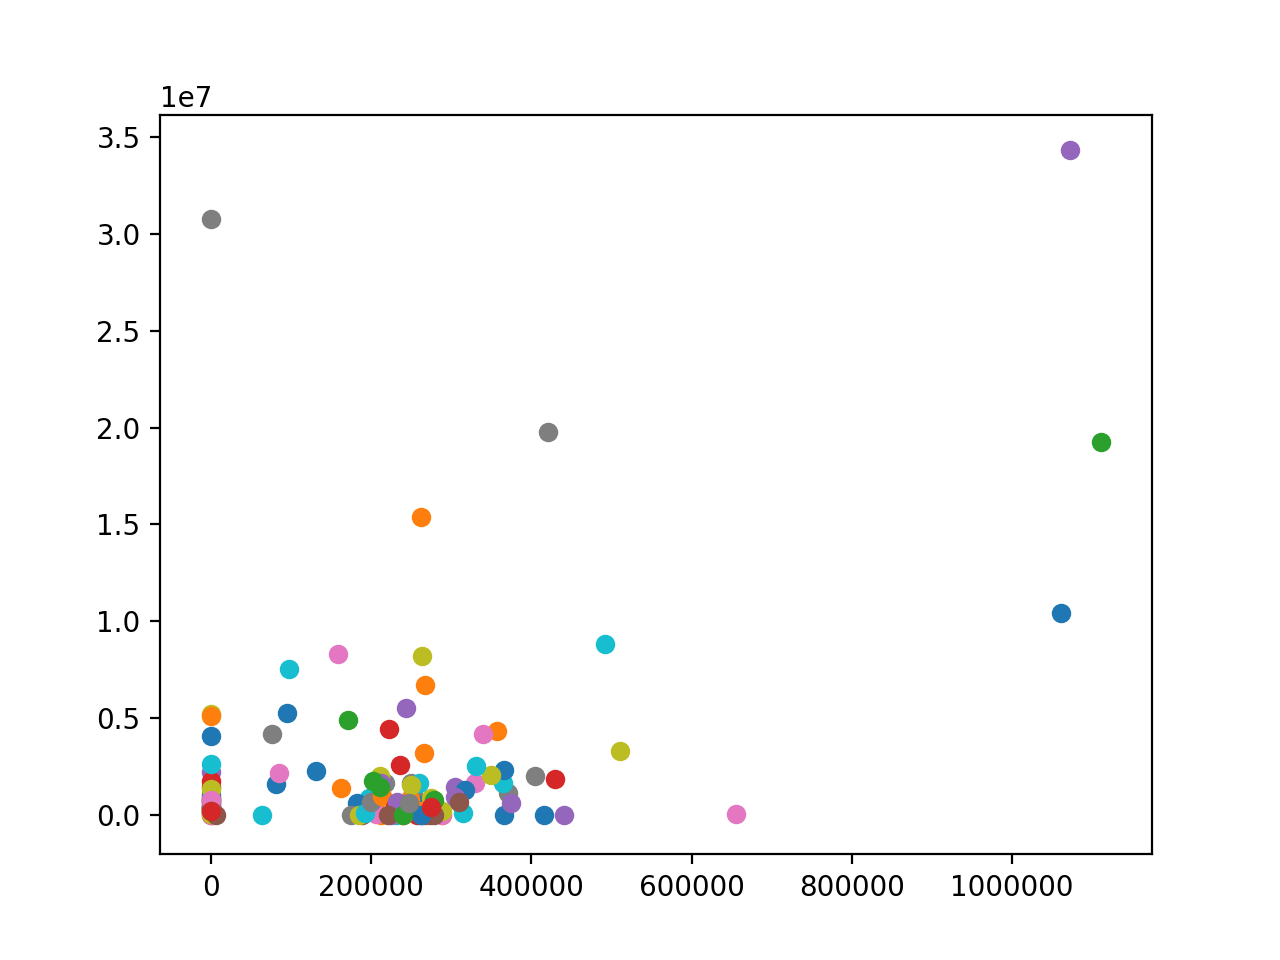
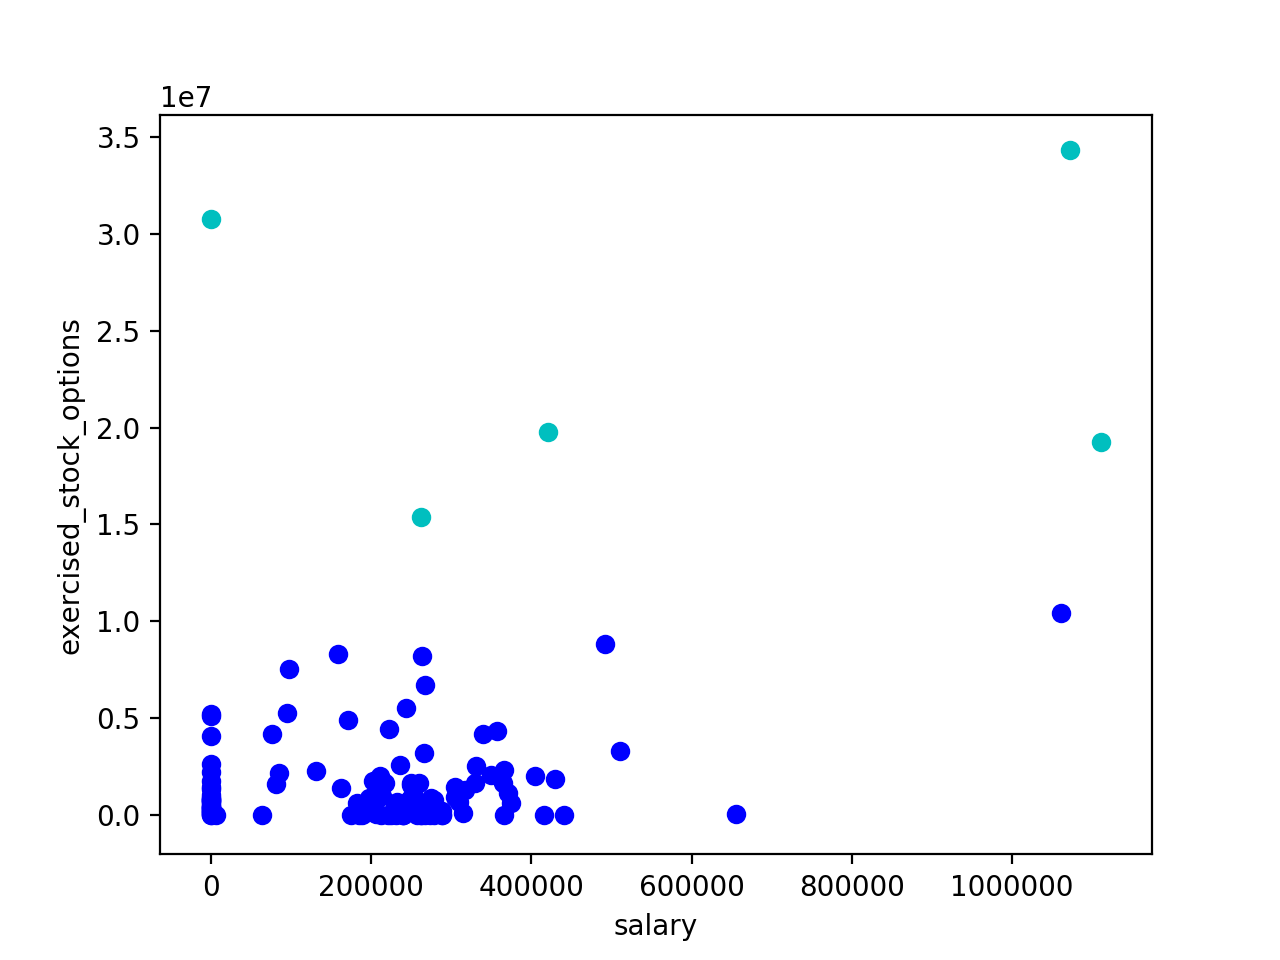
for f1, f2 in finance_features:
    plt.scatter( f1, f2 )
plt.show()

### cluster here; create predictions of the cluster labels
### for the data and store them to a list called pred
kmeans = KMeans(n_clusters=2, random_state=0).fit(finance_features)
pred = kmeans.predict(finance_features)
### rename the "name" parameter when you change the number of features
### so that the figure gets saved to a different file
try:
    Draw(pred, finance_features, poi, mark_poi=False, name="clusters.pdf", f1_name=feature_1, f2_name=feature_2)
except NameError:
    print "no predictions object named pred found, no clusters to plot"
Before
After:
Some tools: https://www.naftaliharris.com/blog/visualizing-k-means-clustering/