首先卸载低版本的java环境,然后安装 java环境和Apache服务
yum install -y java-1.7.0-openjdk httpd
安装ES环境 elasticsearch
wget https://download.elasticsearch.org/elasticsearch/elasticsearch/elasticsearch-1.4.1.noarch.rpm && yum install elasticsearch-1.4.1.noarch.rpm -y
安装logstash环境
wget https://download.elasticsearch.org/logstash/logstash/packages/centos/logstash-1.4.2-1_2c0f5a1.noarch.rpm && yum install logstash-1.4.2-1_2c0f5a1.noarch.rpm -y
安装kibana环境
wget https://download.elasticsearch.org/kibana/kibana/kibana-3.1.2.zip && unzip kibana-3.1.2.zip && mv kibana-3.1.2 kibana && mv kibana /var/www/html/
安装elasticsearch插件
cd /usr/share/elasticsearch/ && ./bin/plugin -install mobz/elasticsearch-head && ./bin/plugin -install lukas-vlcek/bigdesk/2.5.0
修改elasticsearch配置文件
vim /etc/elasticsearch/elasticsearch.yml
cluster.name: elastic search 去掉前面”#”号
http.cors.enabled: true
http.cors.allow-origin: "http://192.168.215.101"
启动elasticsearch
/etc/rc.d/init.d/elasticsearch start
测试elasticsearch
[root@localhost ~]# curl 127.0.0.1:9200
{
"status" : 200,
"name" : "Agamotto",
"cluster_name" : "elasticsearch",
"version" : {
"number" : "1.4.1",
"build_hash" : "89d3241d670db65f994242c8e8383b169779e2d4",
"build_timestamp" : "2015-11-26T15:49:29Z",
"build_snapshot" : false,
"lucene_version" : "4.10.2"
},
"tagline" : "You Know, for Search"
}
[root@localhost ~]#
配置logstash,如下是Logstash的配置文件
[root@localhost conf.d]# vim /etc/logstash/conf.d/logstasg_access.conf
input {
file {
    type => "apache"
    path => ["/etc/httpd/logs/*_log","/var/log/nginx/*.log"]
}
file {
    type => "syslog"
    path => [ "/var/log/messages", "/var/log/syslog" ]
}
file {
    type => "nova"
    path => [ "/var/log/nova/*.log" ]
}
file {
    type => "cinder"
    path => [ "/var/log/cinder/*.log" ]
}
file {
    type => "neutron"
    path => [ "/var/log/neutron/*.log" ]
}
file {
    type => "ceilometer"
    path => [ "/var/log/ceilometer/*.log" ]
}
}
filter {
if [type] == "syslog" {
    grok {
      match => { "message" => "%{SYSLOGTIMESTAMP:syslog_timestamp} %{SYSLOGHOST:syslog_hostname} %{DATA:syslog_program}(?:[%{POSINT:syslog_pid}])?: %{GREEDYDATA:syslog_message}" }
      add_field => [ "received_at", "%{@timestamp}" ]
      add_field => [ "received_from", "%{host}" ]
    }
    syslog_pri { }
    date {
      match => [ "syslog_timestamp", "MMM  d HH:mm:ss", "MMM dd HH:mm:ss" ]
    }
  }else if [type] == "apache"  {
                if [path] =~ "access" {
                        mutate { replace => { loglevel => "apache_access" } }
                        grok {
                                match => { "message" => "%{COMBINEDAPACHELOG}" }
                                }
                        date {
                                match => [ "timestamp" , "dd/MMM/yyyy:HH:mm:ss Z" ]
        }
        } else if [path] =~ "error" {
                mutate { replace => { loglevel  => "apache_error" } }
                } else {
                        mutate { replace => { loglevel => "apache_random_logs" } }
}
}else {
        grok {
            match => ["message","%{TIMESTAMP_ISO8601:logtime} %{NUMBER:pid} %{WORD:loglevel} %{DATA:process} %{GREEDYDATA:other}"]
    }
  }
}
output {
        stdout { codec => rubydebug }
        elasticsearch_http {
                host => "192.168.215.101"
                port => "9200"
        }
}
启动logstash
[root@localhost bin]#/opt/logstash/bin/logstash -f /etc/logstash/conf.d/logstasg_access.conf
配置kibana
vim /var/www/html/kibana/config.js 修改其中一行 es的IP地址为ES服务器的IP地址
elasticsearch: "http://192.168.215.101:9200”,
apache配置如下:
<VirtualHost 192.168.215.101:80>
ServerAdmin admin@opsnotes.com
DocumentRoot /var/www/html/kibana
ServerName kibana.opsnotes.net
ErrorLog logs/kibana.opsnotes.net-error_log
CustomLog logs/kibana.opsnotes.net-access_log common
</VirtualHost>
启动apache
/etc/rc.d/init.d/httpd start
完成之后 会在logstash中看到如下文件

http://92.168.215.101 web页面中展示
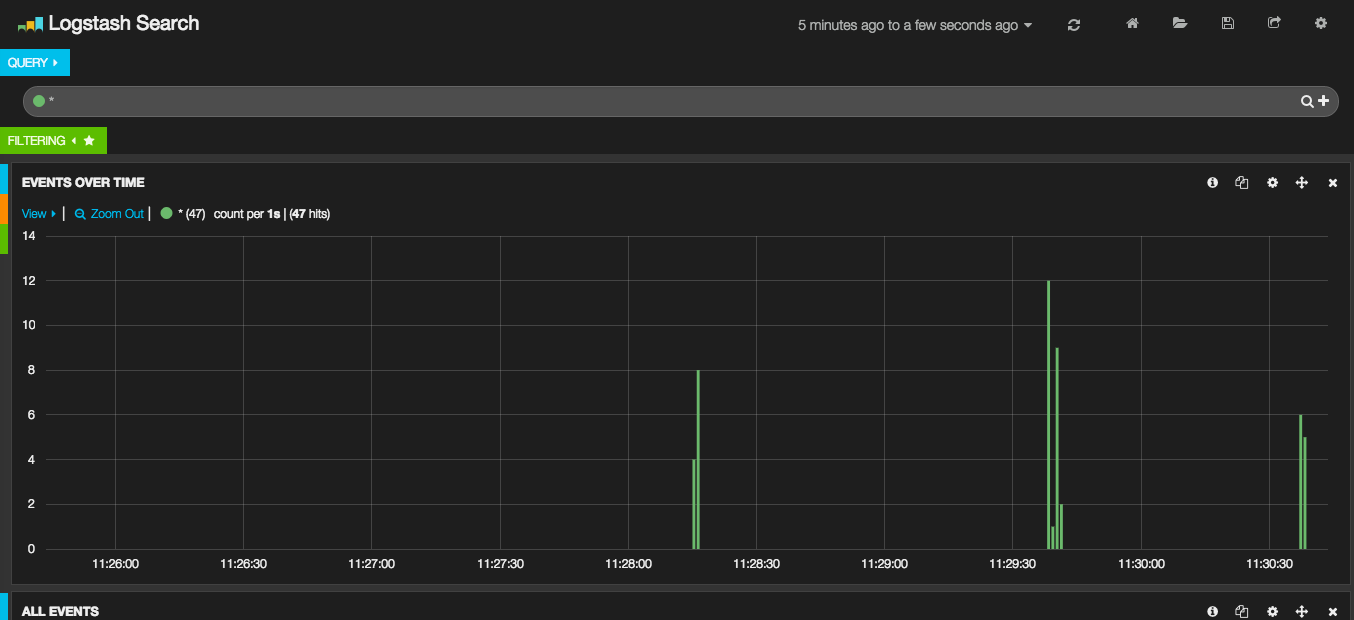 elk
elk
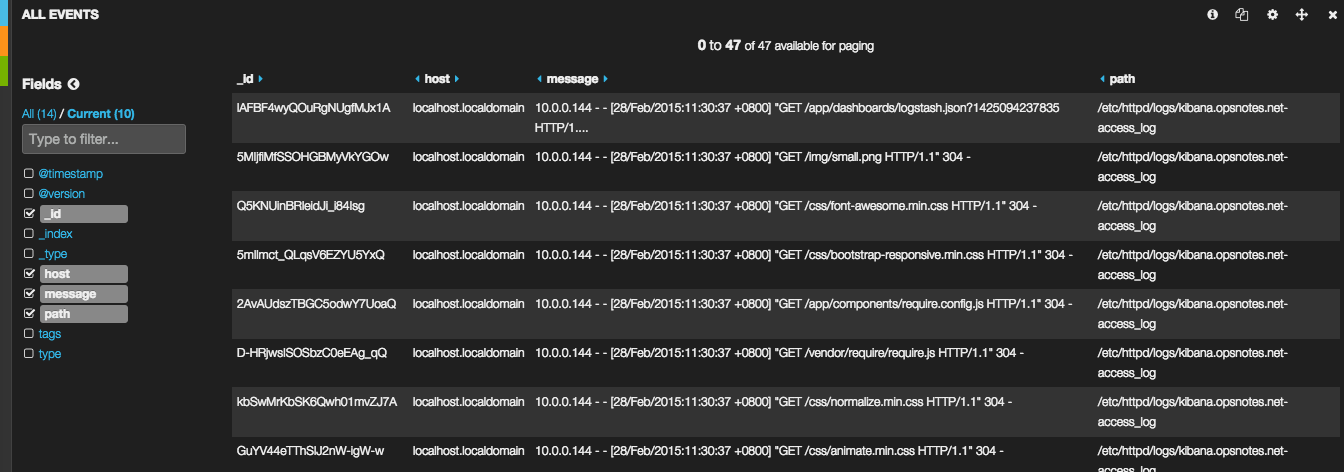 elk
elk
删除ES日志存储:
[root@localhost bin]# curl -XDELETE 'http://192.168.215.63:9200/logstash-2015.06.03*'
两个插件路径:
http://192.168.215.101:9200/_plugin/head/
http://192.168.215.101:9200/_plugin/bigdesk/