http://randomascii.wordpress.com/2013/04/20/xperf-basics-recording-a-trace-the-easy-way/
Some time ago I wrote a long and detailed post about how to record traces using xperf. The steps needed to record a trace were daunting. However more recent versions of the Windows Performance Toolkit (WPT, the proper name for the xperf suite of tools) have made it a lot easier.
The new method for recording traces should handle most scenarios, and it is enough simpler that this post is far shorter than the previous one. In this post I describe the steps needed to record xperf/ETW traces so you can start using this impressive (and free) whole system profiling tool.
Step 1 – get the latest version of xperf
A web search on “windows performance toolkit installer” finds a lot of discussions on how to install various old versions of WPT/xperf. Even the Microsoft download pages for old versions of WPT have not been updated to acknowledge the existence of newer versions. It’s easy to accidentally install an obsolete version.
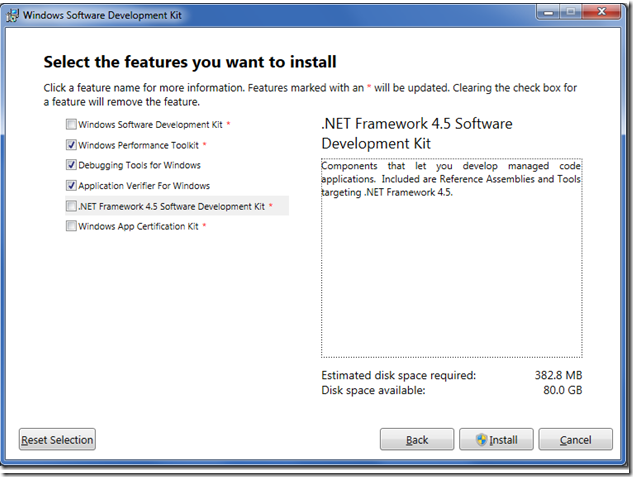
As of today what you need to do is install the Windows Software Development Kit for Windows 8 RTM. The installer, available here, will let you install whatever components you want. In addition to Windows Performance Toolkit I also recommend installingApplication Verifier and Debugging Tools:
The redistributable installers for these three components also get installed – you can find them (on 64-bit machines) in C:Program Files (x86)Windows Kits8.0. Apparently the confusingly named “WPTx64-x86_en-us.msi” is a 32-bit installer that installs the 64-bit version of WPT. Wacky. The redistributables can be handy for sharing WPT with your coworkers, or even customers.
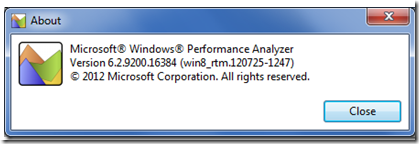
I’m sure that new versions will continue to be released, probably in the Windows SDK, so check for newer SDKs. You can check what version you have installed by running WPA and looking at the about box. Here is the about box for the version of WPA that I am currently running.
Step 2 – get the sample providers and configuration files
You can skip this step if you want – it’s only needed for recording traces with custom ETW providers. But if you use xperf significantly you’ll definitely want to do this – getting custom events into ETW traces makes them far easier to analyze. However you don’t need this for your first trace.
You can download my sample user-mode ETW providers from ftp://ftp.cygnus-software.com/pub/MultiProvider.zip. This .zip file has been updated since the original post. Configuration files for wprui and wpa were added, and a -inputlogger option was added that turns the executable into a very handy key logger – all mouse and keyboard events are emitted as ETW events which can be recorded using the steps in this article. This can be very helpful in trace investigations, but don’t use this illicitly.
When you unzip the file you’ll find a Visual Studio 2010 solution file. Build either configuration. You might want to poke around and look at the ReadMe.txt file and the provider manifest file (etwprovider.man). If you want to use these providers then after you build the project you’ll have to run etwregister.bat from an elevated command prompt. For more details (some of them obsolete) look here.
Step 3 – enable stack collection
Apparently wprui can set the DisablePagingExecutive registry key for you so you don’t need to do this step. Just click OK if it says you need to.
If you are running 64-bit Windows (you are aren’t you?) then there is a registry key that you need to set. And then you need to reboot. The registry key tells Windows to keep information needed for stack walking in non-pageable memory. If you run the command below from an elevated command prompt (yes, it is all one line that is excessively word-wrapped) and then reboot then your call stacks will thank you. Setting this registry key wastes a little bit of memory, but I don’t think it’s enough to matter so I always leave it set.
REG ADD "HKLMSystemCurrentControlSetControlSession ManagerMemory Management" -v DisablePagingExecutive -d 0x1 -t REG_DWORD -f
Step 4 – configure wprui
Recording traces is now much easier than it used to be because of wprui. This tool – ask for it by name in the start menu search box – is an actual UI for recording traces. The default settings for wprui are quite good, but for best results you should enable some custom user providers. This lets you see events like frame start times, keyboard input, or whatever custom events you want to put in your traces.
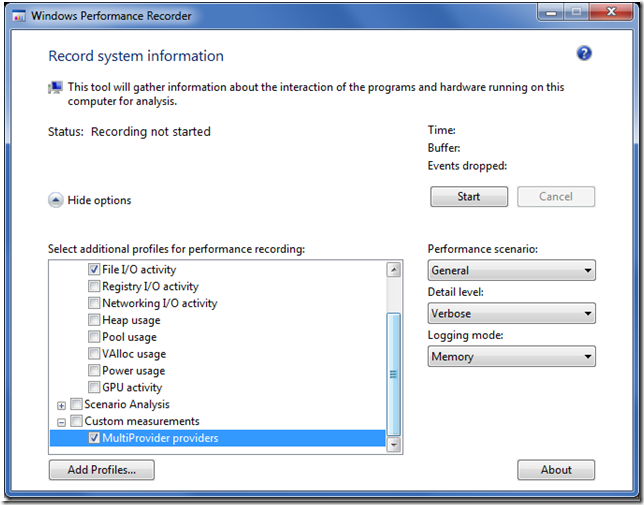
To add custom user providers you should run wprui and then click on the Add Profiles…button. This lets you configure arbitrary data (from system, user/event, or heap providers) to be recorded in the trace. The profile definition format is rather lightlydocumented, with only a couple of samples (look in the wprui install directory for example .wprp files), but with a bit of hacking and experimentation and some help from some friends at Microsoft I created the XML configuration file that I needed. It is in the .zip file referenced above and is called MultiProviderProfile.wprp. When you add this profile towprui (click Add Profiles… and select the file) and enable it then the four custom providers used by the MultiProvider project are enabled in wprui. For details on viewing the recorded events in wpa see step 7. With MultiProviderProfile.wprp loaded and enabledwprui should look something like this:
Step 5 – start tracing
When you click Start in wprui then tracing begins. By default the trace data is recorded to circular buffers in memory, which is usually ideal. In this mode xperf/wprui is constantly monitoring your system and it can be left running like this 24/7. The length of time recorded will depend on how busy your system is and how much memory is devoted to buffering.
Recording to a file is potentially useful – it lets you record arbitrarily long sessions – but this is also its downside. It’s easy to accidentally leave tracing enabled, and then your drive fills up with an ETL file so large you can’t ever load it. You can also do Light profiling instead of the default Verbose profiling. Generally this means that stacks are not recorded, so the overhead is lower, but it’s also harder to do analysis.
Step 6 – record a trace
For initial experimentation you might want to run the MultiProvider sample from the .zip file listed above while recording the trace. This will emit custom events for wprui to record, if you have configured it to do that, and this will give you more interesting data to look at in the trace.
If you’re recording to memory then you can save those circular buffers to disk whenever you want. If you hit a performance problem – in any program – just click on Save (theStart button changes to Save while recording) to save the buffers to disk. Retroactive profiling is truly awesome.
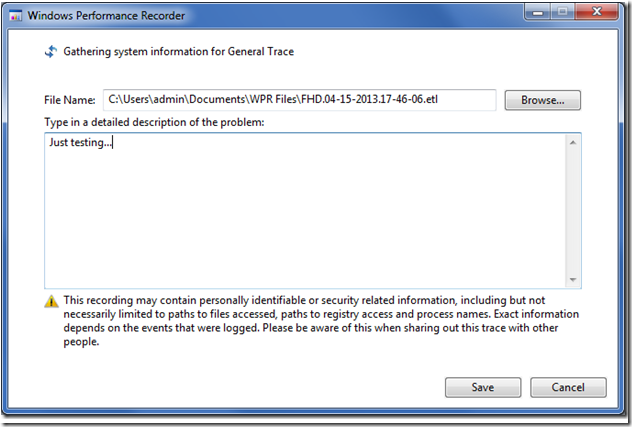
You can also use the system-global Ctrl+Win+C shortcut to trigger saving of the buffers. I recommend using this, especially when recording traces of full-screen games, since it lets you trigger the trace without the delay of alt+tabbing to wprui. Either way, after you ask to have the trace saved you’ll be taken to the window shown below. Take your time and write up a nice verbose description of what was happening when you recorded the trace. The trace is saved to disk in the background while you’re typing, and your comment will be added as a Mark (visible in the Marks table in the System Activity section) once you hit Save. This is your chance to annotate the trace with a description of what was happening.
Step 7 – detailed analysis
Once you’ve saved the trace you can navigate to where it was saved and open it in wpa, which is now the recommended trace viewer. Details of how to analyze it are beyond the scope of this post, but there are a few points worth mentioning. The default view in wpa is quite austere (completely blank!), but you can configure that. If you copy the Startup.wpaProfile included in MultiProvider.zip to the WPA Files folder in your documents directory then WPA will start up with (in my opinion) more useful defaults:
- The top graph will show the Multi Provider Generic Events which lets you see frame rate events or whatever else your program is emitting. I configured it to filter out any providers that don’t contain “Multi-“ in order to reduce unwanted clutter. You can display all events by using the View Preset dropdown to change views, and you can display the data as a table to see event details more easily
- The next graph shows Window in Focus information, which is another useful way of orienting yourself in a trace – note that this graph will sometimes be blank due to bugs in this provider
- The next graph shows CPU Usage (Precise) data which is an extremely accurate measure of CPU consumption, derived from context switch records. I configured the columns so that if you display the table associated with this graph you can do idle-time analysis
- The final graph shows CPU Usage (Sampled) data. I configured it to display call stacks that are grouped by Process and Thread ID. This can be used for CPU busy analysis. You can use the View Preset dropdown to display data grouped by the Module and Function based preset that I created
You don’t have to use this startup file, but I strongly recommend configuring some sort of defaults to make trace analysis initially easier. You can save your customizations with Profiles-> Save Startup Profile.
For more information on using WPA, including a list of known bugs, see the article I wrote last year titled WPA-Xperf Trace Analysis Reimagined.
Improvements I’d like to see
I have to confess that I don’t use wprui. I wrote my own trace recording UI which is tuned to my own needs and wprui is not good enough to tempt me to switch. Some of the features that wprui needs to acquire before I’ll consider switching include:
- an (optional) input monitor to insert input events into traces – key loggers are very helpful. This could always be done as an external program
- a way to manage (rename, annotate, view) the traces it has recorded
- transparent compression and decompression of traces
- one-click changing of the CPU sampling frequency
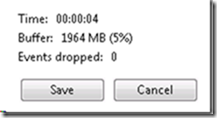
- a way to adjust the buffer size, since on large-memory machines wprui’s buffers are excessively huge (2 GB? Really?)
- automatic installation of the symbol loading DLLs – preferably the versions that don’t take hours to load symbols
- Trace file names with the year before the date so that they sort sensibly
Adding these features, and perhaps a few others, would get rid of the existing clunkiness which makes wprui slightly frustrating to use.
wprui does have some great advantages however. It supports symbols for managed code and JavaScript, and it’s a huge improvement over using xperf from the command-line to record traces. Recommended.
Miscellany
If you search for documentation on wprui you won’t find much. You need to search for wprinstead as this covers documentation for wprui as well as the command line wpr tool. I’m not a fan of the documentation – too much clicking around for too little content – but you can find it here. It looks like WPT was supposed to ship with a documentation file –wpt.chm – but it is missing in action. Oops.
Michael Milirud’s Build 2011 talks, available here, show some of the features of wprui andwpa.
Microsoft recommends not checking too many of the wprui check boxes, in order to avoid increasing the data rate too much. However they also don’t give details about what each checkbox controls and I don’t want to experiment a lot so I typically check the top three boxes, plus the Multi Provider one. Your mileage may vary.
You can use xperf -loggers for debugging configuration files. It dumps detailed information about all enabled providers and you can search through it to see if the providers you requested got enabled. If it says no loggers enabled then you’re probably running it from a non-administrator command prompt.
You can use “wpr -profiles” and “wpr -profiledetails” to see what the built-in profiles contain.
You can find some documentation about profile definitions (.wprp files) here.
Discoverability
I ranted last week about the importance of discoverability – there’s not much point having keyboard shortcuts if your users can’t find them. The problem then was that the options for zooming in wpa were needlessly hidden. I think wprui takes a lack of discoverability to new heights. In order to find the global keyboard shortcut for wprui all I had to do was look in this file:
C:Program Files (x86)Windows Kits8.0Windows Performance Toolkitwpr.config.xml
and in there I found this line:
<SaveRecordingKeyboardShortcut WinKey=”true” CtrlKey=”true” ShiftKey=”false” AltKey=”false” CharKey=”c” VirtualKeyCode=”0″ />
Of course! Ctrl+Win+C is the global keyboard shortcut for recording a trace. Displaying it in the UI would have been too obvious.
That configuration file contains some other settings. I don’t know what they do.
Summary
Use wprui. Out of the box it is the easiest way of recording xperf traces. With a bit of configuration you can get it to record custom user events which make trace navigation much easier. Use the Ctrl+Win+C shortcut to trigger the recording of traces
