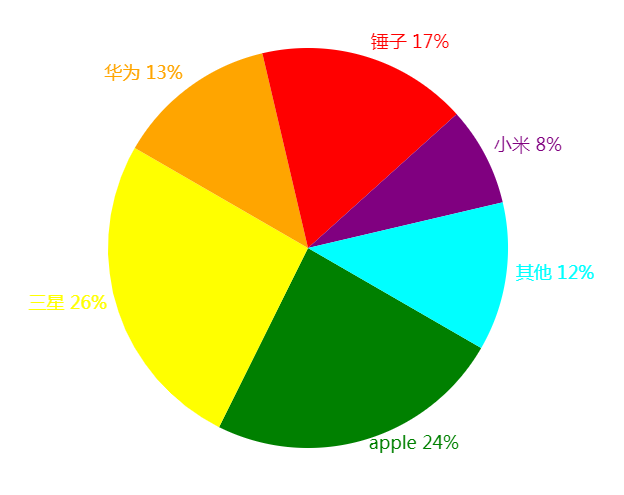
制作饼状图
<!DOCTYPE html>
<html lang="en">
<head>
<meta charset="UTF-8">
<title>canvas绘制扇形图</title>
<style>
	body{
		background:#ccc;
	}
	canvas{
		background:#fff;
	}
</style>
</head>
<body>
<canvas id="myCanvas"></canvas>
<script>
	(function(){
		//定义数据
		var data = [
			{title:"apple", value:0.24, color:"green"},
			{title:"三星", value:0.26, color:"yellow"},
			{title:"华为", value:0.13, color:"orange"},
			{title:"锤子", value:0.17, color:"red"},
			{title:"小米", value:0.08, color:"purple"},
			{title:"其他", value:0.12, color:"cyan"}
		];

		var w=800;
		var h=600;
		var cx=w/2;
		var cy=h/2;
		var r=200;

		//获取canvas元素
		var canvas=document.getElementById("myCanvas");

		//设置画布宽高
		canvas.width=w;
		canvas.height=h;

		//获取绘图环境
		var ctx=canvas.getContext("2d");
		ctx.font="18px Micorsoft YaHei";
		//遍历数据
		var beginAngle=Math.PI/6; //开始的点
		data.forEach(function(item){
			//弧度范围
			var angle=item.value*2*Math.PI;
			//结束的点
			var endAngle=beginAngle+angle;

			//绘制扇形区域
			ctx.beginPath();
			ctx.moveTo(cx,cy);
			ctx.arc(cx,cy,r,beginAngle,endAngle);
			ctx.fillStyle=item.color;
			ctx.fill();

			//写字
			var txtAngle=beginAngle+angle/2;
			if(txtAngle>=Math.PI/2 && txtAngle<Math.PI*3/2){
				ctx.textAlign="end";
			}else{
				ctx.textAlign="start";
			}

			var tx=cx+(r+10)*Math.cos(txtAngle);//Math.cos(x)    x 的余弦值。返回的是 -1.0 到 1.0 之间的数;
			var ty=cy+(r+10)*Math.sin(txtAngle);//Math.sin(x)      x 的正玄值。返回值在 -1.0 到 1.0 之间;
			ctx.fillText(item.title+" "+item.value*100+"%",tx,ty);

			beginAngle=endAngle;
		})

	})()
</script>
</body>
</html>
Konva制作动态饼状图

<!DOCTYPE html>
<html lang="en">
<head>
	<meta charset="UTF-8">
	<title>扇形图</title>
	<style>
		body{
			background:#ccc;
		}
		.konvajs-content{
			background:#fff;
		}
	</style>
</head>
<body>
	<div id="box"></div>
	<script src="konva.js"></script>
	<script>
		var radius=150;
		var duration=1;
		var data = [
			{title:"apple", value:0.24, color:"pink"},
			{title:"三星", value:0.26, color:"skyblue"},
			{title:"华为", value:0.13, color:"orange"},
			{title:"锤子", value:0.17, color:"red"},
			{title:"小米", value:0.08, color:"purple"},
			{title:"其他", value:0.12, color:"cyan"}
		];

		//创建舞台
		var stage=new Konva.Stage({
			container:"#box",
			800,
			height:600
		})
		//创建层
		var layer=new Konva.Layer({

		});
		stage.add(layer);
		//创建扇形的组
		var wedgeGroup=new Konva.Group({
			x:stage.getWidth()/2,
			y:stage.getHeight()/2
		});

		//创建文字的组
		var textGroup=new Konva.Group({
			x:stage.getWidth()/2,
			y:stage.getHeight()/2
		})

		var startAngle=0;
		data.forEach(function(item,index){
			var angle=item.value*360;
			//绘制扇形
			var wedgeShape=new Konva.Wedge({
				x:0,
				y:0,
				radius:radius,
				angle:0,
				rotation:startAngle,
				fill:item.color,
				name:angle+""
			});
			wedgeGroup.add(wedgeShape);

			//绘制文字
			var textAngle=startAngle+angle/2;//文字对应的角度
			var textX=Math.cos(textAngle/180*Math.PI)*(radius+30);
			var textY=Math.sin(textAngle/180*Math.PI)*(radius+30);

			var text=new Konva.Text({
				text:item.title,
				x:textX,
				y:textY,
				fill:item.color,
				fontSize:12,
				visible:false
			});

			if(textAngle>90&&textAngle<270){
				text.x(text.x()-text.getWidth())
			}
			textGroup.add(text);
			startAngle+=angle;
		});

		//绘制外圆
		var outerCircle=new Konva.Circle({
			x:stage.getWidth()/2,
			y:stage.getHeight()/2,
			radius:radius+5,
			stroke:"#ccc",
			strokeWidth:1
		});
		layer.add(wedgeGroup);
		layer.add(textGroup);
		layer.add(outerCircle);

		layer.draw();

		//设置动画来让扇形动起来
		var wedgeList=wedgeGroup.getChildren();
		var animateIndex=0;

		playAnimate();//调用函数执行动画
		function playAnimate(){
			if(animateIndex>=data.length){
				return;
			}
			var wedge=wedgeList[animateIndex];
			var angle=Number(wedge.name());
			var animateDuration=duration*(angle/360);
			wedge.to({
				angle:angle,
				duration:animateDuration,
				onFinish:function(){
					textGroup.getChildren()[animateIndex].show();
					animateIndex++;
					playAnimate();
				}
			})
		}
	</script>
</body>
</html>
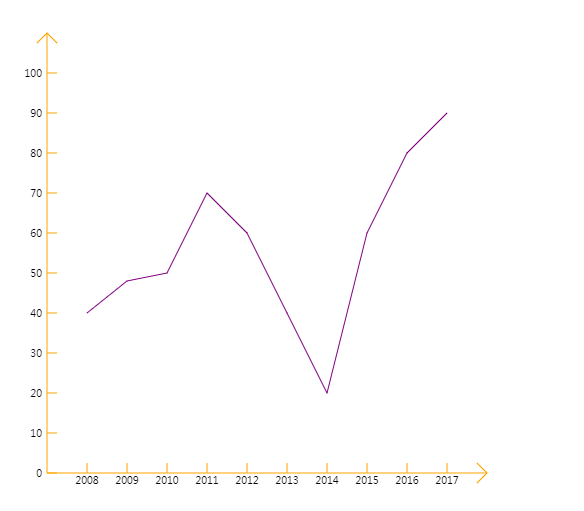
制作折线图
<!DOCTYPE html>
<html lang="en">
<head>
	<meta charset="UTF-8">
	<title>折线图</title>
	<style>
		body{
			background:#ccc;
		}
	</style>
</head>
<body>
	<canvas id="myCanvas"></canvas>
	<script>
		//定义相关数据 最大100
		var data=[
			{year:"2008",value:40},
			{year:"2009", value:48},
			{year:"2010", value:50},
			{year:"2011", value:70},
			{year:"2012", value:60},
			{year:"2013", value:40},
			{year:"2014", value:20},
			{year:"2015", value:60},
			{year:"2016", value:80},
			{year:"2017", value:90}
		];
		var xWidth=40;//x轴每一个格子宽度
		var yWidth=40;//y轴每一个格子宽度
		var x=100,y=500;//原点坐标
		var len=data.length;//数据长度
		//获取canvas元素
		var canvas=document.querySelector("#myCanvas");
		canvas.width=800;
		canvas.height=600;
		canvas.style.border="1px solid #ccc";
		canvas.style.backgroundColor="#fff";
		//获取绘图环境
		var ctx=canvas.getContext("2d");

		//绘制坐标系
		ctx.beginPath();
		//x轴
		var xLength=xWidth*(len+1);//x轴长度
		ctx.moveTo(x,y);
		ctx.lineTo(x+xLength,y);//箭头
		ctx.lineTo(x+xLength-10,y-10);//上箭头
		ctx.moveTo(x+xLength,y);//下箭头
		ctx.lineTo(x+xLength-10,y+10);//下箭头
		//刻度
		ctx.textAlign="center";
		ctx.textBaseline="top";
		for(var i=1;i<=len;i++){
			ctx.moveTo(x+xWidth*i,y);
			ctx.lineTo(x+xWidth*i,y-10);
			ctx.fillText(data[i-1].year,x+xWidth*i,y);
		}

		//y轴
		var yLength=yWidth*(len+1);
		ctx.moveTo(x,y);
		ctx.lineTo(x,y-yLength);
		//箭头
		ctx.lineTo(x-10,y-yLength+10);//左箭头
		ctx.moveTo(x,y-yLength);//右箭头
		ctx.lineTo(x+10,y-yLength+10);//右箭头
		//刻度
		ctx.textAlign="end";
		ctx.textBaseline="middle";
		for(var i=0;i<=10;i++){
			ctx.moveTo(x,y-i*yWidth);
			ctx.lineTo(x+10,y-i*yWidth);

			ctx.fillText(i*10,x-5,y-i*yWidth)
		}
		ctx.strokeStyle="orange";
		ctx.stroke();

		//绘制折线图
		ctx.beginPath();
		data.forEach(function(item,index){
			ctx.lineTo(x+(index+1)*xWidth,y-item.value/10*yWidth);
		});
		ctx.strokeStyle="purple";
		ctx.stroke();
	</script>
</body>
</html>
制作柱形图

<!DOCTYPE html>
<html lang="en">
<head>
	<meta charset="UTF-8">
	<title>柱形图</title>
	<style>
		body{
			background:#ccc;
		}
	</style>
</head>
<body>
	<canvas id="myCanvas"></canvas>
	<script>
		//定义相关数据 最大100
		var data=[
			{city:"北京",number:345,color:"red"},
			{city:"上海", number:645, color:"green"},
			{city:"广州", number:545, color:"#369"},
			{city:"深圳", number:945, color:"purple"}
		];
		var x=100,y=500;//原点坐标
		var xWidth=50;
		var yWidth=40;

		//获取canvas元素
		var canvas=document.querySelector("#myCanvas");
		canvas.width=800;
		canvas.height=600;
		canvas.style.border="1px solid #ccc";
		canvas.style.backgroundColor="#fff";

		//获取绘图环境
		var ctx=canvas.getContext("2d");

		//绘制坐标 轴
		ctx.save();
		ctx.translate(x,y);
		ctx.beginPath();

		//x轴
		ctx.moveTo(0,0);
		ctx.lineTo(xWidth*9,0);
		ctx.lineTo(xWidth*9-10,-10);
		ctx.moveTo(xWidth*9,0);
		ctx.lineTo(xWidth*9-10,10);

		//y轴
		ctx.moveTo(0,0);
		ctx.lineTo(0,-yWidth*11);
		ctx.lineTo(-10,-yWidth*11+10);
		ctx.moveTo(0,-yWidth*11);
		ctx.lineTo(10,-yWidth*11+10);

		//刻度
		ctx.textAlign="end";
		ctx.textBaseline="middle";
		for(var i=0;i<=10;i++){
			ctx.moveTo(0,-i*yWidth);
			ctx.lineTo(10,-i*yWidth);
			ctx.fillText(i*100,-10,-i*yWidth);
		}
		ctx.strokeStyle="orange";
		ctx.stroke();

		//绘制饼状图
		ctx.beginPath();
		ctx.textAlign="center";
		ctx.textBaseline="top";
		data.forEach(function(item,index){
			ctx.fillStyle=item.color;
			ctx.fillRect(index*2*xWidth+xWidth,-item.number/100*yWidth,xWidth,item.number/100*yWidth);
			ctx.fillText(item.city,index*2*xWidth+xWidth+xWidth/2,10);
		})

		ctx.restore();
	</script>
</body>
</html>