cAdvisor+Prometheus+Grafana监控docker
一、cAdvisor(需要监控的主机都要安装)
官方地址:https://github.com/google/cadvisor
CAdvisor是谷歌开发的用于分析运行中容器的资源占用和性能指标的开源工具。CAdvisor是一个运行时的守护进程,负责收集、聚合、处理和输出运行中容器的信息。
注意在查找相关资料后发现这是最新版cAdvisor的bug,换成版本为google/cadvisor:v0.24.1 就ok了,映射主机端口默认是8080,可以修改。
sudo docker run
  --volume=/:/rootfs:ro
  --volume=/var/run:/var/run:ro
  --volume=/sys:/sys:ro
  --volume=/var/lib/docker/:/var/lib/docker:ro
  --volume=/dev/disk/:/dev/disk:ro
  --publish=8090:8080
  --detach=true
  --name=cadvisor
  google/cadvisor:v0.24.1
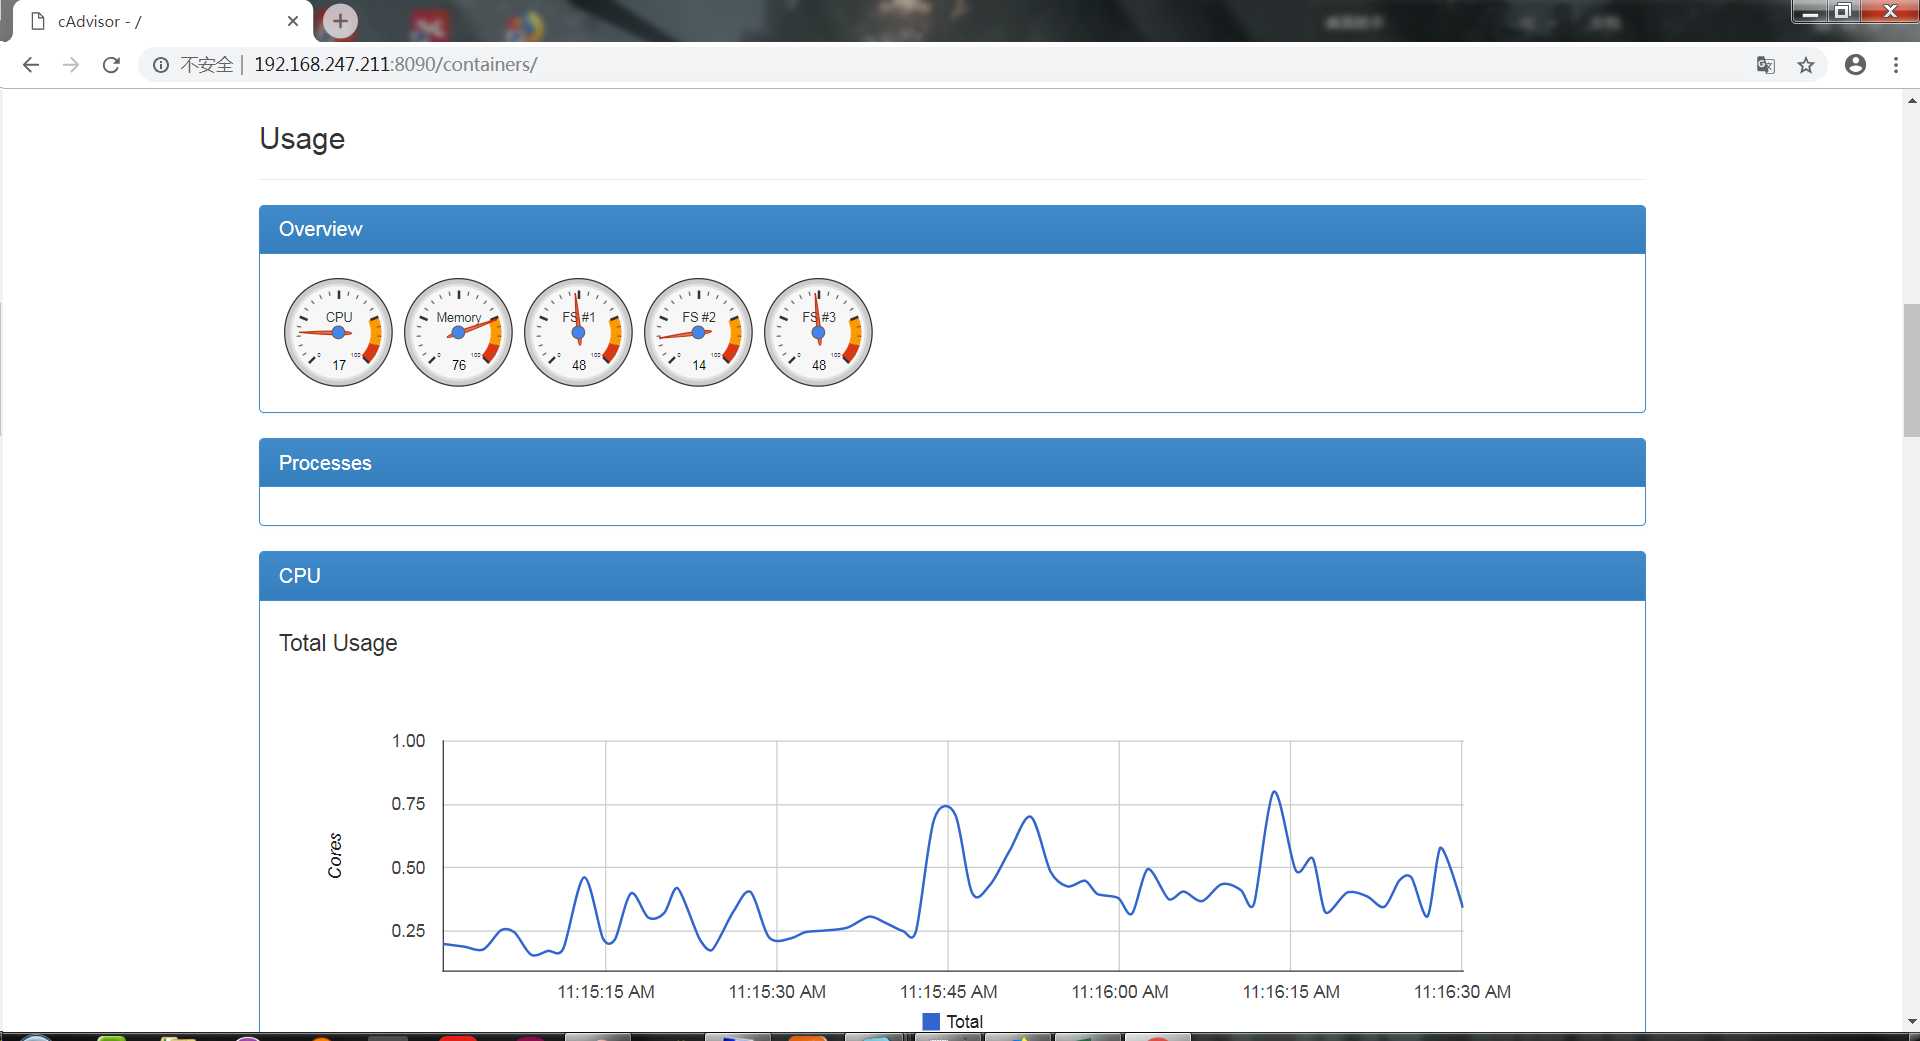
cAdvisor exposes a web UI at its port:
http://<hostname>:<port>/
下图为cAdvisor的web界面,数据实时刷新但是不能存储。
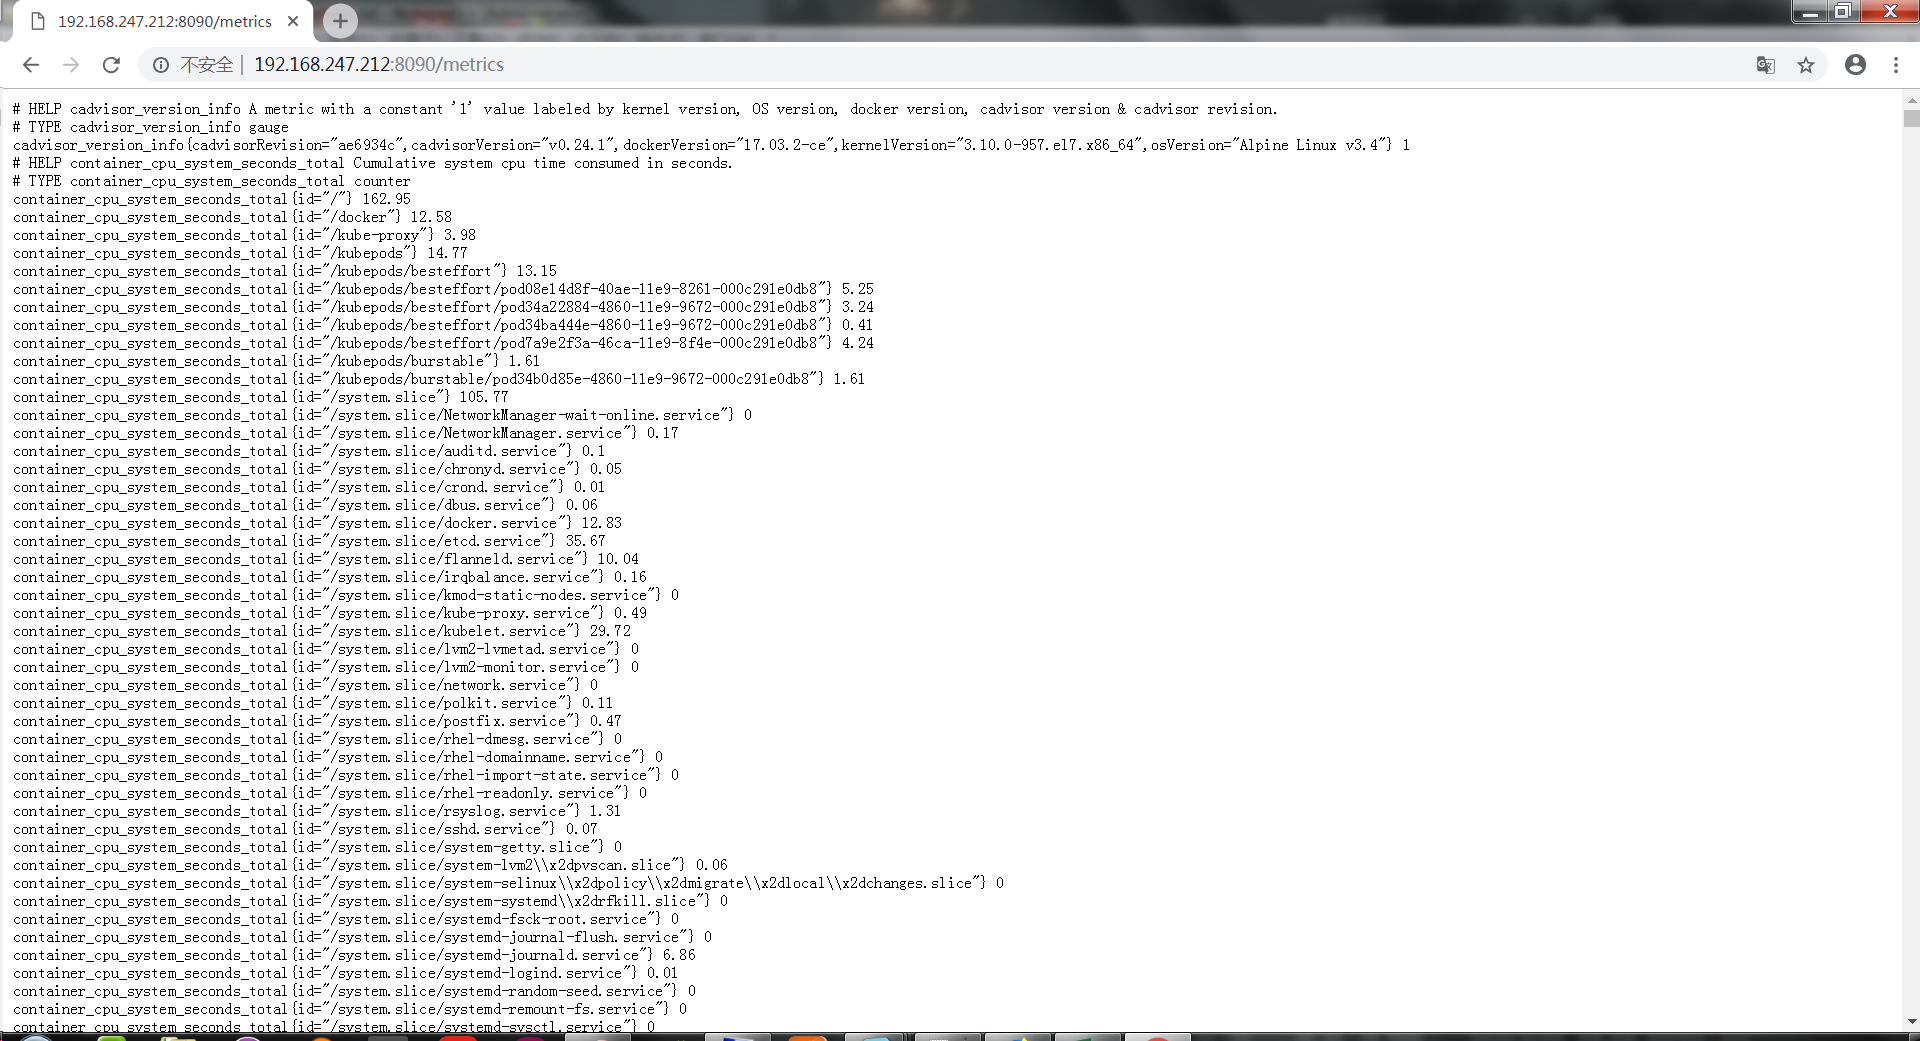
查看json格式
http://192.168.247.212:8090/metrics
二、Prometheus
官方地址:https://prometheus.io/
随着容器技术的迅速发展,Kubernetes 已然成为大家追捧的容器集群管理系统。Prometheus 作为生态圈 Cloud Native Computing Foundation(简称:CNCF)中的重要一员,其活跃度仅次于 Kubernetes, 现已广泛用于 Kubernetes 集群的监控系统中。本文将简要介绍 Prometheus 的组成和相关概念,并实例演示 Prometheus 的安装,配置及使用,以便开发人员和云平台运维人员可以快速的掌握 Prometheus。
Prometheus 简介
Prometheus 是一套开源的系统监控报警框架。它启发于 Google 的 borgmon 监控系统,由工作在 SoundCloud 的 google 前员工在 2012 年创建,作为社区开源项目进行开发,并于 2015 年正式发布。2016 年,Prometheus 正式加入 Cloud Native Computing Foundation,成为受欢迎度仅次于 Kubernetes 的项目。
作为新一代的监控框架,Prometheus 具有以下特点:
强大的多维度数据模型:
- 时间序列数据通过 metric 名和键值对来区分。
- 所有的 metrics 都可以设置任意的多维标签。
- 数据模型更随意,不需要刻意设置为以点分隔的字符串。
- 可以对数据模型进行聚合,切割和切片操作。
- 支持双精度浮点类型,标签可以设为全 unicode。
灵活而强大的查询语句(PromQL):在同一个查询语句,可以对多个 metrics 进行乘法、加法、连接、取分数位等操作。
易于管理: Prometheus server 是一个单独的二进制文件,可直接在本地工作,不依赖于分布式存储。
高效:平均每个采样点仅占 3.5 bytes,且一个 Prometheus server 可以处理数百万的 metrics。
使用 pull 模式采集时间序列数据,这样不仅有利于本机测试而且可以避免有问题的服务器推送坏的 metrics。
可以采用 push gateway 的方式把时间序列数据推送至 Prometheus server 端。
可以通过服务发现或者静态配置去获取监控的 targets。
有多种可视化图形界面。
易于伸缩。
需要指出的是,由于数据采集可能会有丢失,所以 Prometheus 不适用对采集数据要 100% 准确的情形。但如果用于记录时间序列数据,Prometheus 具有很大的查询优势,此外,Prometheus 适用于微服务的体系架构
Prometheus 组成及架构
Prometheus 生态圈中包含了多个组件,其中许多组件是可选的:
- Prometheus Server: 用于收集和存储时间序列数据。
- Client Library: 客户端库,为需要监控的服务生成相应的 metrics 并暴露给 Prometheus server。当 Prometheus server 来 pull 时,直接返回实时状态的 metrics。
- Push Gateway: 主要用于短期的 jobs。由于这类 jobs 存在时间较短,可能在 Prometheus 来 pull 之前就消失了。为此,这次 jobs 可以直接向 Prometheus server 端推送它们的 metrics。这种方式主要用于服务层面的 metrics,对于机器层面的 metrices,需要使用 node exporter。
- Exporters: 用于暴露已有的第三方服务的 metrics 给 Prometheus。
- Alertmanager: 从 Prometheus server 端接收到 alerts 后,会进行去除重复数据,分组,并路由到对收的接受方式,发出报警。常见的接收方式有:电子邮件,pagerduty,OpsGenie, webhook 等。一些其他的工具。
Prometheus 架构图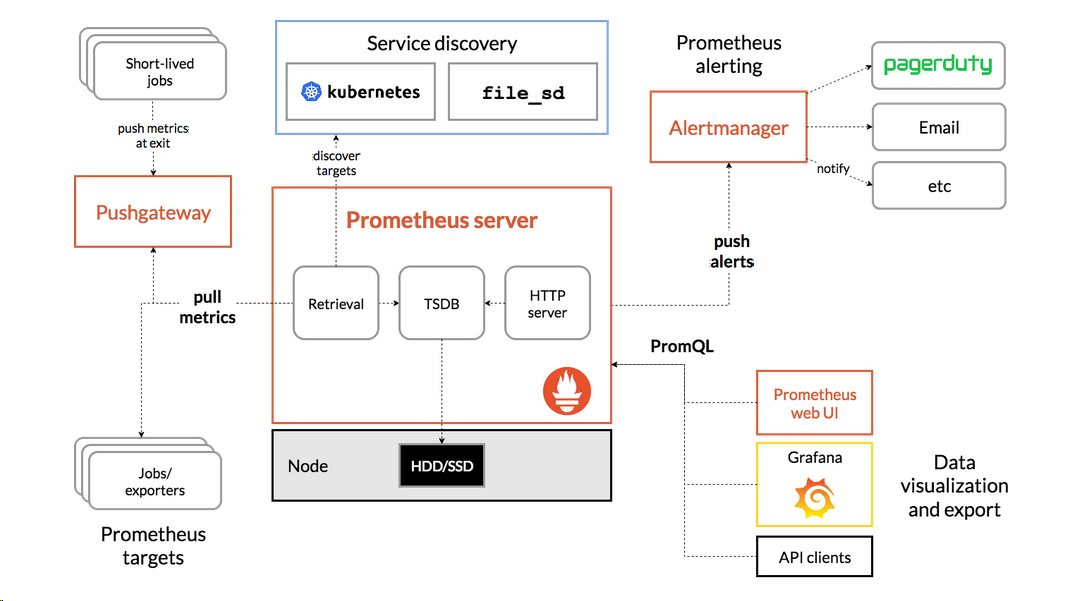
安装步骤:
wget https://github.com/prometheus/prometheus/releases/download/v2.8.0/prometheus-2.8.0.linux-amd64.tar.gz
tar -xf prometheus-2.8.0.linux-amd64.tar.gz
cd prometheus-2.8.0.linux-amd64
修改配置文件prometheus.yml,添加以下内容
    static_configs:
    - targets: ['192.168.247.211:9090']
  - job_name: 'docker'
    static_configs:
    - targets:
      - "192.168.247.211:8090"
      - "192.168.247.212:8090"

cp prometheus promtool /usr/local/bin/

启动:
nohup prometheus --config.file=./prometheus.yml &
我的完整简单prometheus.yml配置文件:
# my global config
global:
  scrape_interval:     15s # Set the scrape interval to every 15 seconds. Default is every 1 minute.
  evaluation_interval: 15s # Evaluate rules every 15 seconds. The default is every 1 minute.
  # scrape_timeout is set to the global default (10s).

# Alertmanager configuration
alerting:
  alertmanagers:
  - static_configs:
    - targets:
      # - alertmanager:9093

# Load rules once and periodically evaluate them according to the global 'evaluation_interval'.
rule_files:
  # - "first_rules.yml"
  # - "second_rules.yml"

# A scrape configuration containing exactly one endpoint to scrape:
# Here it's Prometheus itself.
scrape_configs:
  # The job name is added as a label `job=<job_name>` to any timeseries scraped from this config.
  - job_name: 'prometheus'

    # metrics_path defaults to '/metrics'
    # scheme defaults to 'http'.

    static_configs:
    - targets: ['192.168.247.211:9090']
  - job_name: 'docker'
    static_configs:
    - targets:
      - "192.168.247.211:8090"
      - "192.168.247.212:8090"
访问:http://192.168.247.211:9090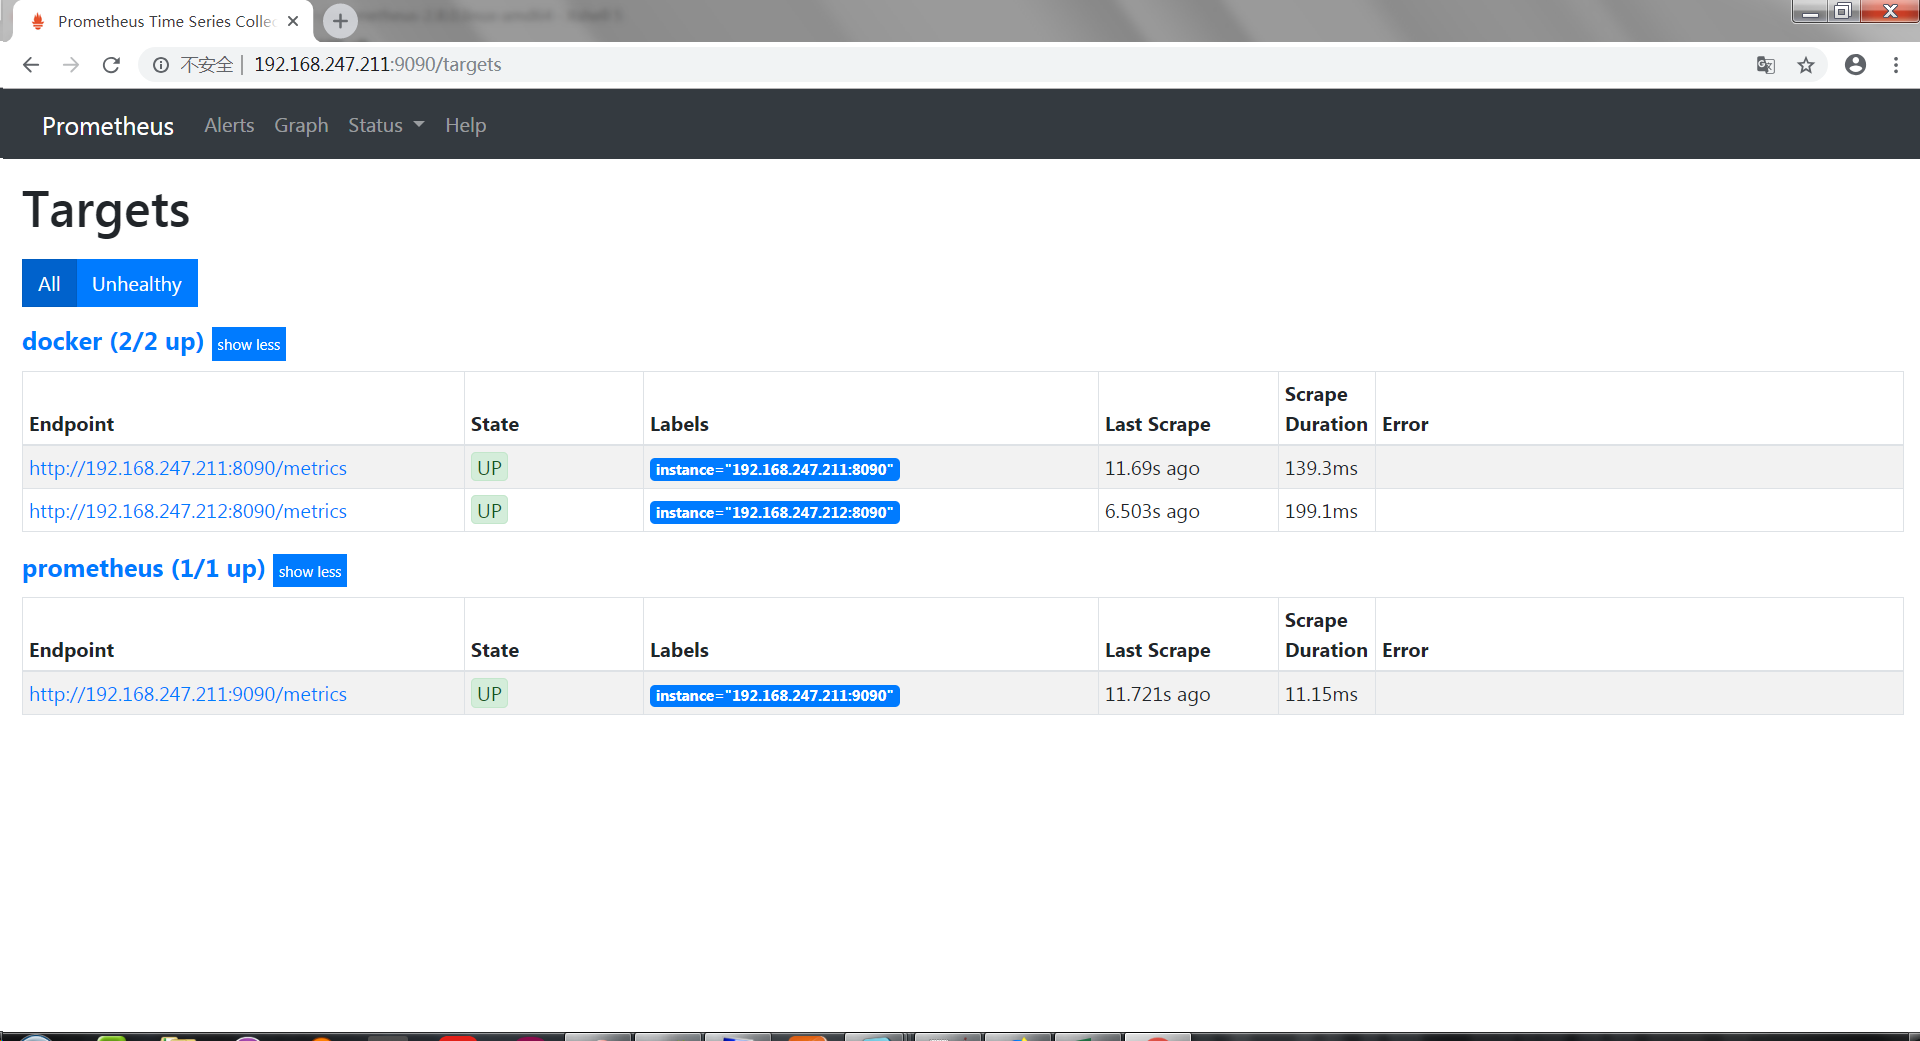
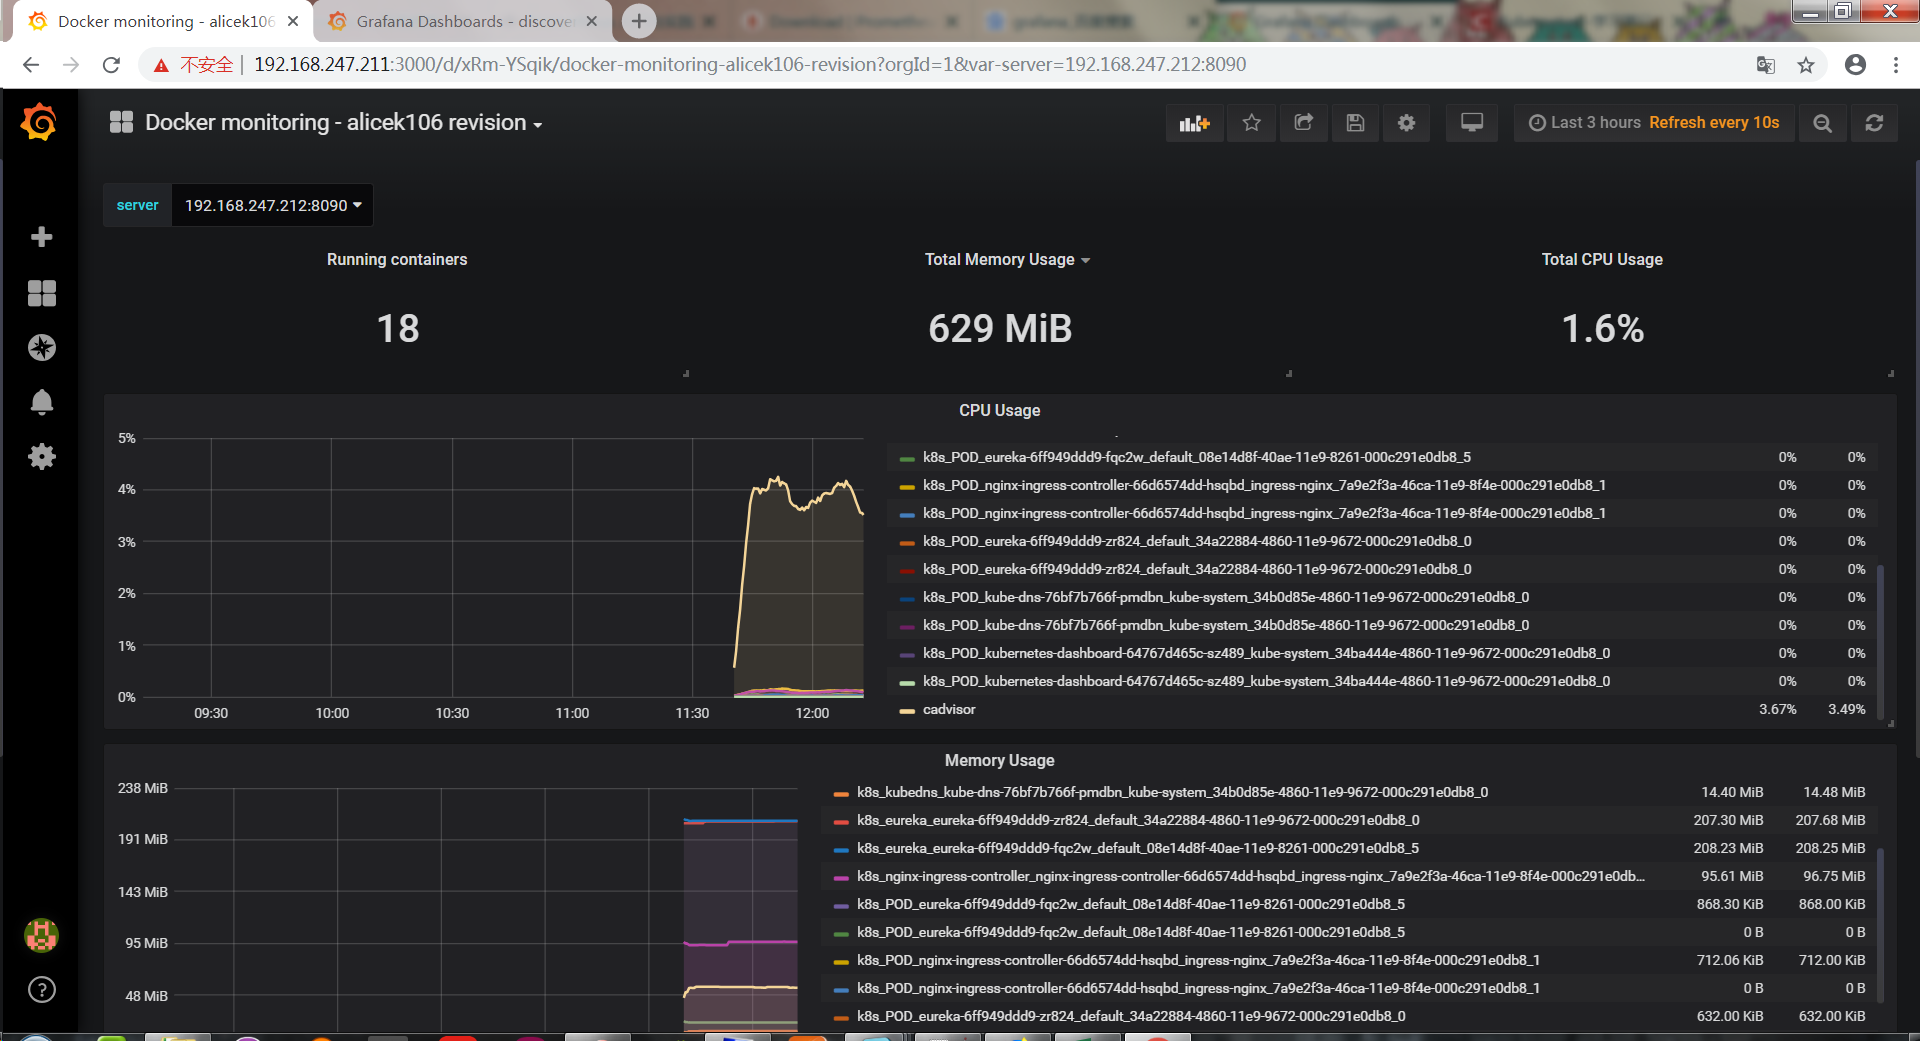
三、Grafana
官方地址:https://grafana.com/
安装步骤:
wget https://dl.grafana.com/oss/release/grafana-6.0.1-1.x86_64.rpm
sudo yum localinstall grafana-6.0.1-1.x86_64.rpm -y
systemctl daemon-reload
systemctl start grafana-server
systemctl status grafana-server
#设置开机自启动
Enable the systemd service so that Grafana starts at boot.
sudo systemctl enable grafana-server.service
1.访问:http://192.168.247.211:3000/login
默认密码:admin/admin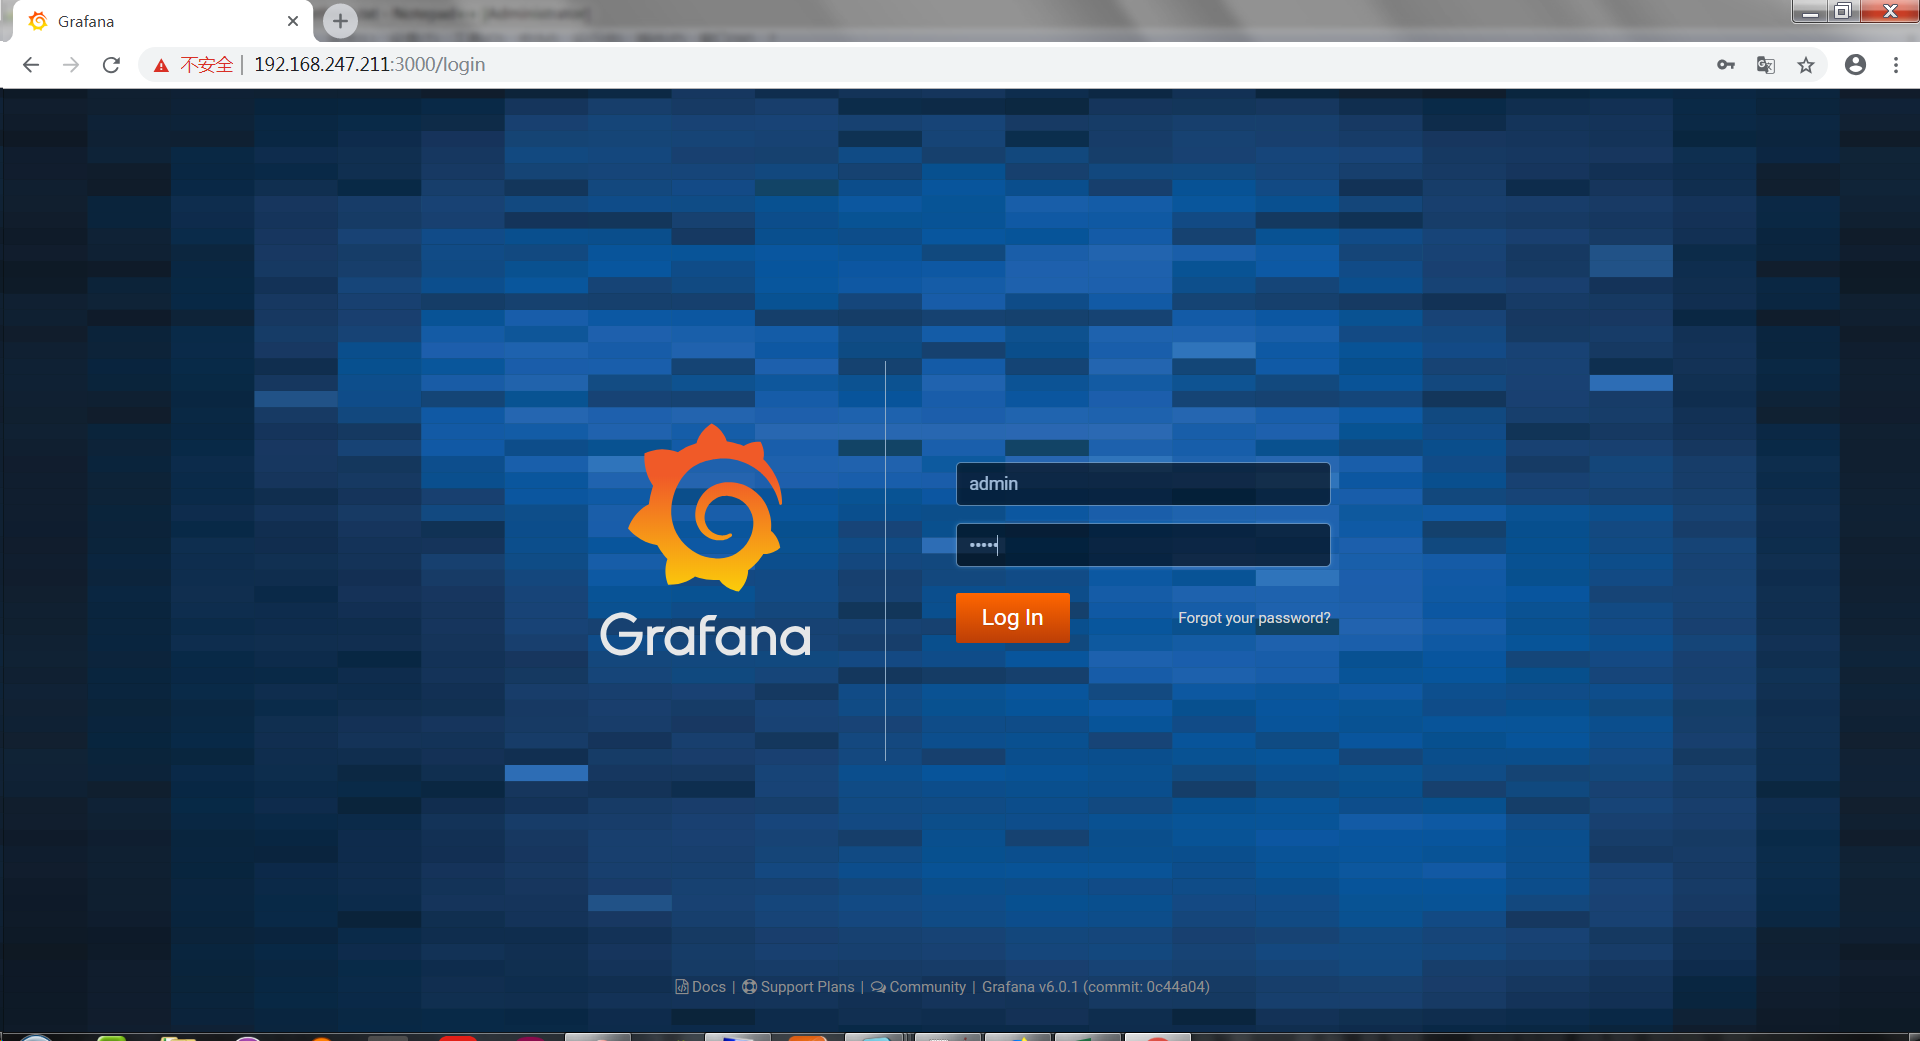
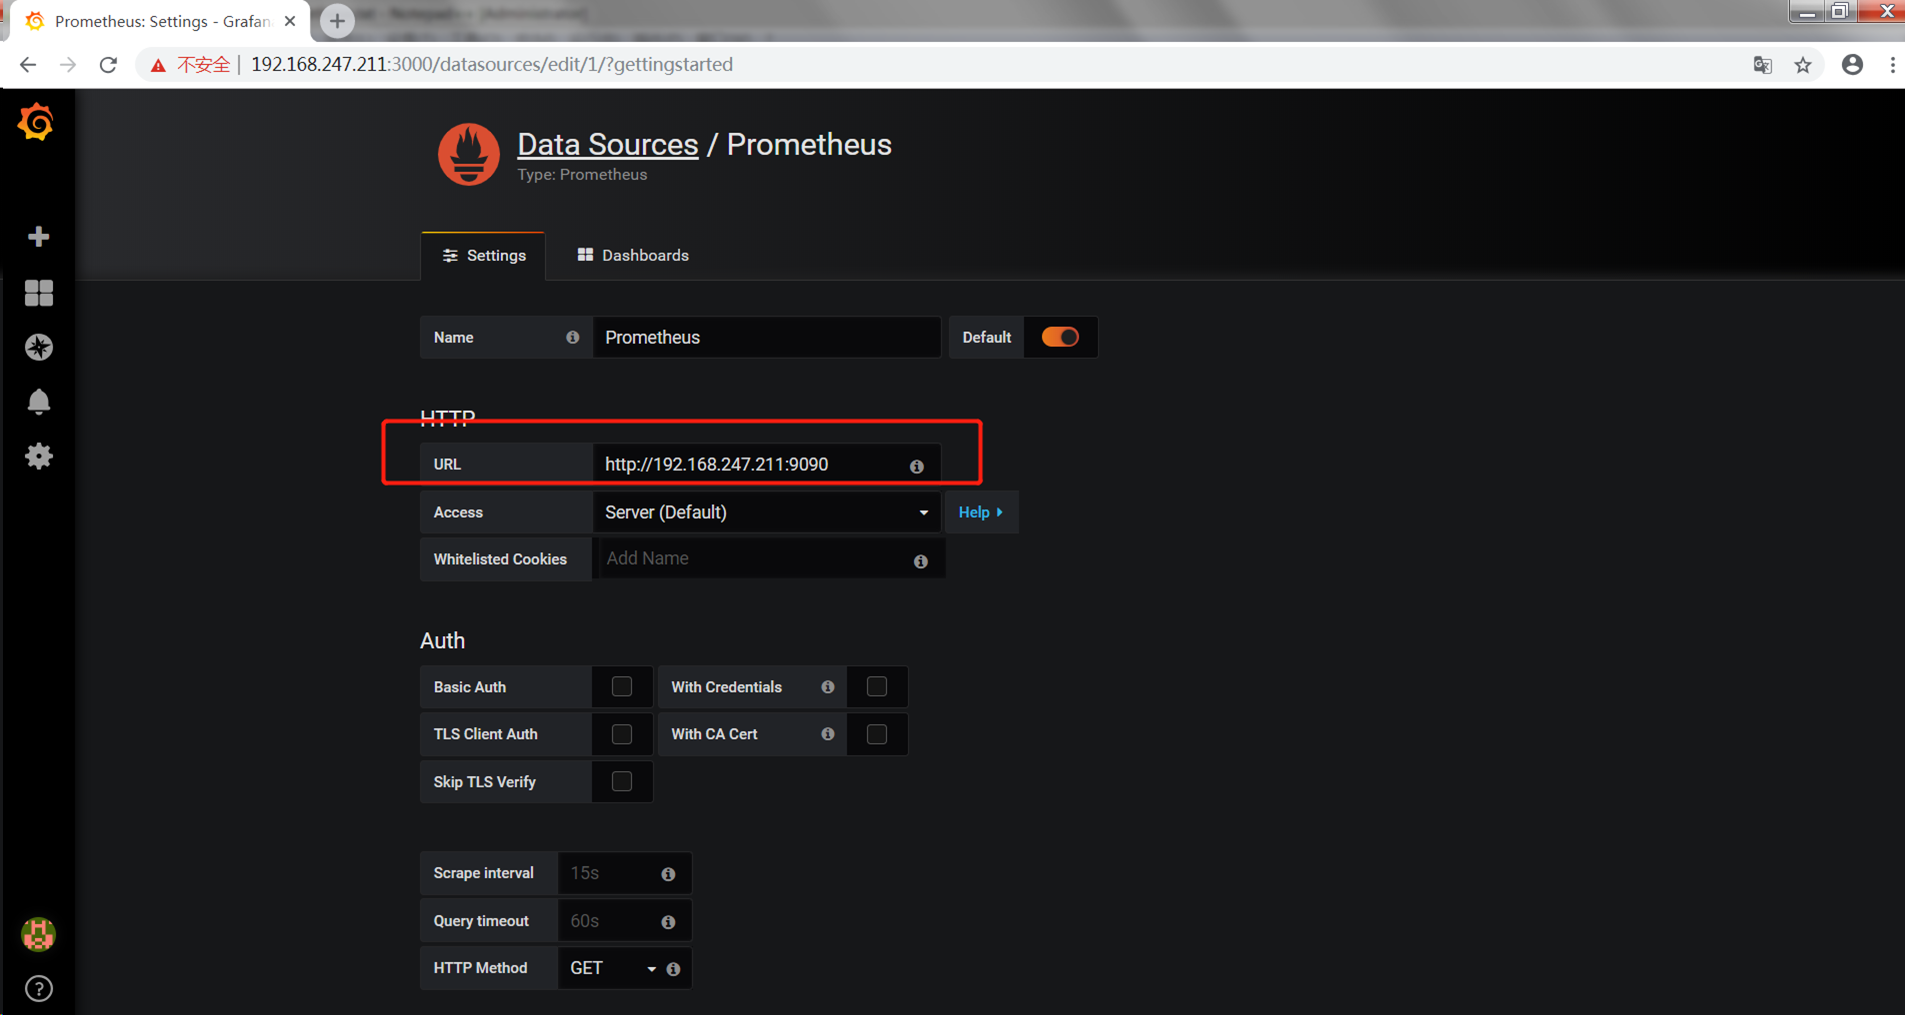
2.配置Prometheus数据源
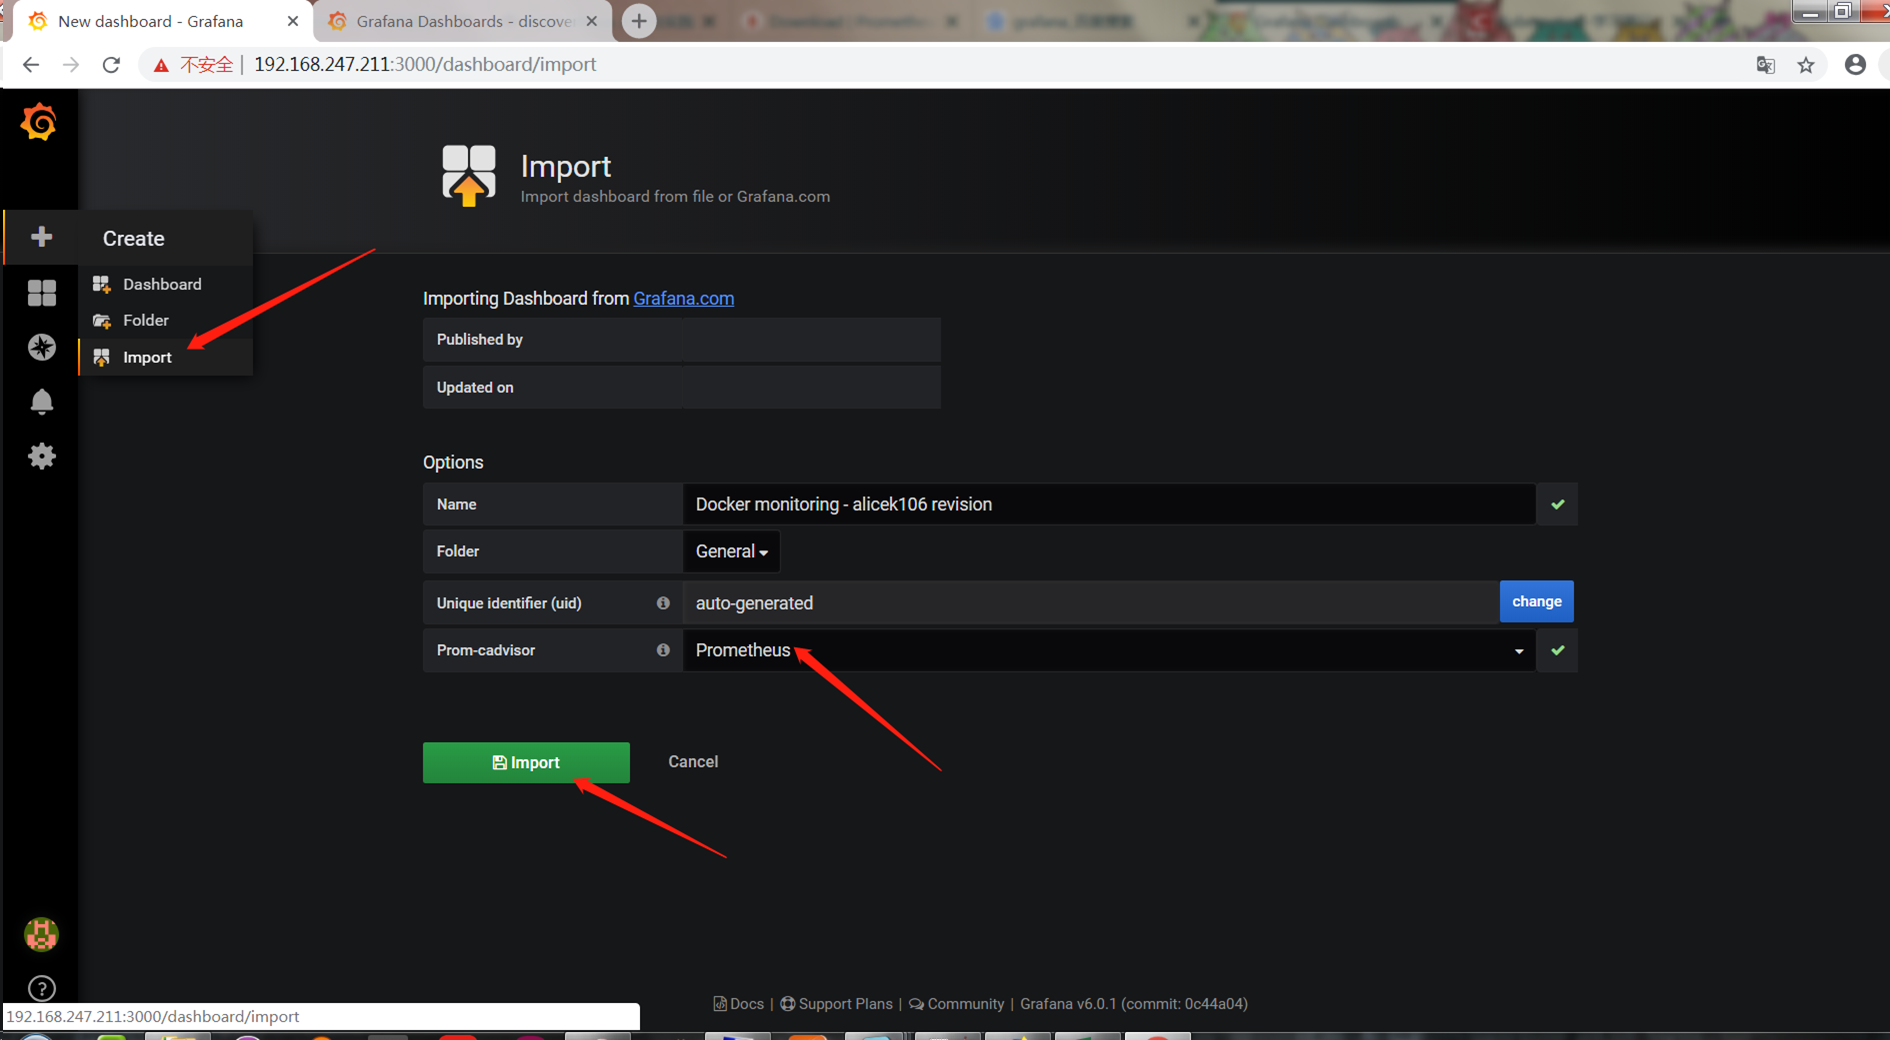
3.下载模板模板地址:https://grafana.com/dashboards
4.导入模板
5.成品