我们安装好orabbix插件后,查看Tablespaces监控项是发项值为none,第一反应是没监控成功,其实不然。

1、我们打开orabbix监控项参数的路径,下面为Tablespaces的sql代码
[root@-svr1 ~]# vim /opt/orabbix/conf/query.props

select '- Tablespace ->',t.tablespace_name ktablespace,
       '- Type->',substr(t.contents, 1, 1) tipo,
       '- Used(MB)->',trunc((d.tbs_size-nvl(s.free_space, 0))/1024/1024) ktbs_em_uso,
       '- ActualSize(MB)->',trunc(d.tbs_size/1024/1024) ktbs_size,
       '- MaxSize(MB)->',trunc(d.tbs_maxsize/1024/1024) ktbs_maxsize,
       '- FreeSpace(MB)->',trunc(nvl(s.free_space, 0)/1024/1024) kfree_space,
       '- Space->',trunc((d.tbs_maxsize - d.tbs_size + nvl(s.free_space, 0))/1024/1024) kspace,
       '- Perc->',decode(d.tbs_maxsize, 0, 0, trunc((d.tbs_size-nvl(s.free_space, 0))*100/d.tbs_maxsize)) kperc
from
  ( select SUM(bytes) tbs_size,
           SUM(decode(sign(maxbytes - bytes), -1, bytes, maxbytes)) tbs_maxsize, tablespace_name tablespace
    from ( select nvl(bytes, 0) bytes, nvl(maxbytes, 0) maxbytes, tablespace_name
    from dba_data_files
    union all
    select nvl(bytes, 0) bytes, nvl(maxbytes, 0) maxbytes, tablespace_name
    from dba_temp_files
    )
    group by tablespace_name
    ) d,
    ( select SUM(bytes) free_space,
    tablespace_name tablespace
    from dba_free_space
    group by tablespace_name
    ) s,
    dba_tablespaces t
    where t.tablespace_name = d.tablespace(+) and
    t.tablespace_name = s.tablespace(+)
    order by 8)
    where kperc > 93
    and tipo <>'T'
    and tipo <>'U'
tbl_space.NoDataFound=none
这个SQL会返回93%满的表空间信息,而对应这个监控项,orabbix也定义了触发器,因为监控项的返回值是文本,而没有满足条件的记录时返回字符串“none“,所以监控项对应的触发器会检查返回值开头是不是none,如果不是,就报警,这样,用户除了收到预警信息,还能从返回值的具体值中看到具体时哪个表空间快满了。
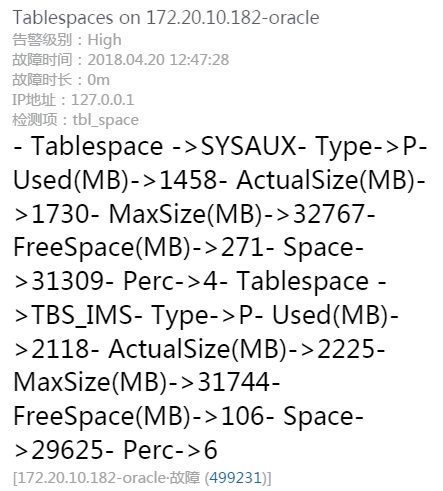
改为3%后测试结果:
当然,大部分时间监控项会返回none,所以我们无法画出正常未满的表空间的空间占用时间曲线。只有超过93%慢时,我们才知道具体的占用情况。
如果想收集并保留更多信息,就需要使用自定义查询,方法就是在query.props文件中加入你想检查的SQL,比如我们想了解表空间信息,就加以下SQL:
customtbl.Query=select 'TBL:'||a.tablespace_name||',' TBL,

'Total Size:'||trunc(sum(a.tots) / 1024 / 1024, 2)||',' Tot_Size_mb,

'Free MB:'||round(sum(a.sumb) / 1024 / 1024, 2)||',' Tot_Free_mb,

'PCT Free:'||round(sum(a.sumb) * 100 / sum(a.tots), 2)||',' Pct_Free,

'Max Free MB:'||round(sum(a.largest) / 1024 / 1024, 2)||',' Max_Free_mb,

'Chunks Free:'||sum(a.chunks)||',' Chunks_Free

from (select tablespace_name,

0 tots,

sum(bytes) sumb,

max(bytes) largest,

count(*) chunks

from dba_free_space a

group by tablespace_name

union

select tablespace_name, sum(bytes) tots, 0, 0, 0

from dba_data_files

group by tablespace_name) a

group by a.tablespace_name

customtbl.NoDataFound=none