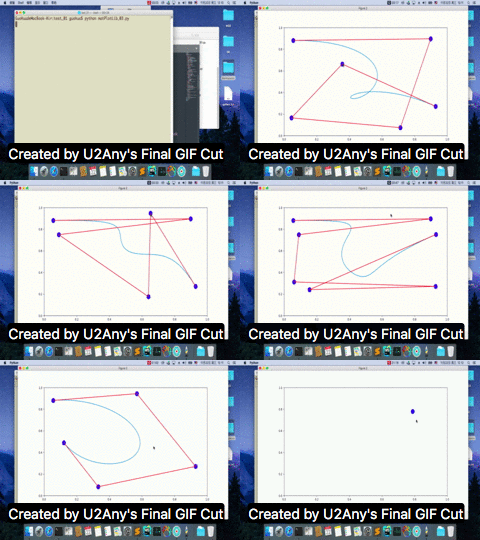
一。实现Bezier曲线的升阶,降阶和拖动。
#!/usr/bin/env python
# -*- coding: utf-8 -*-
'My Bezier'
import numpy as np
from scipy.special import comb, perm
from matplotlib import pyplot as plt

class MyBezier:
    def __init__(self, line):
        self.line = line
        self.index_02 = None #保存拖动的这个点的索引
        self.press = None # 状态标识,1为按下,None为没按下
        self.pick = None # 状态标识,1为选中点并按下,None为没选中
        self.motion = None #状态标识,1为进入拖动,None为不拖动
        self.xs = list() # 保存点的x坐标
        self.ys = list() # 保存点的y坐标
        self.cidpress = line.figure.canvas.mpl_connect('button_press_event', self.on_press) # 鼠标按下事件
        self.cidrelease = line.figure.canvas.mpl_connect('button_release_event', self.on_release) # 鼠标放开事件
        self.cidmotion = line.figure.canvas.mpl_connect('motion_notify_event', self.on_motion) # 鼠标拖动事件
        self.cidpick = line.figure.canvas.mpl_connect('pick_event', self.on_picker) # 鼠标选中事件

    def on_press(self, event): # 鼠标按下调用
        if event.inaxes!=self.line.axes: return
        self.press = 1

    def on_motion(self, event): # 鼠标拖动调用
        if event.inaxes!=self.line.axes: return
        if self.press is None: return
        if self.pick is None: return
        if self.motion is None: # 整个if获取鼠标选中的点是哪个点
            self.motion = 1
            x = self.xs
            xdata = event.xdata
            ydata = event.ydata
            index_01 = 0
            for i in x:
                if abs(i - xdata) < 0.02: # 0.02 为点的半径
                    if abs(self.ys[index_01] - ydata) < 0.02:break
                index_01 = index_01 + 1
            self.index_02 = index_01
        if self.index_02 is None: return
        self.xs[self.index_02] = event.xdata # 鼠标的坐标覆盖选中的点的坐标
        self.ys[self.index_02] = event.ydata
        self.draw_01()

    def on_release(self, event): # 鼠标按下调用
        if event.inaxes!=self.line.axes: return
        if self.pick == None: # 如果不是选中点,那就添加点
            self.xs.append(event.xdata)
            self.ys.append(event.ydata)
        if self.pick == 1 and self.motion != 1: # 如果是选中点,但不是拖动点,那就降阶
            x = self.xs
            xdata = event.xdata
            ydata = event.ydata
            index_01 = 0
            for i in x:
                if abs(i - xdata) < 0.02:
                    if abs(self.ys[index_01] - ydata) < 0.02:break
                index_01 = index_01 + 1
            self.xs.pop(index_01)
            self.ys.pop(index_01)
        self.draw_01()
        self.pick = None # 所有状态恢复,鼠标按下到稀放为一个周期
        self.motion = None
        self.press = None
        self.index_02 = None

    def on_picker(self, event): # 选中调用
        self.pick = 1

    def draw_01(self): # 绘图
        self.line.clear() # 不清除的话会保留原有的图
        self.line.axis([0,1,0,1]) # x和y范围0到1
        self.bezier(self.xs,self.ys) # Bezier曲线
        self.line.scatter(self.xs, self.ys,color='b',s=200, marker="o",picker=5) # 画点
        self.line.plot(self.xs, self.ys,color='r') # 画线
        self.line.figure.canvas.draw() # 重构子图

    def bezier(self,*args): # Bezier曲线公式转换,获取x和y
        t=np.linspace(0,1) # t 范围0到1
        le = len(args[0]) - 1
        le_1 = 0
        b_x,b_y = 0,0
        for x in args[0]:
            b_x = b_x + x*(t**le_1)*((1-t)**le)*comb(len(args[0]) - 1,le_1) # comb 组合,perm 排列
            le = le - 1
            le_1 = le_1 + 1

        le = len(args[0]) - 1
        le_1 = 0
        for y in args[1]:
            b_y = b_y + y*(t**le_1)*((1-t)**le)*comb(len(args[0]) - 1,le_1)
            le = le - 1
            le_1 = le_1 + 1
        self.line.plot(b_x,b_y)

fig = plt.figure(2,figsize=(12,6)) #创建第2个绘图对象,1200*600像素
ax = fig.add_subplot(111) #一行一列第一个子图
ax.set_title('My Bezier')

myBezier = MyBezier(ax)
plt.xlabel('X')
plt.ylabel('Y')
plt.show()
二。运行结果

三。参考
http://blog.csdn.net/joogle/article/details/7975118
http://blog.csdn.net/wizardforcel/article/details/54782688