D3 总共提供了 12 个布局:饼状图(Pie)、力导向图(Force)、弦图(Chord)、树状图(Tree)、集群图(Cluster)、捆图(Bundle)、打包图(Pack)、直方图(Histogram)、分区图(Partition)、堆栈图(Stack)、矩阵树图(Treemap)、层级图(Hierarchy)。
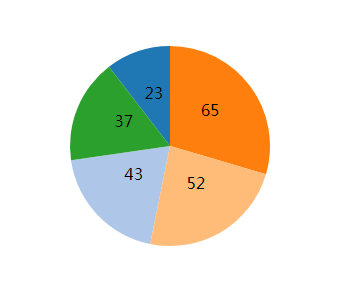
饼状图
 1 //创建画布
 2 var svg=d3.select("body")
 3           .append("svg")
 4           .attr("width",400)
 5           .attr("height",400)
 6
 7 var dataset=[23,43,65,52,37]
 8 var pie=d3.layout.pie()
 9 //进行数据转换
10 var piedata=pie(dataset)
11
12 //绘制图像
13 var outerRadius=100
14 var innerRadius=0
15
16 var arc=d3.svg.arc()  //弧生成器,arc可做函数用
17           .innerRadius(innerRadius)
18           .outerRadius(outerRadius)
19 //添加分组
20 var width=400
21 var color=d3.scale.category20();
22
23 var arcs=svg.selectAll("g")
24             .data(piedata)
25             .enter()
26             .append("g")
27             .attr("transform","translate("+(width/2)+","+(width/2)+")")
28 //为每个g,添加path
29 arcs.append("path")
30     .attr("fill",function(d,i){
31         return color(i)
32     })
33     .attr("d",function(d){
34         return arc(d)
35     })
36 //因为 arcs 是同时选择了 5 个 <g> 元素的选择集,所以调用 append(“path”) 后,每个 <g> 中都有 <path>
37
38
39
40 //添加文本
41 arcs.append("text")
42     .attr("transform",function(d){
43         return "translate("+arc.centroid(d)+")"
44     })
45     .attr("text-anchor","middle")
46     .text(function(d){
47         return d.data
48     })
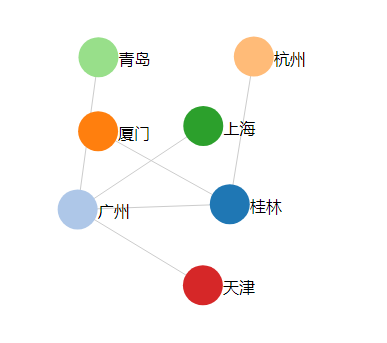
力导向图
//创建画布
svg=d3.select("#force")
       .append("svg")
       .attr("width",400)
       .attr("height",400)

//数据
var nodes = [ { name: "桂林" }, { name: "广州" },
          { name: "厦门" }, { name: "杭州" },
          { name: "上海" }, { name: "青岛" },
          { name: "天津" } ];

 var edges = [ { source : 0 , target: 1 } , { source : 0 , target: 2 } ,
               { source : 0 , target: 3 } , { source : 1 , target: 4 } ,
               { source : 1 , target: 5 } , { source : 1 , target: 6 } ];

//数据转换
var force = d3.layout.force()
  .nodes(nodes) //指定节点数组
  .links(edges) //指定连线数组
  .size([400,400]) //指定作用域范围
  .linkDistance(150) //指定连线长度
  .charge([-400]); //相互之间的作用力

force.start();    //开始作用

//添加连线
 var svg_edges = svg.selectAll("line")
     .data(edges)
     .enter()
     .append("line")
     .style("stroke","#ccc")
     .style("stroke-width",1);

 var color = d3.scale.category20();

 //添加节点
 var svg_nodes = svg.selectAll("circle")
     .data(nodes)
     .enter()
     .append("circle")
     .attr("r",20)
     .style("fill",function(d,i){
         return color(i);
     })
     .call(force.drag);  //使得节点能够拖动

 //添加描述节点的文字
 var svg_texts = svg.selectAll("text")
     .data(nodes)
     .enter()
     .append("text")
     .style("fill", "black")
     .attr("dx", 20)
     .attr("dy", 8)
     .text(function(d){
        return d.name;
     });

force.on("tick", function(){ //对于每一个时间间隔
//更新连线坐标
svg_edges.attr("x1",function(d){ return d.source.x; })
    .attr("y1",function(d){ return d.source.y; })
    .attr("x2",function(d){ return d.target.x; })
    .attr("y2",function(d){ return d.target.y; });

//更新节点坐标
svg_nodes.attr("cx",function(d){ return d.x; })
    .attr("cy",function(d){ return d.y; });

//更新文字坐标
svg_texts.attr("x", function(d){ return d.x; })
   .attr("y", function(d){ return d.y; });
});
弦图
  1 //创建画布
  2 width=600
  3 height=600
  4 var svg=d3.select("body")
  5           .append("svg")
  6           .attr("width",width)
  7           .attr("hight",height)
  8 //数据
  9 var city_name = [ "北京" , "上海" , "广州" , "深圳" , "香港"  ];
 10
 11 var population = [
 12   [ 1000,  3045  , 4567 , 1234 , 3714 ],
 13   [ 3214,  2000  , 2060 , 124  , 3234 ],
 14   [ 8761,  6545  , 3000 , 8045 , 647  ],
 15   [ 3211,  1067  , 3214 , 4000  , 1006 ],
 16   [ 2146,  1034  , 6745 , 4764  , 5000 ]
 17 ];
 18
 19 //数据变换
 20  var chord_layout = d3.layout.chord()
 21   .padding(0.03) //节点之间的间隔
 22   .sortSubgroups(d3.descending) //排序
 23   .matrix(population); //输入矩阵
 24
 25 var groups = chord_layout.groups();
 26 var chords = chord_layout.chords();
 27
 28
 29  var innerRadius = width/2 * 0.7;
 30  var outerRadius = innerRadius * 1.1;
 31
 32  var color20 = d3.scale.category20();
 33
 34  var svg = d3.select("body").append("svg")
 35     .attr("width", width)
 36     .attr("height", height)
 37     .append("g")
 38     .attr("transform", "translate(" + width/2 + "," + height/2 + ")");
 39      var width = 600;
 40  var height = 600;
 41  var innerRadius = width/2 * 0.7;
 42  var outerRadius = innerRadius * 1.1;
 43
 44  var color20 = d3.scale.category20();
 45
 46  var svg = d3.select("body").append("svg")
 47     .attr("width", width)
 48     .attr("height", height)
 49     .append("g")
 50     .attr("transform", "translate(" + width/2 + "," + height/2 + ")");
 51 //绘制节点
 52  var outer_arc = d3.svg.arc()
 53 .innerRadius(innerRadius)
 54 .outerRadius(outerRadius);
 55
 56  var g_outer = svg.append("g");
 57
 58  g_outer.selectAll("path")
 59     .data(groups)
 60     .enter()
 61     .append("path")
 62     .style("fill", function(d) { return color20(d.index); })
 63     .style("stroke", function(d) { return color20(d.index); })
 64     .attr("d", outer_arc );
 65
 66  g_outer.selectAll("text")
 67     .data(groups)
 68     .enter()
 69     .append("text")
 70     .each( function(d,i) {
 71        d.angle = (d.startAngle + d.endAngle) / 2;
 72        d.name = city_name[i];
 73     })
 74     .attr("dy",".35em")
 75     .attr("transform", function(d){
 76        return "rotate(" + ( d.angle * 180 / Math.PI ) + ")" +
 77        "translate(0,"+ -1.0*(outerRadius+10) +")" +
 78        ( ( d.angle > Math.PI*3/4 && d.angle < Math.PI*5/4 ) ? "rotate(180)" : "");
 79      })
 80     .text(function(d){
 81        return d.name;
 82     });
 83 //绘制弦
 84 var inner_chord = d3.svg.chord()
 85     .radius(innerRadius);
 86
 87 svg.append("g")
 88     .attr("class", "chord")
 89     .selectAll("path")
 90     .data(chords)
 91     .enter()
 92     .append("path")
 93     .attr("d", inner_chord )  //
 94     .style("fill", function(d) { return color20(d.source.index); })
 95     .style("opacity", 1)
 96     .on("mouseover",function(d,i){
 97         d3.select(this)
 98           .style("fill","yellow");
 99     })
100     .on("mouseout",function(d,i) {
101         d3.select(this)
102           .transition()
103           .duration(1000)
104           .style("fill",color20(d.source.index));
105     });
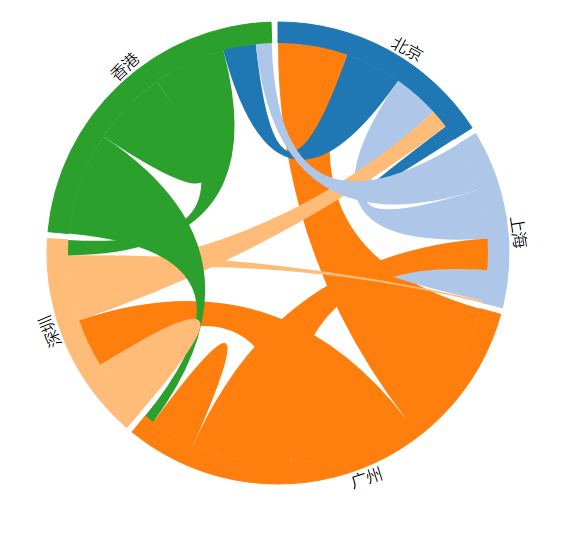
两点之间的连线,表示两者之间具有联系;线的粗细代表权重
线的两端的意义:例如广州和北京,广州一侧的宽度大于北京一侧的宽度,代表北京迁到广州的多于广州迁到北京的